. 2023 Oct 18;111(20):3195-3210.e7.
doi: 10.1016/j.neuron.2023.07.006. Epub 2023 Aug 4.

TMEM63 proteins function as monomeric high-threshold mechanosensitive ion channels

Affiliations

TMEM63 proteins function as monomeric high-threshold mechanosensitive ion channels

Wang Zheng et al. Neuron. .

Abstract

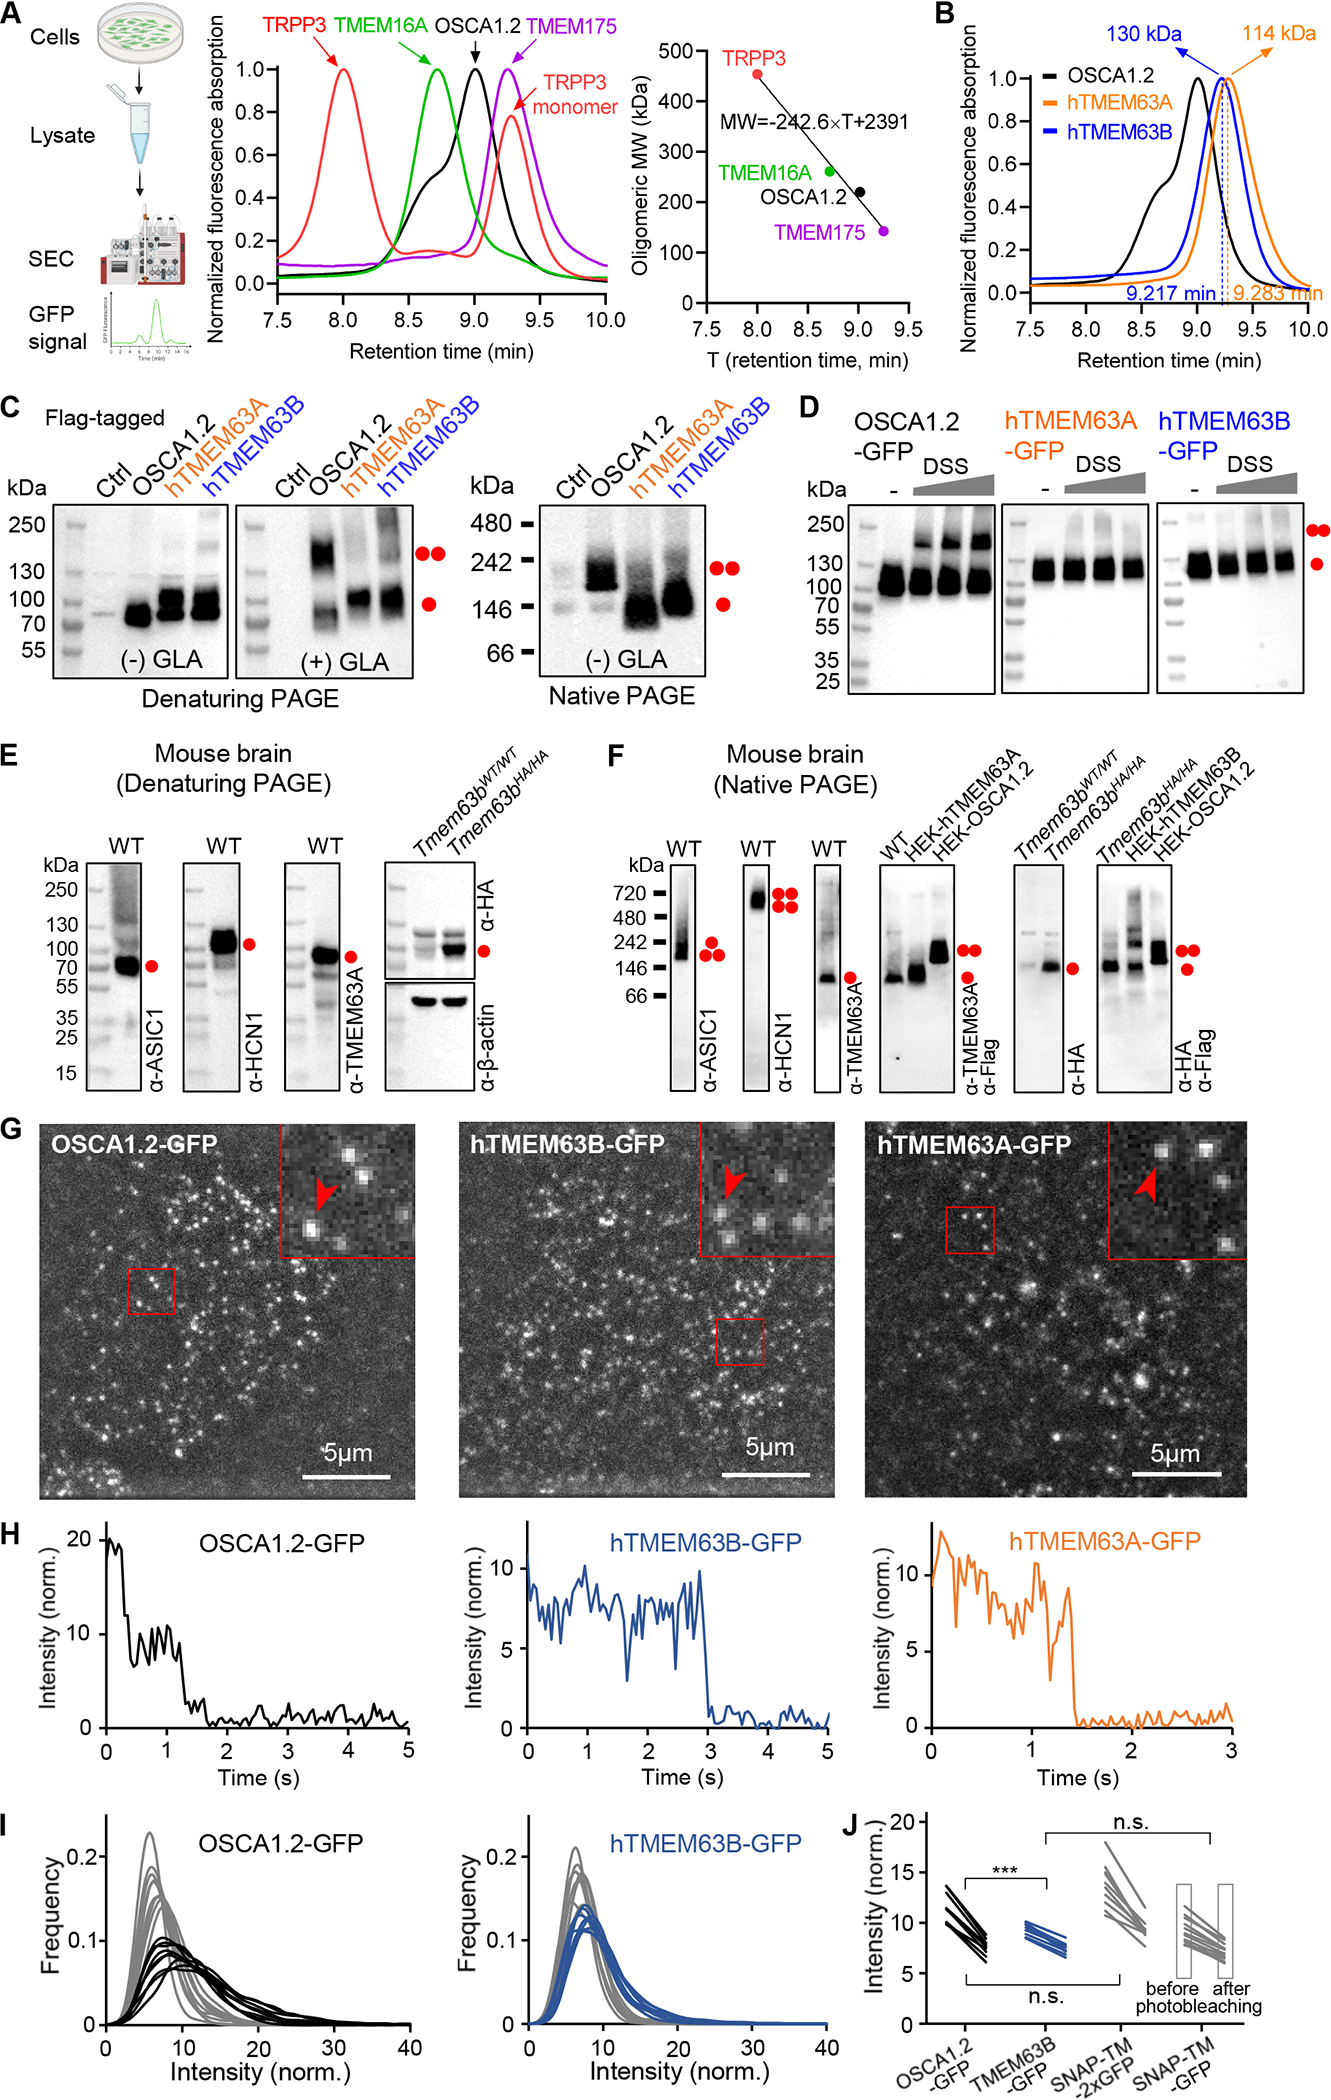
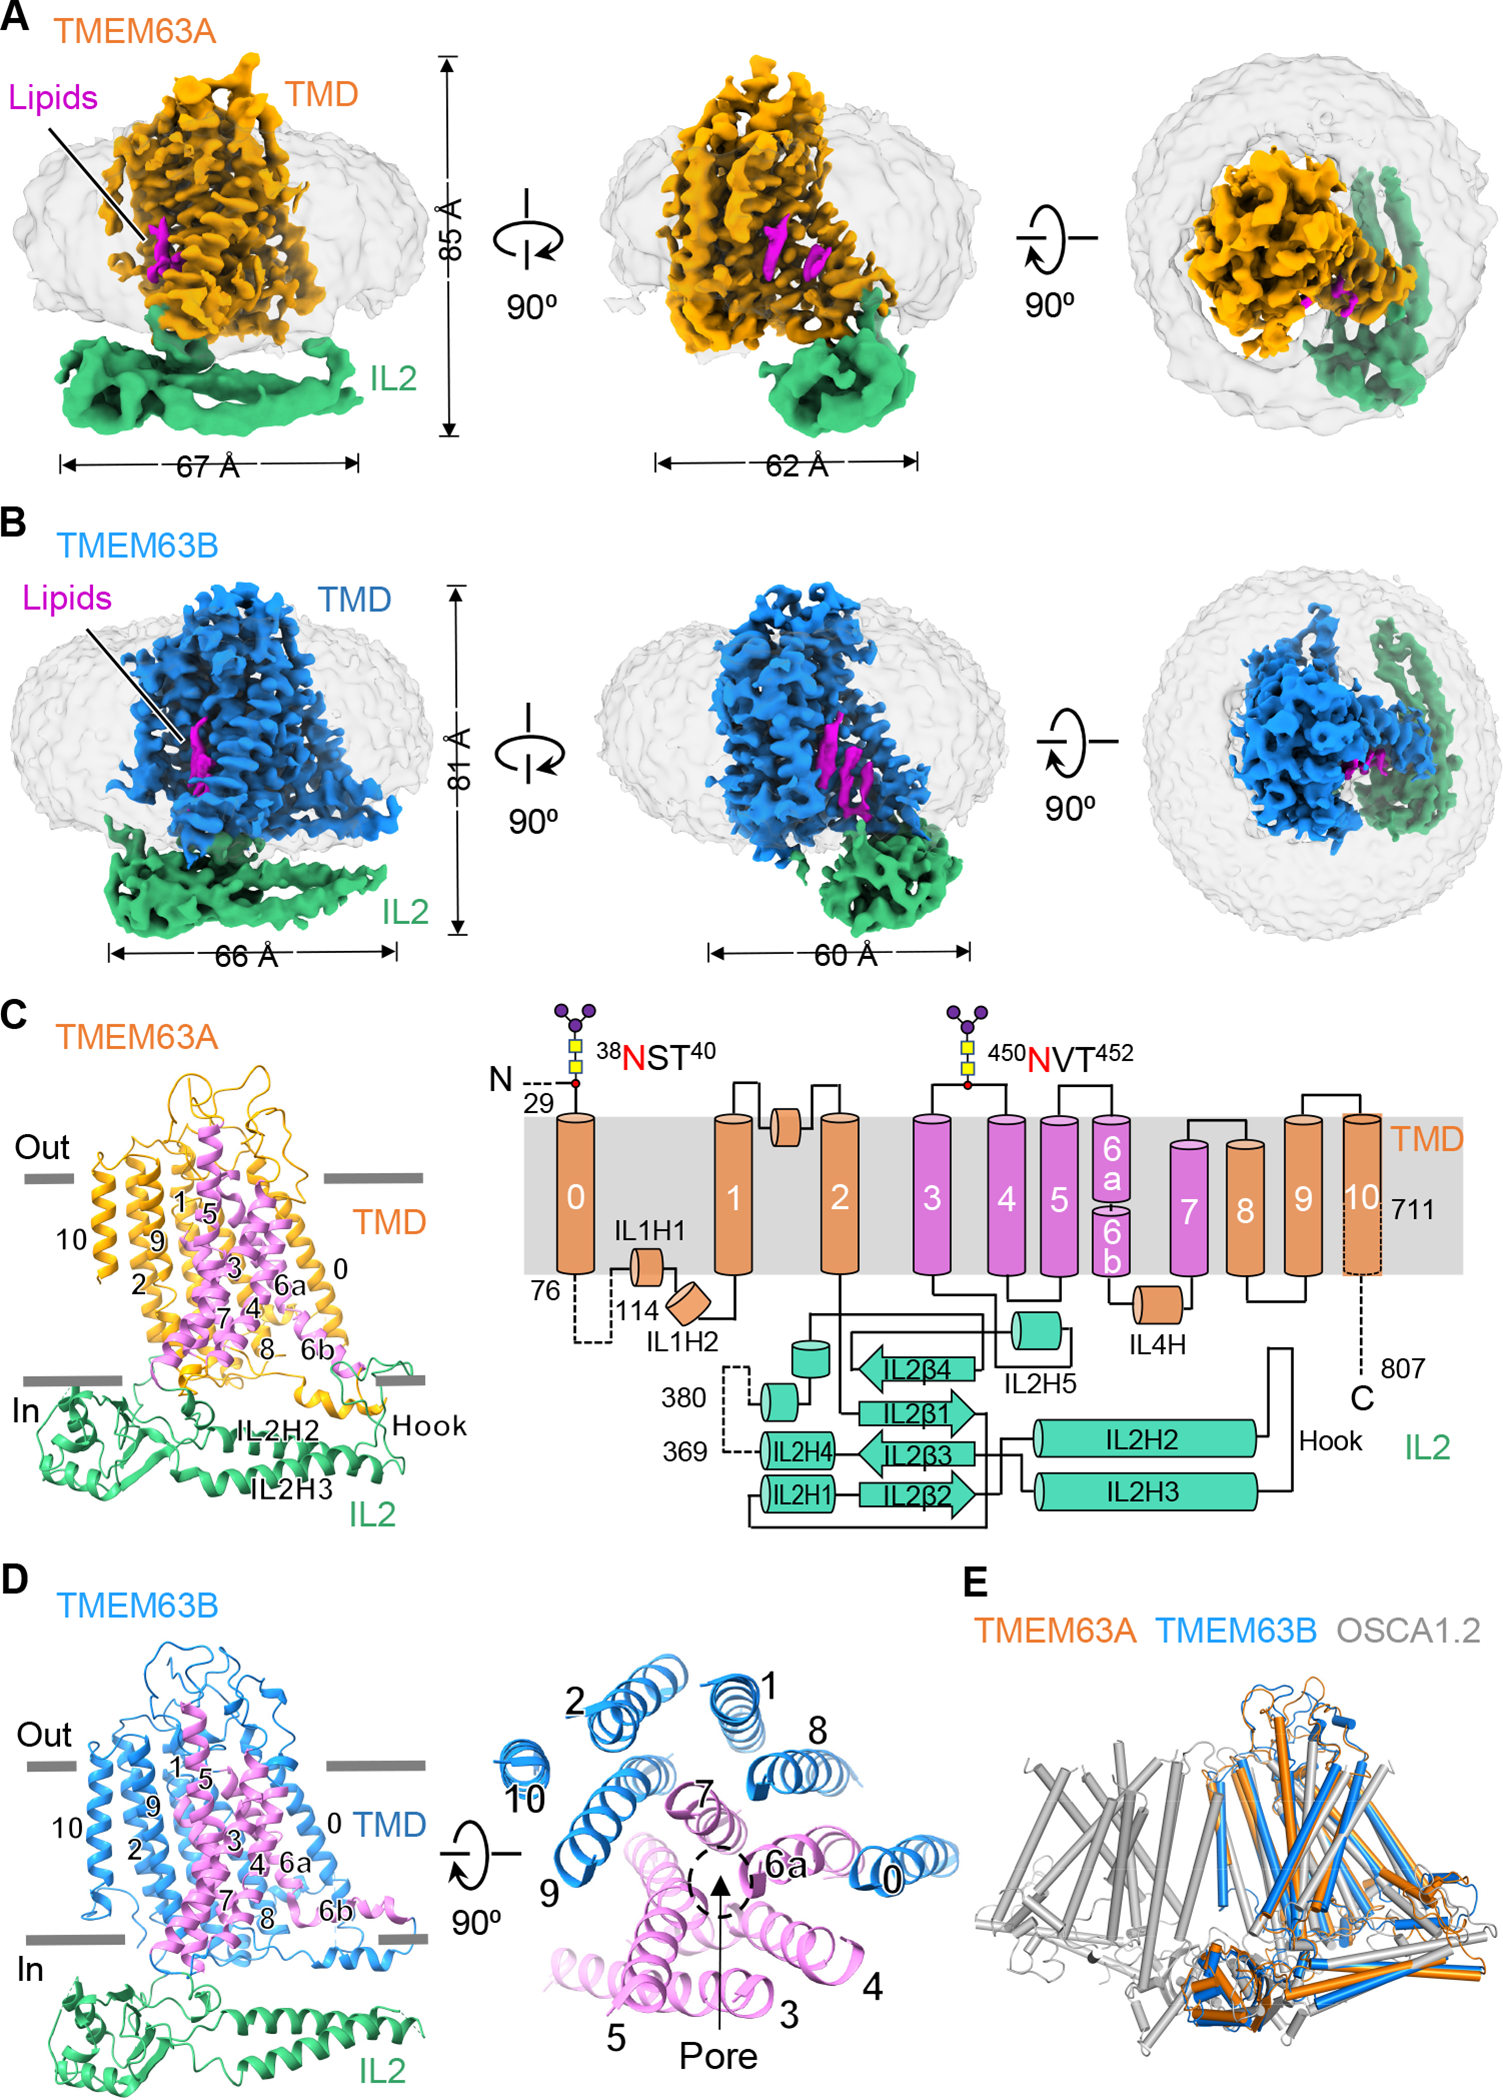
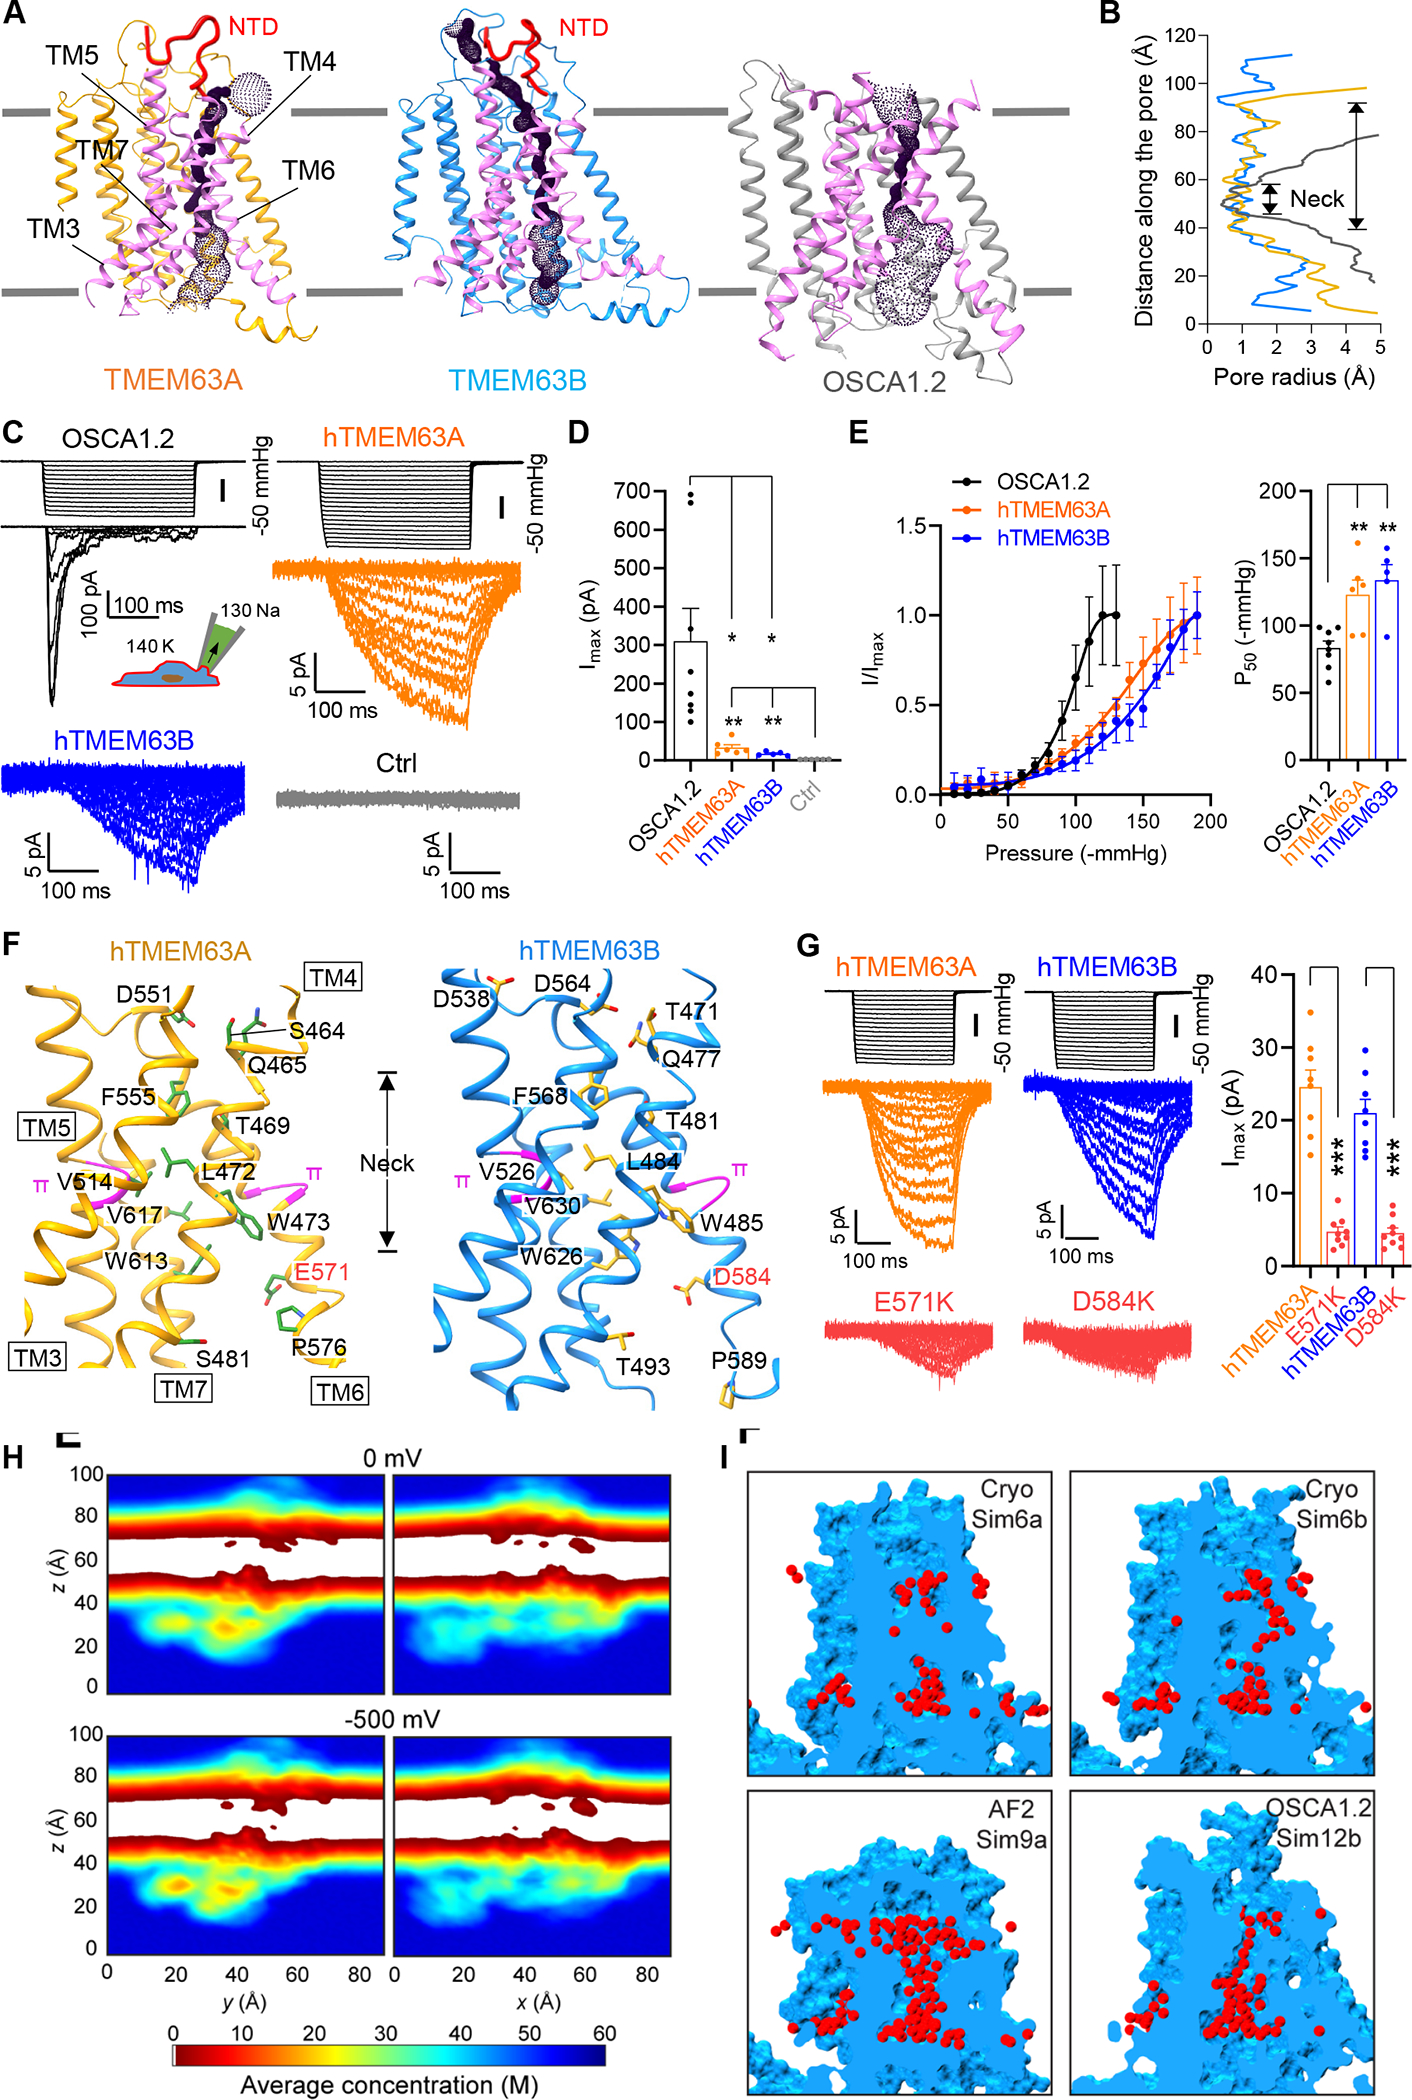
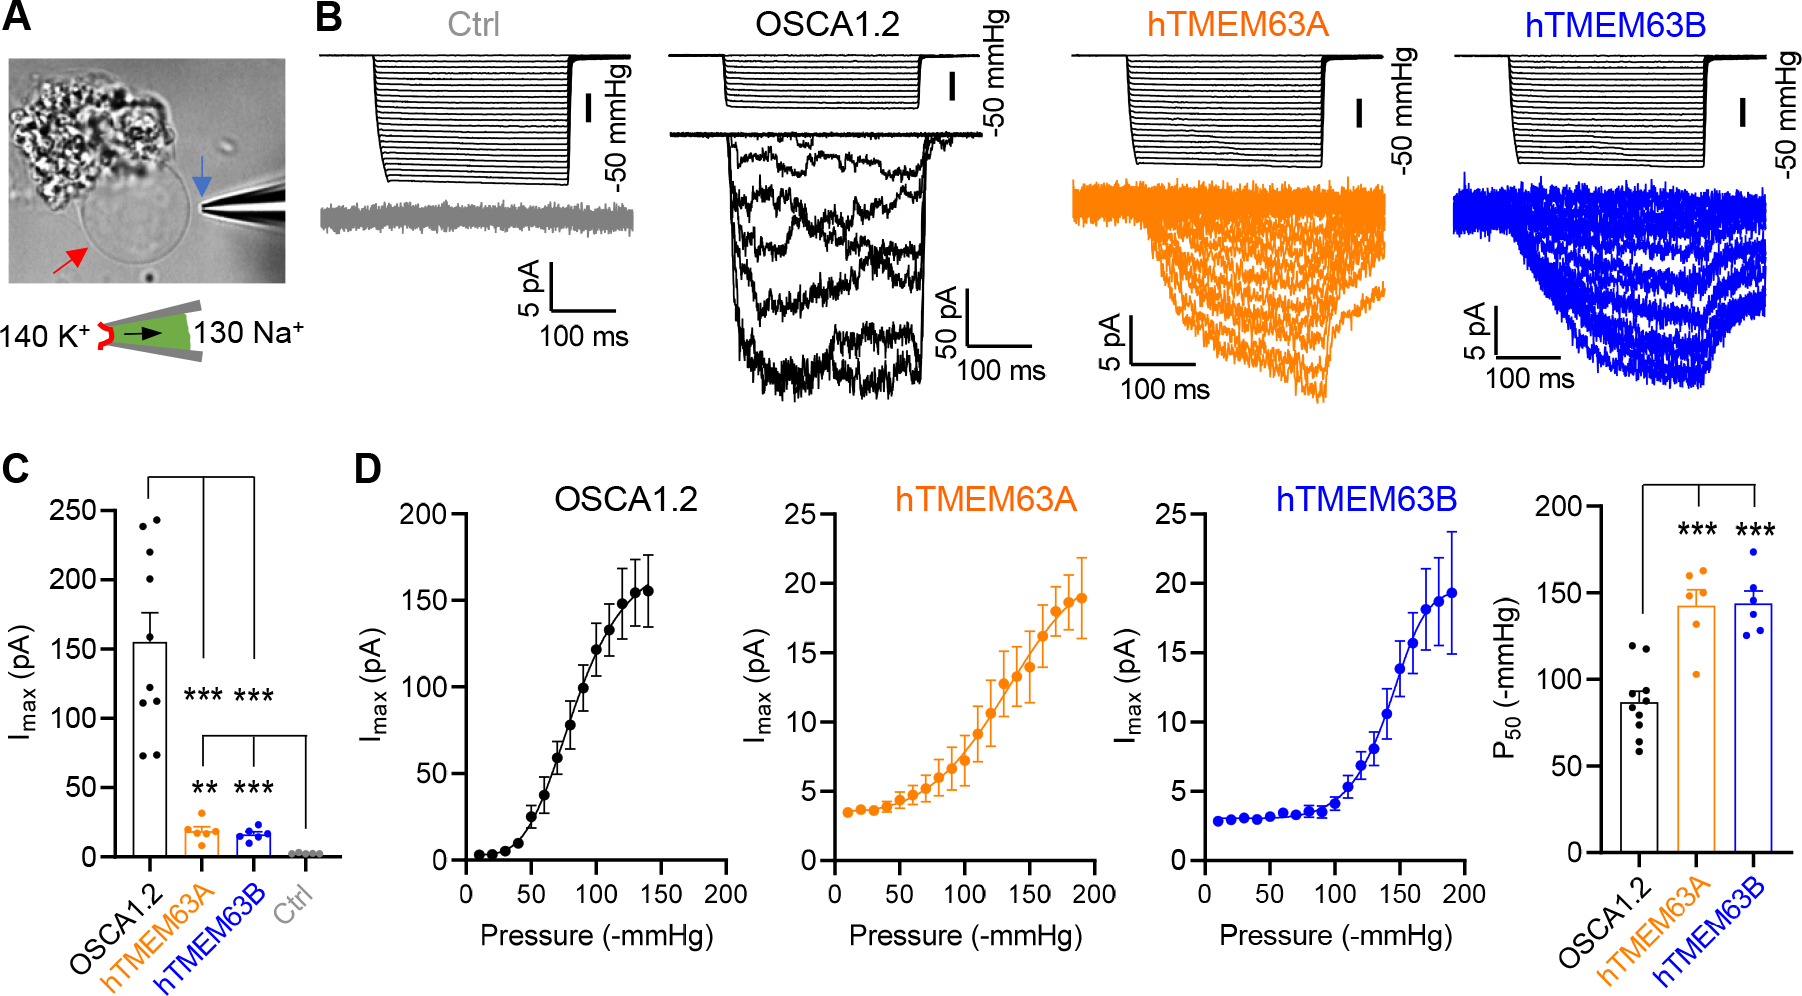
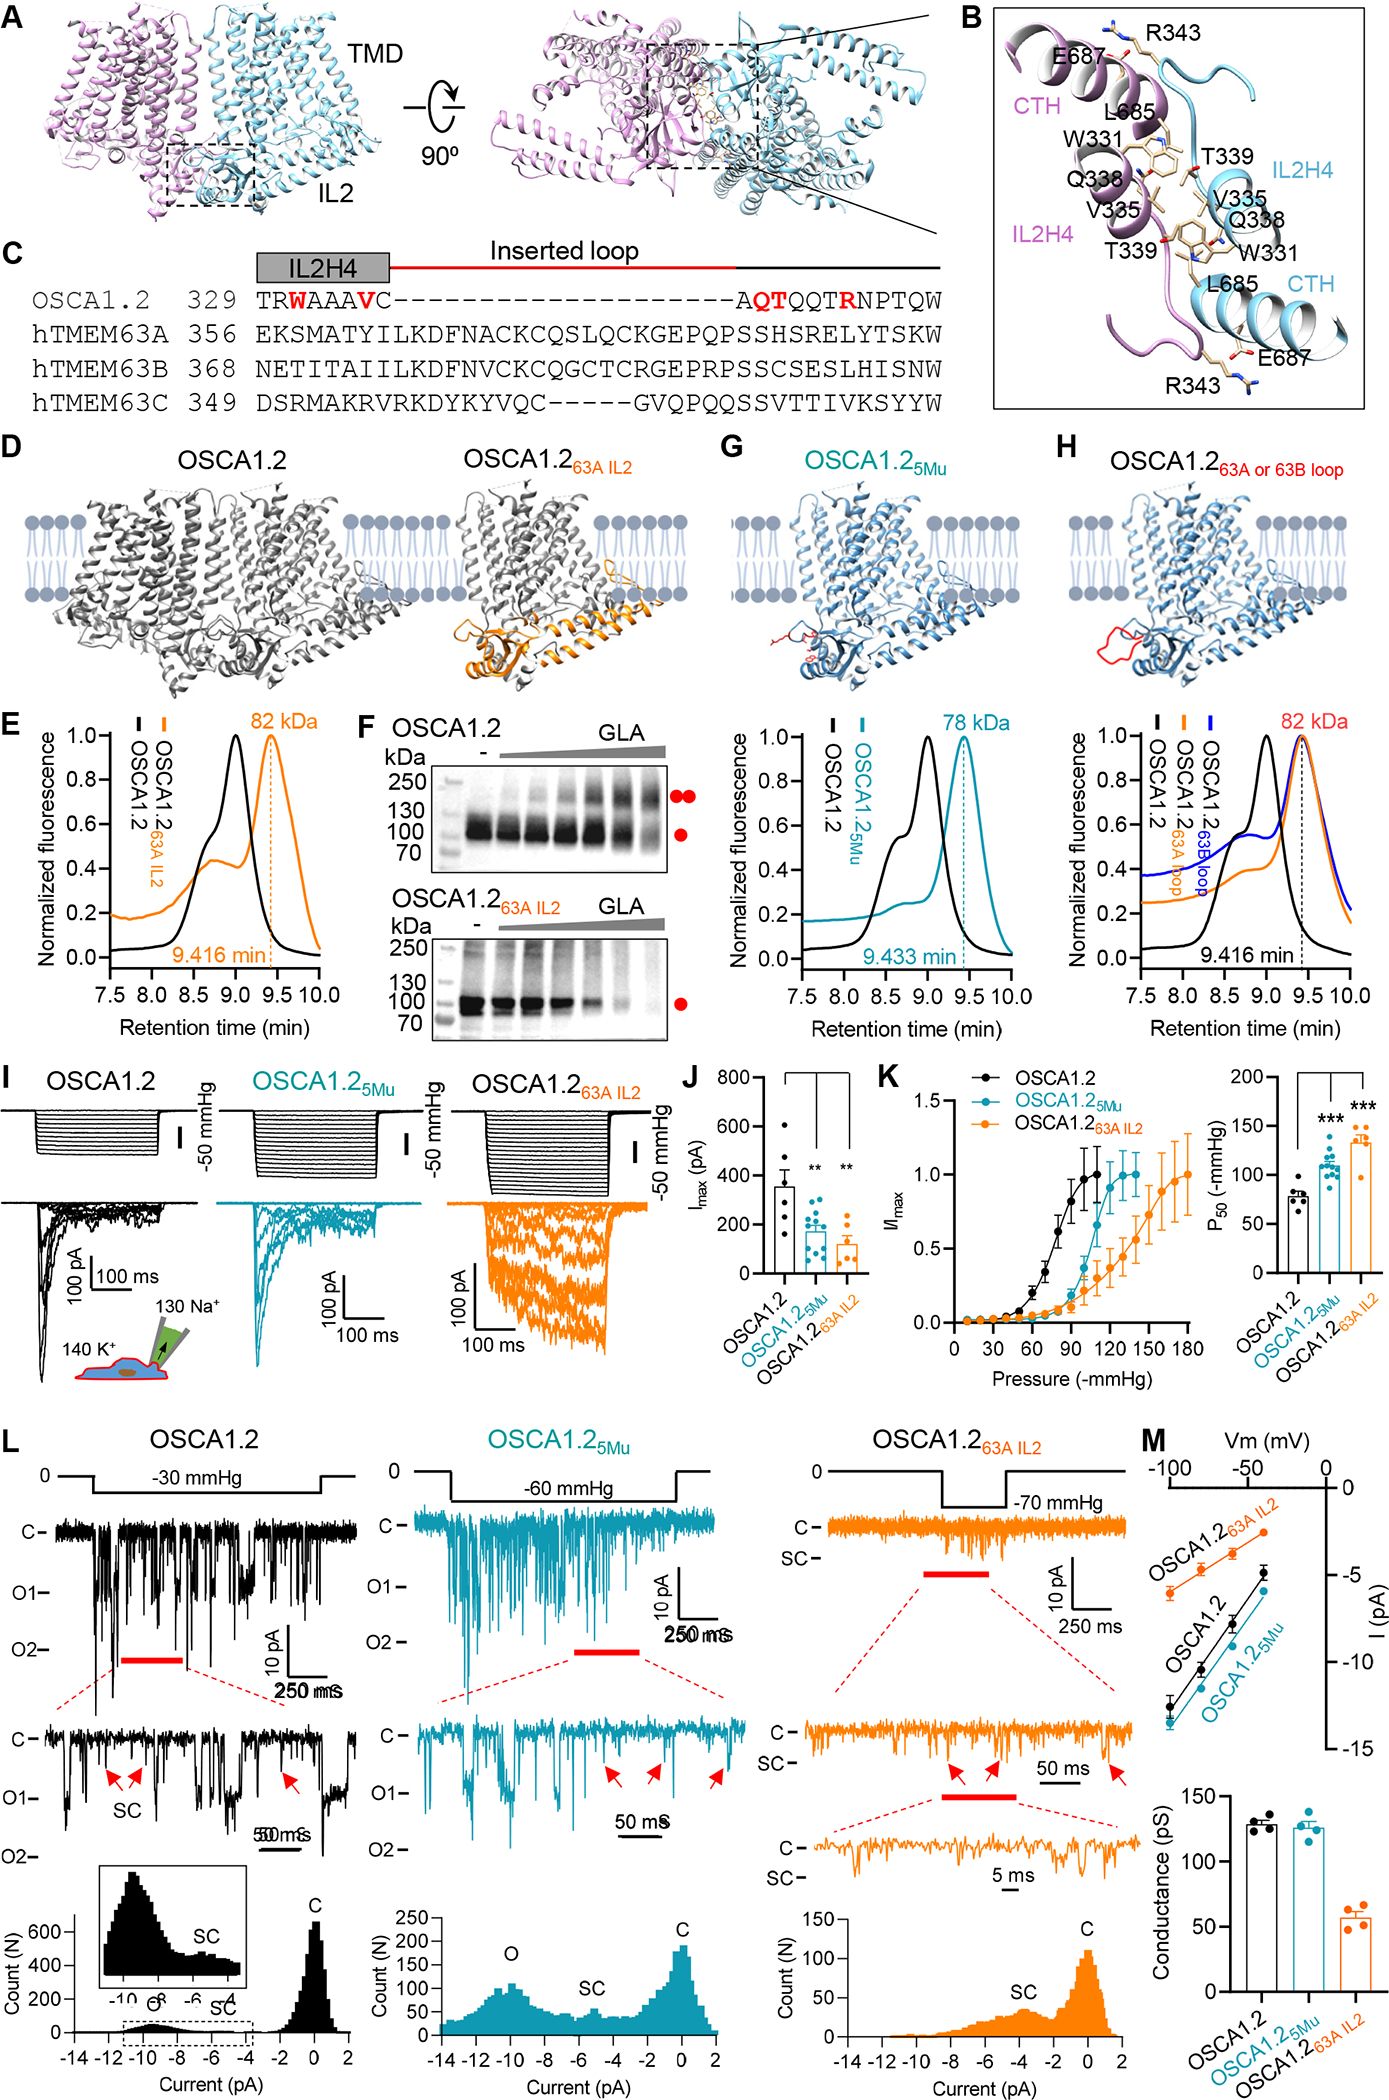
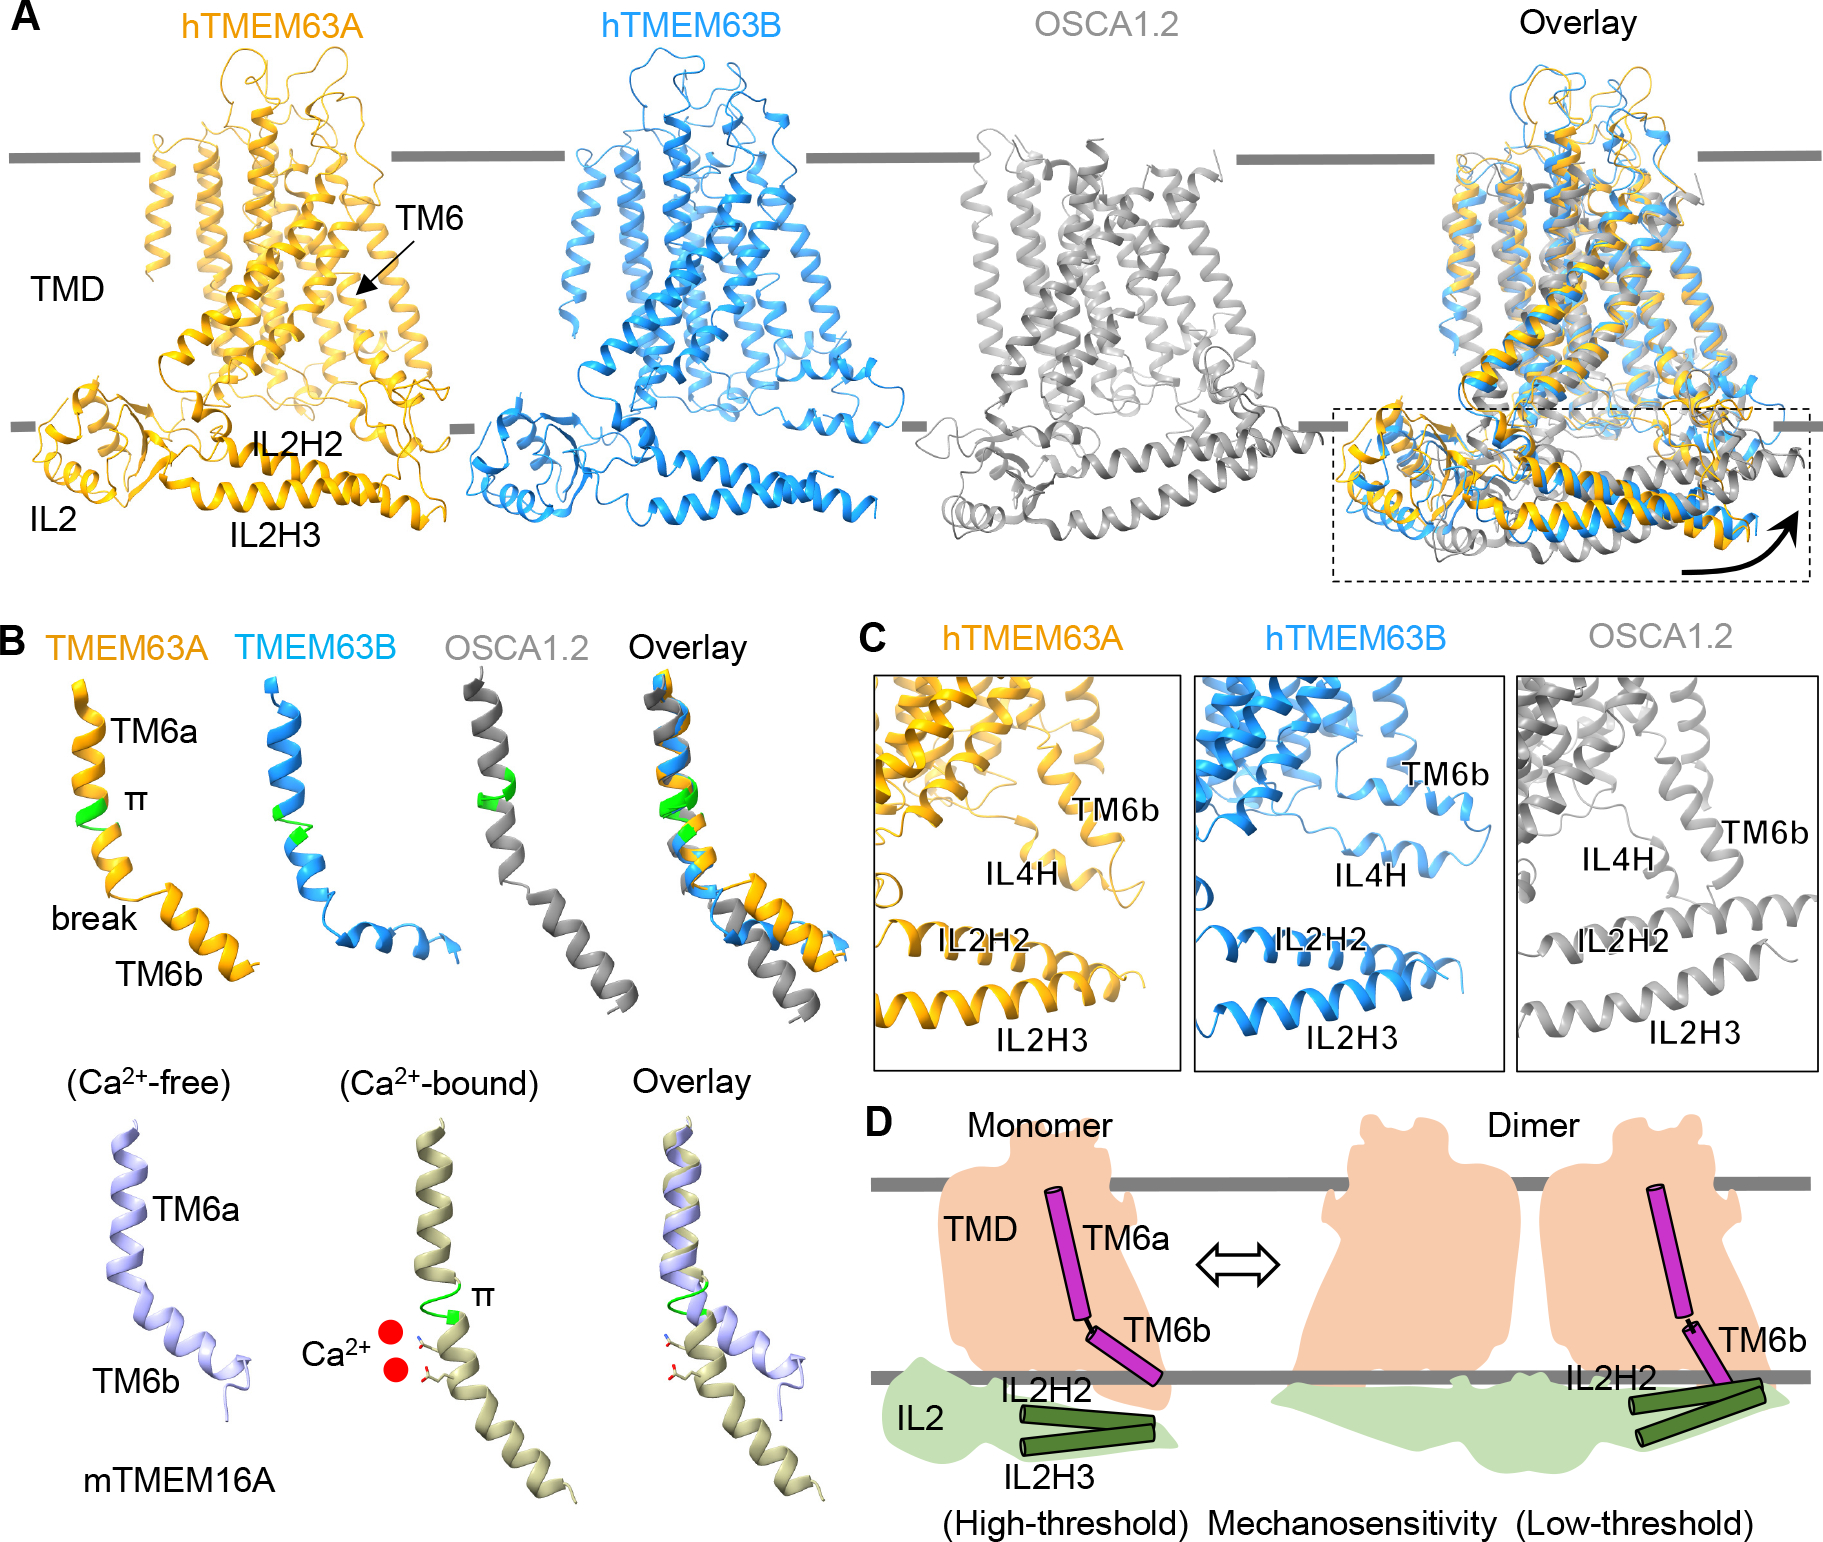
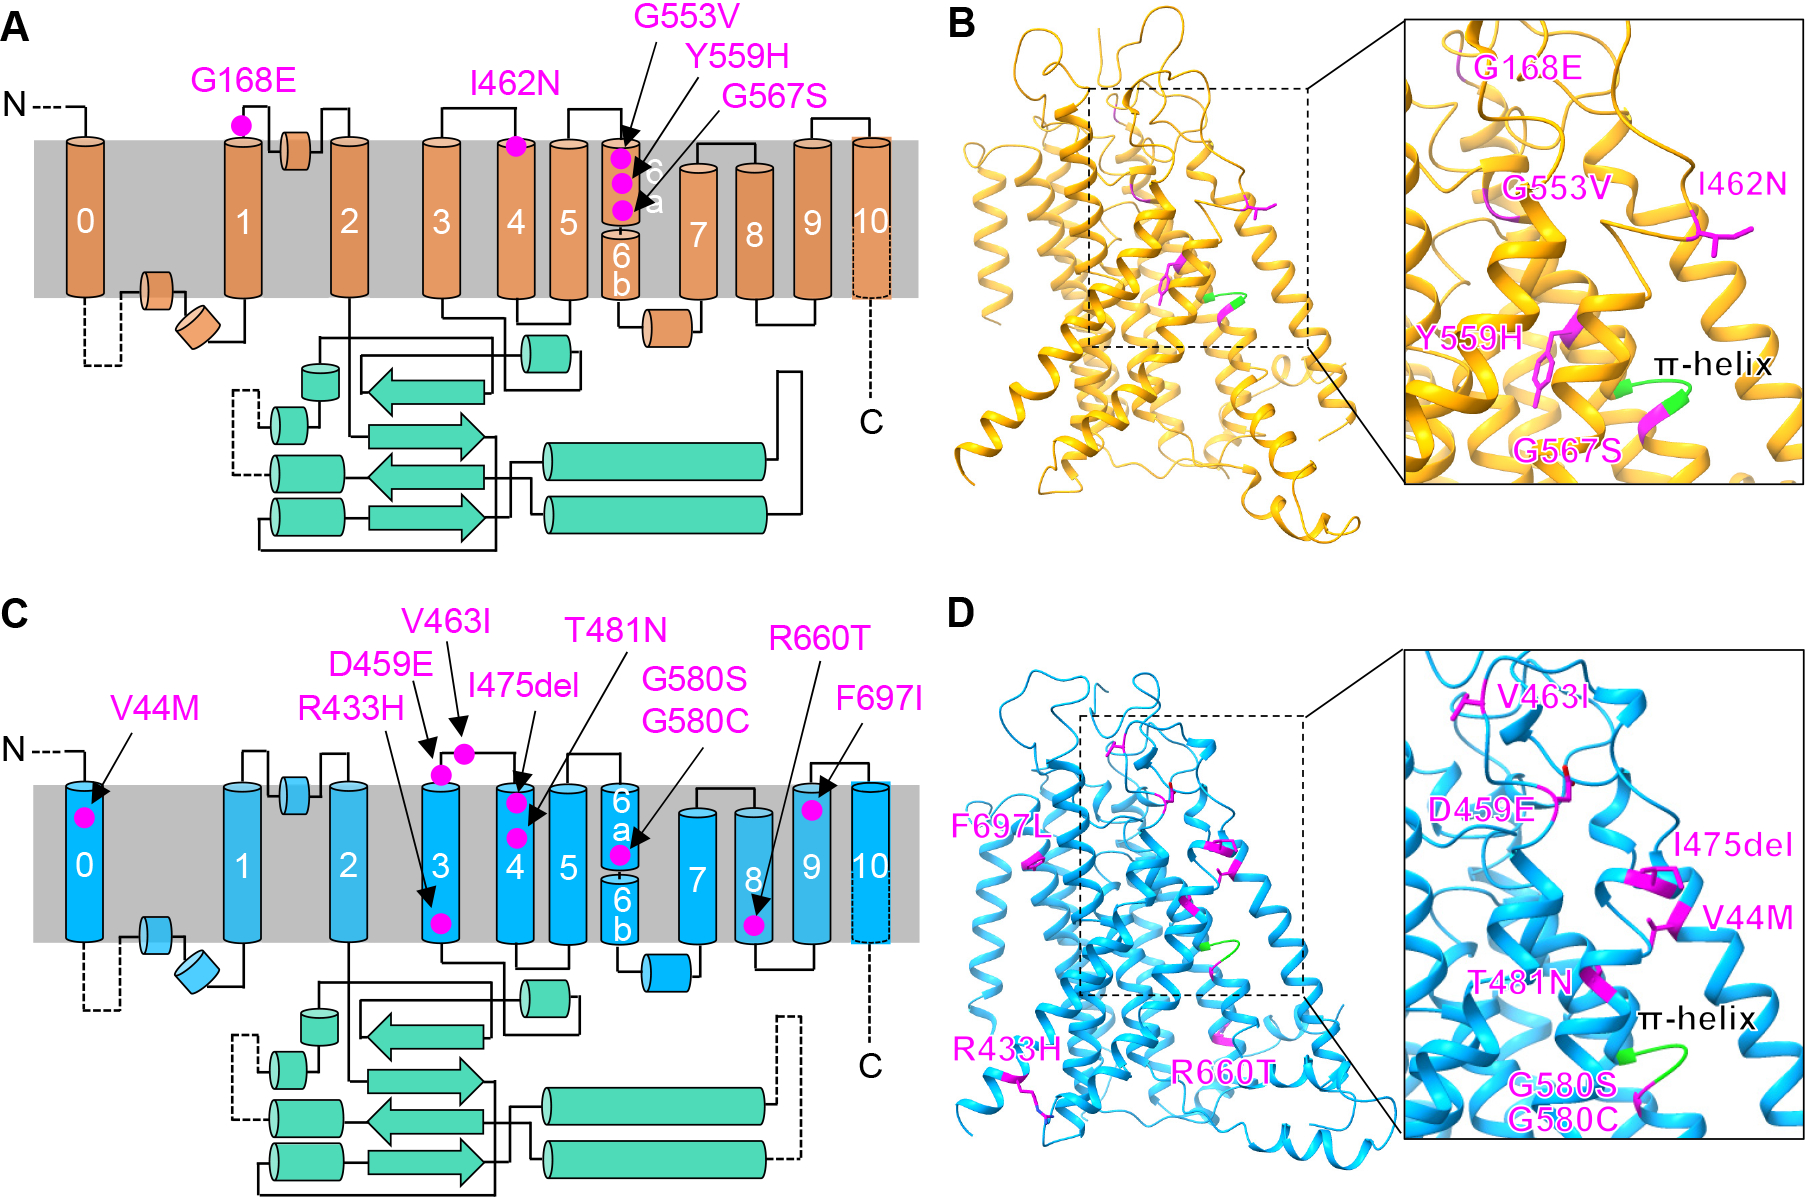
OSCA/TMEM63s form mechanically activated (MA) ion channels in plants and animals, respectively. OSCAs and related TMEM16s and transmembrane channel-like (TMC) proteins form homodimers with two pores. Here, we uncover an unanticipated monomeric configuration of TMEM63 proteins. Structures of TMEM63A and TMEM63B (referred to as TMEM63s) revealed a single highly restricted pore. Functional analyses demonstrated that TMEM63s are bona fide mechanosensitive ion channels, characterized by small conductance and high thresholds. TMEM63s possess evolutionary variations in the intracellular linker IL2, which mediates dimerization in OSCAs. Replacement of OSCA1.2 IL2 with TMEM63A IL2 or mutations to key variable residues resulted in monomeric OSCA1.2 and MA currents with significantly higher thresholds. Structural analyses revealed substantial conformational differences in the mechano-sensing domain IL2 and gating helix TM6 between TMEM63s and OSCA1.2. Our studies reveal that mechanosensitivity in OSCA/TMEM63 channels is affected by oligomerization and suggest gating mechanisms that may be shared by OSCA/TMEM63, TMEM16, and TMC channels.

Keywords: IL2; OSCA; TM6; TMC; TMEM16; TMEM63; high-threshold; ion channel; mechanosensitive; oligomerization.


Conflict of interest statement

Declaration of interests The authors declare no competing interests.

Figures

Figure 1.
Figure 1.. TMEM63A and TMEM63B exist as monomers.
(A) Left, schematic diagram of FSEC; middle, normalized FSEC traces of GFP-tagged membrane proteins; right, oligomeric MW (with GFP) versus retention time fit deduced from middle panel data. (B) Normalized FSEC traces of OSCA1.2, human TMEM63A and TMEM63B. Calculated oligomeric MWs (without GFP) are shown. (C) Representative denaturing and blue native PAGE of HEK293T cell lysates without (Ctrl) or with indicated protein overexpression. The cell lysate was treated without (−) or with (+) 10 mM glutaraldehyde (GLA). Monomeric and dimeric protein bands are indicated. (D) Representative western blots of HEK293T cell lysates with overexpression of GFP-tagged proteins. Cells were treated without or with membrane permeable disuccinimidyl suberate (DSS) (in mM: 0.0312, 0.0625, 0.125) before lysate preparation. (E) Representative denaturing PAGEs of whole brain tissue of Tmem63bWT/WT (WT) or Tmem63bHA/HA knock-in mice. (F) Representative blue native PAGEs of membrane fraction of mouse brain tissues. HEK293T cell lysates with overexpression of Flag-tagged proteins were also included. (G) Single-molecule images from the first frames of CHO cells expressing OSCA1.2-GFP, hTMEM63B-GFP and hTMEM63A-GFP. (H) Intensity time courses of marked spots from panel G. (I) Intensity distribution before (black, blue) and after (gray) photobleaching for OSCA1.2-GFP and hTMEM63B-GFP. (J) Mean intensity values before and after photobleaching for OSCA1.2-GFP, hTMEM63B-GFP and the control proteins containing one or two GFP tags. See also Figure S1.
Figure 2.
Figure 2.. Cryo-EM structures of human TMEM63A and TMEM63B.
(A and B) Side and top views of EM density maps of TMEM63A in nanodisc (A) and TMEM63B in detergent LMNG (B). Densities for the transmembrane domain (TMD) are colored in either orange (TMEM63A) or blue (TMEM63B). Densities of intracellular linker 2 (IL2) are colored green. Densities of nanodisc and detergent are grey. Lipid densities are highlighted in magenta. (C) Left, side view of TMEM63A in ribbon representation, with the pore-lining helices (TM3-TM7) colored in magenta. Right, topology diagram of TMEM63A with major structural components highlighted. Dashed lines denote regions excluded in model building due to missing density. Two N-linked glycosylation sites were predicted based on the protruding densities near N38 and N450 (Figure S4). (D) Left, side view of TMEM63B with the pore-lining helices (TM3-TM7) colored in magenta. Right, top view of the TM segments of TMEM63B with the location of the pore indicated. (E) Structural alignments of monomeric human TMEM63A and TMEM63B with one subunit of dimeric OSCA1.2 (PDB: 6MGV). See also Figure S2–S4 and S8, Table S1.
Figure 3.
Figure 3.. Ion permeation pores in TMEM63s.
(A) Predicted location of the pore in TMEM63A, TMEM63B and OSCA1.2 (PDB: 6MGV). Pore-lining TMs are colored in magenta and N-terminal domains (NTDs) in TMEM63A and TMEM63B are accentuated by thickening line and colored in red. (B) Van der Waals pore radii against distance along the pore, with neck regions indicated. (C) Representative traces of stretch-activated currents (−80 mV) from HEK293T cells without (Ctrl) or with indicated protein overexpression. A diagram was shown to indicate main cations (mM) used in the bath and pipette solutions. (D) Quantification of maximal current amplitude (Imax) from individual patches. *p<0.05, **p<0.01 (E) Left, Average and normalized pressure-response current curves fitted with a Boltzmann equation. OSCA1.2 (N = 8), hTMEM63A (N = 6), hTMEM63B (N = 5). Right, quantification of P50 values. **p<0.01. (F) Pore-lining residues in TMEM63A (Left) and TMEM63B (Right) from HOLE analysis. (G) Left, representative traces of stretch-activated currents from HEK293T cells expressing hTMEM63A, hTMEM63B or indicated mutants; Right, quantification of Imax. ***p<0.001. (H) Two-dimensional slices showing time- and space-averaged water concentrations for different all-atom MD simulations (Sim1a – top; Sim1b – bottom; see also Figure S7). (I) Examples of transient water channels formed in simulations of our experimentally derived TMEM63B model (Sim6a and Sim6b), of an AlphaFold2 (AF2) TMEM63B model (Sim9a), and of an experimentally derived model of OSCA1.2. See also Figure S5–S7, Table S2.
Figure 4.
Figure 4.. TMEM63A and TMEM63B form high-threshold mechanosensitive ion channels.
(A) Representative image showing a proteoliposome, indicated by a red arrow, grown from the lipid cloud. A recording pipette, indicated by a blue arrow, is also shown for excised patch recording. (B) Representative traces of stretch-activated currents from unilamellar liposomes reconstituted without (Ctrl) or with indicated purified proteins. (C) Quantification of Imax. OSCA1.2 (N = 10), hTMEM63A (N = 6), hTMEM63B (N = 6) or Ctrl (N = 5). **p<0.01, ***p<0.001. (D) Average pressure-response current curves fitted with a Boltzmann equation for OSCA1.2 (N = 10), hTMEM63A (N = 6) and hTMEM63B (N = 6). The right panel shows quantification of P50 values. ***p<0.001. See also Figure S1.
Figure 5.
Figure 5.. The oligomeric configuration affects mechanosensitivity of OSCA/TMEM63s.
(A) Side and bottom views of dimeric OSCA1.2 (PDB: 6MGV). The rectangle indicates the dimerization interface in IL2. (B) Enlarged dimerization interface in OSCA1.2, with interacting residues are shown. CTH, C-terminal helix (L685-R698). (C) Sequence alignment of the region within IL2 that mediates the dimerization of OSCA1.2. Residues that directly mediate OSCA1.2 dimerization are highlighted in red. The inserted loop in TMEM63s is indicated by the red line. (D) Illustrations of dimeric OSCA1.2 and monomeric chimera protein OSCA1.263A IL2. (E) Normalized FSEC traces of GFP-tagged OSCA1.2 and OSCA1.263A IL2, with MW of the OSCA1.263A IL2 (without GFP) indicated. (F) Representative western blots of GFP-tagged OSCA1.2 (upper) or OSCA1.263A IL2 (lower). Cell lysates were treated without or with GLA at various concentrations (in mM: 0.3125, 0.625, 1.25, 2.5, 5, 10). (G) Illustration of monomeric OSCA1.25Mu mutant containing 5 mutations, W331G, V335G, Q338G, T339G R343A (Upper), and normalized FSEC traces (Lower). (H) Illustration of monomeric OSCA1.2 with inserted 20-aa loop from hTMEM63A (OSCA1.263A loop) or hTMEM63B (OSCA1.263B loop) (Upper) and normalized FSEC traces (Lower). (I and J) Representative traces of stretch-activated currents recorded from HEK293T cells (I) and quantification of Imax (J). **p<0.01. (K) Left, average and normalized pressure-response current curves fitted with a Boltzmann equation for OSCA1.2 (N = 6), OSCA1.25Mu (N = 12), OSCA1.263A IL2 (N = 6); Right, quantification of P50 from individual patches. ***p<0.001. (L) Single-channel currents recorded at −80 mV. The closed (C) and fully open (O) states are indicated. Red arrows mark the assumed sub-conductance (SC) state. Current amplitude histogram for each trace is shown at the bottom. (M) Upper, averaged current-voltage relationship. OSCA1.2 (N = 4), OSCA1.25Mu (N = 4), OSCA1.263A IL2 (N = 4); Lower, the mean single-channel conductance from individual patches. See also Figure S9.
Figure 6.
Figure 6.. The oligomeric configuration affects conformations of mechano-gating elements, including IL2 and TM6, in OSCA/TMEM63 family.
(A) Structural comparisons among hTMEM63A, hTMEM63B and OSCA1.2 (one subunit, PDB: 6MGV) based on the alignment of TMDs. Arrows indicate the movement of IL2 domain from the conformation in hTMEM63A or hTMEM63B to that in OSCA1.2. (B) Upper, ribbon representations of TM6 from hTMEM63A, hTMEM63B and OSCA1.2 (PDB: 6MGV). A π-helix in the TM6 is colored in green and a break point in the TM6 is indicated. Lower, TM6 from mouse TMEM16A in Ca2+-free (PDB: 5OYG) and Ca2+-bound (PDB: 5OYB) conformations. The π-helix and Ca2+ ions in the Ca2+-bound state are shown. (C) Structural comparisons showing the relative positions of IL2H2/IL2H3 to TM6b/IL4H in hTMEM63A, hTMEM63B and OSCA1.2. The hook domain is not shown for clarity. (D) Schematic diagram showing distinct conformations of IL2 and TM6 in monomeric and dimeric OSCA/TMEM63 proteins. See also Figure S9 and S10.
Figure 7.
Figure 7.. Disease-associated variants in humans identified in TMEM63A and TMEM63B.
(A and C) Location of five mutations of TMEM63A (A) and 10 mutations of TMEM63B (C) on a topology diagram. (B and D) Mutations mapped to structures of TMEM63A (B) and TMEM63B (D). See also Figure S8.

Comment in

References

    1. Kefauver JM, Ward AB, and Patapoutian A (2020). Discoveries in structure and physiology of mechanically activated ion channels. Nature 587, 567–576. 10.1038/s41586-020-2933-1. - DOI - PMC - PubMed
    1. Cox CD, Bavi N, and Martinac B (2019). Biophysical Principles of Ion-Channel-Mediated Mechanosensory Transduction. Cell Rep 29, 1–12. 10.1016/j.celrep.2019.08.075. - DOI - PubMed
    1. Douguet D, and Honore E (2019). Mammalian Mechanoelectrical Transduction: Structure and Function of Force-Gated Ion Channels. Cell 179, 340–354. 10.1016/j.cell.2019.08.049. - DOI - PubMed
    1. Jin P, Jan LY, and Jan YN (2020). Mechanosensitive Ion Channels: Structural Features Relevant to Mechanotransduction Mechanisms. Annu Rev Neurosci 43, 207–229. 10.1146/annurev-neuro-070918-050509. - DOI - PubMed
    1. Murthy SE, Dubin AE, and Patapoutian A (2017). Piezos thrive under pressure: mechanically activated ion channels in health and disease. Nat Rev Mol Cell Biol 18, 771–783. 10.1038/nrm.2017.92. - DOI - PubMed

Publication types