Multicenter Study
. 2023 Aug 5;80(8):241.
doi: 10.1007/s00018-023-04885-7.

Multi-omics profiling of CSF from spinal muscular atrophy type 3 patients after nusinersen treatment: a 2-year follow-up multicenter retrospective study

Affiliations
Multicenter Study

Multi-omics profiling of CSF from spinal muscular atrophy type 3 patients after nusinersen treatment: a 2-year follow-up multicenter retrospective study

Irene Faravelli et al. Cell Mol Life Sci. .

Abstract

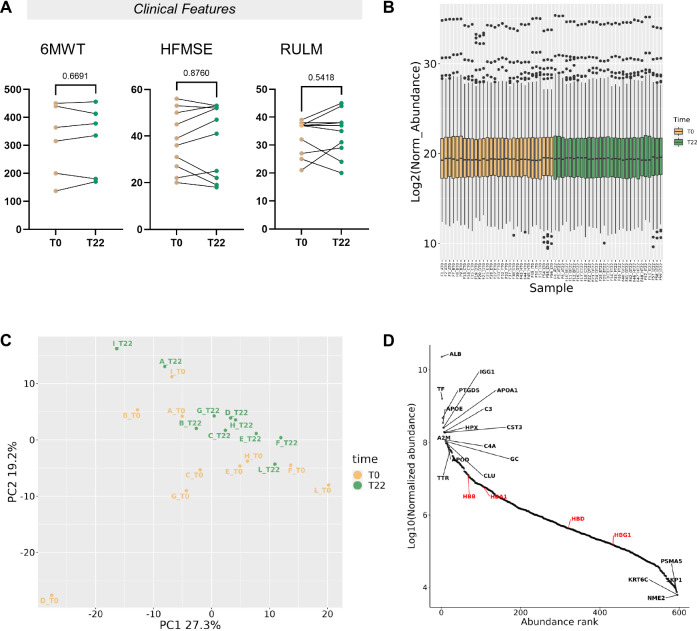
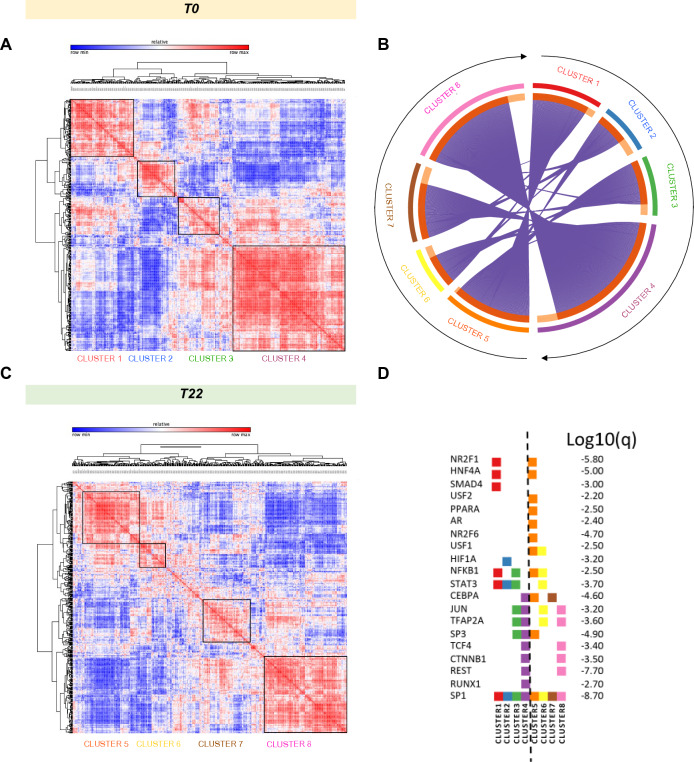
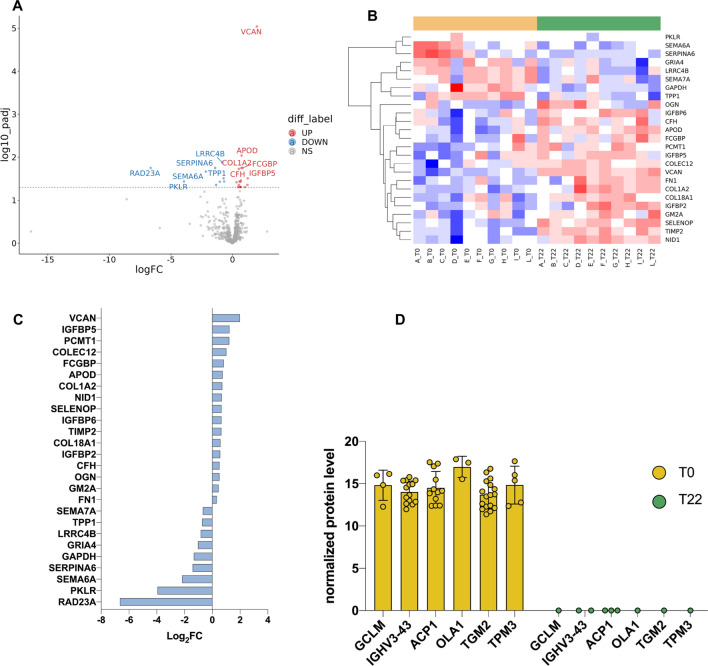
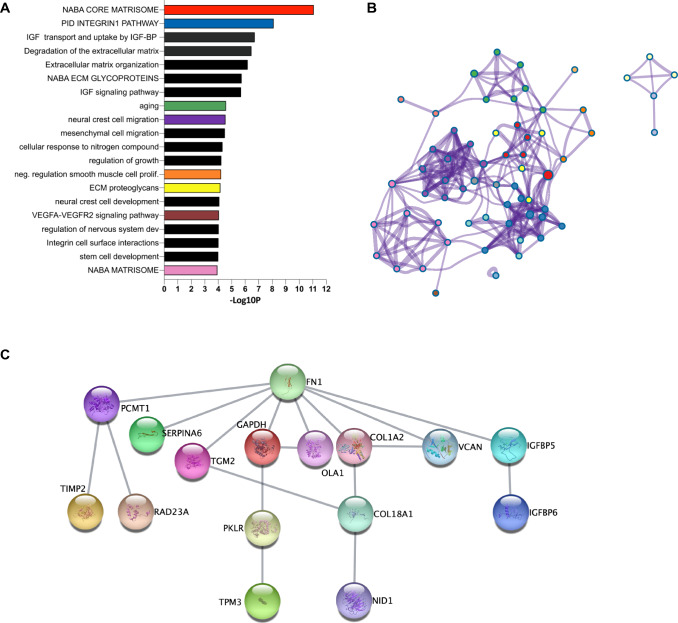
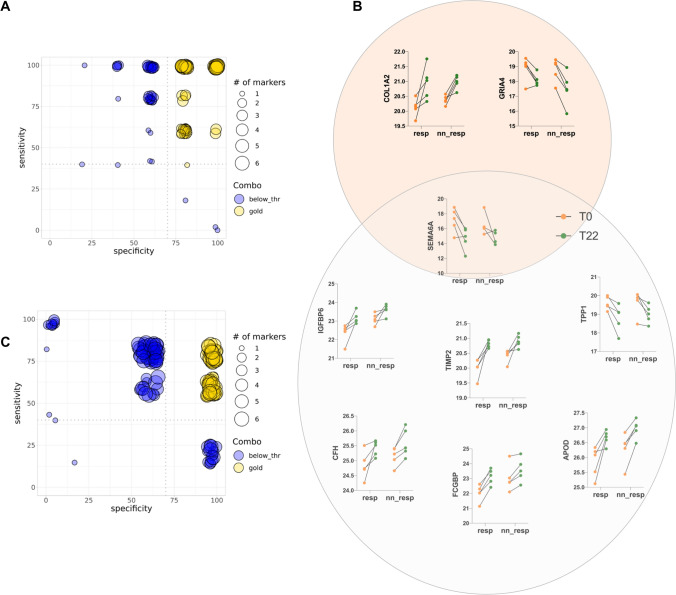
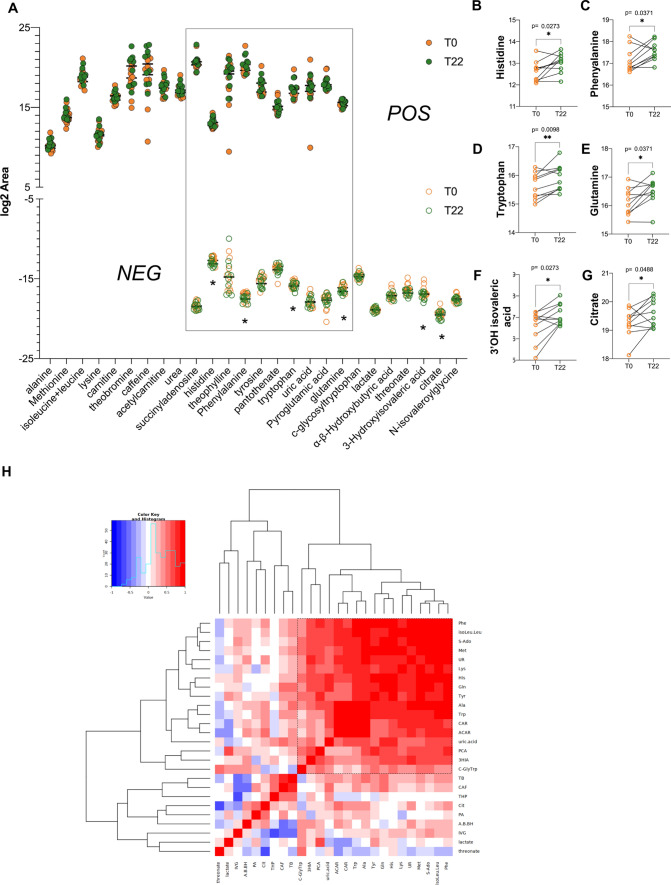
Spinal muscular atrophy (SMA) is a neurodegenerative disorder caused by mutations in the SMN1 gene resulting in reduced levels of the SMN protein. Nusinersen, the first antisense oligonucleotide (ASO) approved for SMA treatment, binds to the SMN2 gene, paralogue to SMN1, and mediates the translation of a functional SMN protein. Here, we used longitudinal high-resolution mass spectrometry (MS) to assess both global proteome and metabolome in cerebrospinal fluid (CSF) from ten SMA type 3 patients, with the aim of identifying novel readouts of pharmacodynamic/response to treatment and predictive markers of treatment response. Patients had a median age of 33.5 [29.5; 38.25] years, and 80% of them were ambulant at time of the enrolment, with a median HFMSE score of 37.5 [25.75; 50.75]. Untargeted CSF proteome and metabolome were measured using high-resolution MS (nLC-HRMS) on CSF samples obtained before treatment (T0) and after 2 years of follow-up (T22). A total of 26 proteins were found to be differentially expressed between T0 and T22 upon VSN normalization and LIMMA differential analysis, accounting for paired replica. Notably, key markers of the insulin-growth factor signaling pathway were upregulated after treatment together with selective modulation of key transcription regulators. Using CombiROC multimarker signature analysis, we suggest that detecting a reduction of SEMA6A and an increase of COL1A2 and GRIA4 might reflect therapeutic efficacy of nusinersen. Longitudinal metabolome profiling, analyzed with paired t-Test, showed a significant shift for some aminoacid utilization induced by treatment, whereas other metabolites were largely unchanged. Together, these data suggest perturbation upon nusinersen treatment still sustained after 22 months of follow-up and confirm the utility of CSF multi-omic profiling as pharmacodynamic biomarker for SMA type 3. Nonetheless, validation studies are needed to confirm this evidence in a larger sample size and to further dissect combined markers of response to treatment.

Keywords: Antisense oligonucleotides; Metabolomic; Proteomic; Spinal muscular atrophy.


Conflict of interest statement

The authors confirm that there are no conflicts of interest.

Figures

Fig. 1
Fig. 1
Clinical and CSF proteomic characterization of SMA patients. A Changes in HFMSE, RULM and 6MWT scores after the first 22 months of treatment with Nusinersen are reported. Absolute values (higher indicates better) between baseline (yellow) and 22nd month (green) are depicted for each individual patient. B Box plots of Log2 Expression of VSN normalized proteomic data, before (yellow, T0) and after treatment (green, T22) are presented. The ten patients are labeled with letters from A to L. Three technical replicates are reported for each sample except for sample I at T22, when only two replicates were available. The VSN normalization produces consistent distributions across all samples and across all replicates, showing no obvious bias. C Principal component analysis (PCA) representing unsupervised proteomic data comparative analysis of samples at baseline (yellow label) and 22 months after treatment is plotted. The plot displays a significant separation of the two clusters. Each dot represents the mean average of normalized value of three technical replica for one subject (except for I-T22, in duplicate). Patients are identified with letters from A to L. PCA only based on the top selected features provide a modest separation. D Distribution profile for average CSF Log10 normalized abundance of each protein (y-axis) against rank order (from highest that is in position 1, to lowest that is in position 597, x-axis) is shown. Most and less abundant proteins along with hemoglobins (in red) are labeled to represent the dynamic range in the protein mixture
Fig. 2
Fig. 2
Cross-sectional CSF proteomic analysis. A, C Correlation maps of all proteins generated by clustering with Euclidean distance the Pearson correlation coefficients of all possible protein combinations at baseline and at T22, after nusinersen treatment are reported. On x- and y-axis all shared proteins are reported in the same sequential order after clustering to highlight the stronger correlation of expression for each time point. The abundance of proteins with similar regulation correlates across samples and forms clusters. Red corresponds to strong correlation and blue to divergent expression. Prominent clusters of proteins with high correlation are framed with a black square. Each cluster has been identified with a numeric color-coded label, cluster 1–4 for T0 and 5–8 for T22. B The circos plot (Metascape) shows how proteins from each cluster overlap. On the outside, each arc represents the identity of each protein list, using the same color code as the color used for the cluster identified in (A, C). On the inside, each arc represents a protein list, where each protein member of that list is assigned a spot on the arc. Dark orange color is for proteins that are shared by multiple lists and light orange color for proteins that are unique to that list. Purple lines link the same protein in different clusters specific for each time point(T0 and T22). The greater the number of purple links and the longer the dark orange arcs imply greater overlap among the input protein lists within cluster. D Protein lists are used to perform enrichments in the TRRUST ontology source as implemented in Metascape. Proteins are considered as genes. Q-values of enrichment calculated using the Benjamini–Hochberg correction to account for multiple testing are reported for 20 out of 24 identified significant enriched TRRUST GO (p < 0.01). Transcription factors regulating a subset of proteins in each cluster are listed on the left and ordered based on similarity of p-value enrichment (full data results in Suppl. Table 4). The TF SP1 is common to all clusters, while HIF1A is enriched exclusively in one cluster, and is therefore likely a signaling pathway specifically active a T0
Fig. 3
Fig. 3
Nusinersen treatment consequences at protein level. A Treatment vs Baseline protein fold changes are plotted versus log10 pvalue (y axis) in a volcano plot. Proteins above the dashed line are statistically significantly different (pAdj < 0.05), and those depicted in red (up) are more abundant upon treatment (n = 17) while those in blue (down) are reduced (n = 9) after treatment. On the x axis, the log fold change of expression is represented. B Heatmap of hierarchical clustering for significantly differentially expressed proteins (pAdj < 0.05) unveils two major clusters of proteins upregulated either at baseline (yellow) or after 22 months of treatment (green). Color code expression levels are scaled by row, with red color corresponding to high expression, blue color to low expression and white to undetected protein. RAD23A protein was not included in the heatmap because it was detected in sample F in all three technical replicates at baseline while only in one sample upon Nusinersen treatment. C The bar plot reports the ranked list of fold changes (x-axis) between T22 and baseline of significantly differentially expressed proteins (y-axis). Protein RAD23A is here included. Of note, RAD23A turns out to be the protein with the largest fold change. D A set of 6 proteins has been detected at baseline, in at least one subject and in at least one technical MS detection (clear yellow dot). The same proteins completely disappeared at T22 in all subjects (green dot)
Fig. 4
Fig. 4
Pathway analysis results of differentially expressed proteins before and after treatment. A The bar plot reports the ranked results (– log10 p value, x-axis) of the top 20 selected enriched terms (colored bars) among clusters after pathway and process enrichment analysis carried out with the following ontology sources: KEGG Pathway, GO Biological Processes, Reactome Gene Sets, Canonical Pathways, CORUM, WikiPathways and PANTHER Pathway as performed in Metascape using the list of significant differentially expressed proteins and 6 proteins detected only at baseline as described in Fig. 3. B A subset of top significant clusters were converted into a network layout, colored by cluster ID, where nodes (pathways) that share the same cluster ID are typically close to each other. Each term of a cluster is represented by a circle node, where its color represents its cluster identity (i.e., nodes of the same color belong to the same cluster) and its size is proportional to the number of input proteins that fall under that term. Terms with a similarity score > 0.3 are linked by an edge (the thickness of the edge represents the similarity score). The network is visualized with Cytoscape with “force-directed” layout and with the edge bundled. C All protein–protein physical interactions among input proteins (26 + 6) were extracted from PPI data source and formed a PPI network using STRING and BioGrid. The hierarchical representation is generated in Cytoscape
Fig. 5
Fig. 5
Combinatorial selection of differentially expressed proteins as biomarkers to optimize protein signatures in diagnostics applications. A Bubble plot of CombiROC analysis performed with combination of up to 6 proteins leveraging differential values of 26 significant differential proteins and classification of responder and non-responder according to HFMSE clinical score. Blue circles correspond to combinations with specificity < 70% and sensitivity < 40%, while yellow circles (“Gold”) to specificity > 70% and sensitivity > 40%. B Shared biomarkers among optimal Combiroc combinations with specificity > 70% and sensitivity > 40% and combination of 3 markers as in (A). Dot plots for selected proteins are reported for responders and non-responder at baseline (orange) and after treatment (green). C Bubble plot of CombiROC analysis performed with combination of up to 6 proteins leveraging values of 26 significant differential proteins at T0 and classification of responder and non-responder according to HFMSE clinical score. Blue circles correspond to combinations with specificity < 70% and sensitivity < 40%, while yellow circles to specificity > 70% and sensitivity > 40%. D Shared biomarkers among optimal Combiroc combinations with specificity > 70% and sensitivity > 40% and combination of 3 markers as in (C). Dot plots for selected proteins are reported for responders and non-responder at baseline (orange) and after treatment (green). SEMA6A is shared markers in both analyses, leveraging differential change as well as predictive value at T0
Fig. 6
Fig. 6
Cross-sectional CSF metabolic analysis. A Dot plot distribution of metabolites detected with best confidence, positively and negatively charged. In the grey frame metabolites detected in both modes are highlighted. * = significant change. BG Paired dot plot at baseline and after treatment of metabolic features that significantly change after treatment. H Pearson correlation matrix of metabolite abundance difference between T22 and T0. Most co-modulated features cluster in the frame with dashed lines

References

    1. Kolb SJ, Coffey CS, Yankey JW, et al. Natural history of infantile-onset spinal muscular atrophy. Ann Neurol. 2017;82:883–891. doi: 10.1002/ana.25101. - DOI - PMC - PubMed
    1. Calcagno C, Lobatto ME, Dyvorne H, et al. Three-dimensional dynamic contrast-enhanced MRI for the accurate, extensive quantification of microvascular permeability in atherosclerotic plaques. NMR Biomed. 2015;28:1304–1314. doi: 10.1002/nbm.3369. - DOI - PMC - PubMed
    1. Lefebvre S, Bürglen L, Reboullet S, et al. Identification and characterization of a spinal muscular atrophy-determining gene. Cell. 1995;80:155–165. doi: 10.1016/0092-8674(95)90460-3. - DOI - PubMed
    1. Faravelli I, Nizzardo M, Comi GP, Corti S. Spinal muscular atrophy–recent therapeutic advances for an old challenge. Nat Rev Neurol. 2015;11:351–359. doi: 10.1038/nrneurol.2015.77. - DOI - PubMed
    1. Simone C, Ramirez A, Bucchia M, et al. Is spinal muscular atrophy a disease of the motor neurons only: pathogenesis and therapeutic implications? Cell Mol Life Sci. 2016;73:1003–1020. doi: 10.1007/s00018-015-2106-9. - DOI - PMC - PubMed

Publication types