. 2023 Aug 5;21(1):528.
doi: 10.1186/s12967-023-04384-0.

Spatial tumour gene signature discriminates neoplastic from non-neoplastic compartments in colon cancer: unravelling predictive biomarkers for relapse

Affiliations

Spatial tumour gene signature discriminates neoplastic from non-neoplastic compartments in colon cancer: unravelling predictive biomarkers for relapse

Katja Sallinger et al. J Transl Med. .

Abstract

Background: Opting for or against the administration of adjuvant chemotherapy in therapeutic management of stage II colon cancer remains challenging. Several studies report few survival benefits for patients treated with adjuvant therapy and additionally revealing potential side effects of overtreatment, including unnecessary exposure to chemotherapy-induced toxicities and reduced quality of life. Predictive biomarkers are urgently needed. We, therefore, hypothesise that the spatial tissue composition of relapsed and non-relapsed colon cancer stage II patients reveals relevant biomarkers.

Methods: The spatial tissue composition of stage II colon cancer patients was examined by a novel spatial transcriptomics technology with sub-cellular resolution, namely in situ sequencing. A panel of 176 genes investigating specific cancer-associated processes such as apoptosis, proliferation, angiogenesis, stemness, oxidative stress, hypoxia, invasion and components of the tumour microenvironment was designed to examine differentially expressed genes in tissue of relapsed versus non-relapsed patients. Therefore, FFPE slides of 10 colon cancer stage II patients either classified as relapsed (5 patients) or non-relapsed (5 patients) were in situ sequenced and computationally analysed.

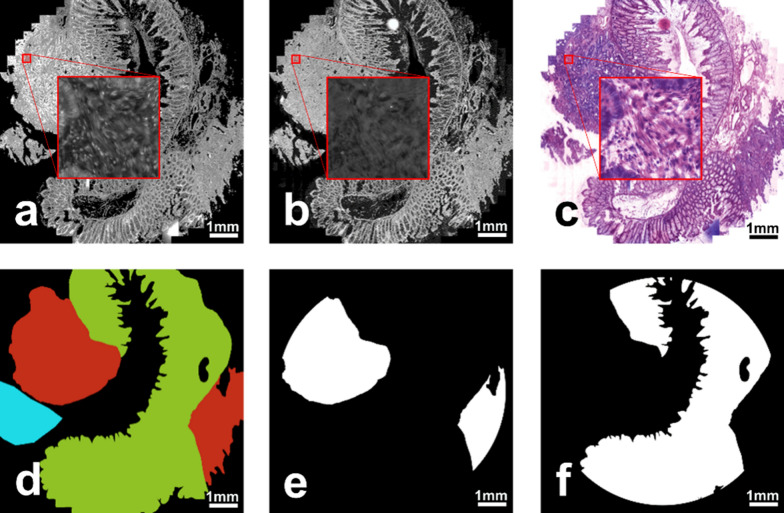
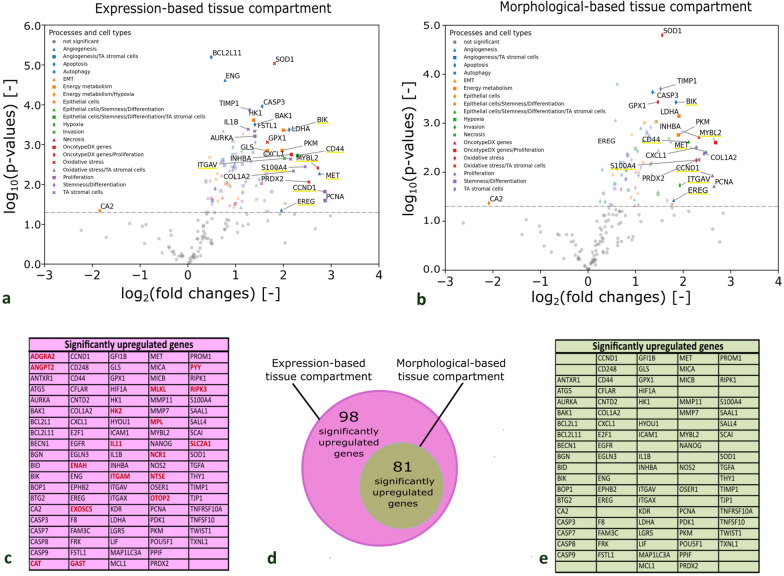
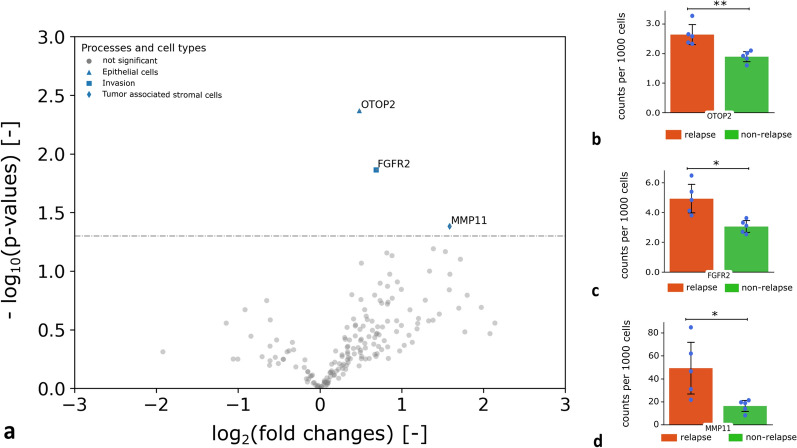
Results: We identified a tumour gene signature that enables the subclassification of tissue into neoplastic and non-neoplastic compartments based on spatial expression patterns obtained through in situ sequencing. We developed a computational tool called Genes-To-Count (GTC), which automates the quantification of in situ signals, accurately mapping their position onto the spatial tissue map and automatically identifies neoplastic and non-neoplastic tissue compartments. The GTC tool was used to quantify gene expression of biological processes upregulated within the neoplastic tissue in comparison to non-neoplastic tissue and within relapsed versus non-relapsed stage II colon patients. Three differentially expressed genes (FGFR2, MMP11 and OTOP2) in the neoplastic tissue compartments of relapsed patients in comparison to non-relapsed patients were identified predicting recurrence in stage II colon cancer.

Conclusions: In depth spatial in situ sequencing showed potential to provide a deeper understanding of the underlying mechanisms involved in the recurrence of disease and revealed novel potential predictive biomarkers for disease relapse in colon cancer stage II patients. Our open-access GTC-tool allowed us to accurately capture the tumour compartment and quantify spatial gene expression in colon cancer tissue.

Keywords: In situ sequencing; Predictive biomarker; Spatial transcriptomics; Tumour compartment; Tumour gene signature; colon cancer.


Conflict of interest statement

No competing interests must be declared.

Figures

Fig. 1
Fig. 1
Generation of the virtually stained H&E image and compartment building. a DAPI-stained image, b FITC-stained image used for calculating of c the virtually stained H&E image of the tissue sample. d The tissue areas in the tissue sections as classified by a pathologist: red–neoplastic tissue, green–non-neoplastic tissue. The blue area marks a region that was excluded from the analysis due to high autofluorescence or lost tissue during hybridisation. The derived representative binary tissue compartment (TC) e for the neoplastic and f for the non-neoplastic tissue
Fig. 2
Fig. 2
Generation of expression-based tissue compartments and overlap with morphological tissue compartments. a The virtually stained H&E images of the samples from non-relapsed (patient 1–5) and relapsed patients (patient 6–10). b Tissue classified into neoplastic and non-neoplastic tissue compartment by a pathology expert based on morphological characteristics. c Gene expression-based neoplastic and non-neoplastic tissue compartment by using the in situ sequencing tumour gene signature (EREG, MET, BIK, CD44, ITGAV, MYBL2, CCND1 and S100A4). d Overlap of the morphological- and the gene expression-based tissue compartment for neoplastic tissue. The mean overlap-value for the tumour gene signature is 0.77. e Ratios of the counted gene per cell value between the gene expression-based and the morphological- based neoplastic tissue compartment depicted as polar chart. Thereby, each data point shows the ratio for a certain in situ sequencing gene. f Projection of morphological obtained tissue compartment on the DAPI images. g Projection of gene expression-based tissue compartment on the DAPI images. Size bar is the same for all images
Fig. 3
Fig. 3
Examples of spatial distributions of 5 out of 176 genes in neoplastic and non-neoplastic tissue. a The virtually stained H&E images of the samples from non-relapsed (patient 1–5) and relapsed patients (patient 6–10). b Expression and the spatial distribution of MET, a gene of the tumour gene signature that was used for the creation of the neoplastic tissue compartment. c Exemplified expression and the spatial distribution of MUC2, a gene expressed in non-neoplastic epithelial- and cancer cells. d Exemplified expression and the spatial distribution FABP1, a high expressed gene in colonic tissue. e Expression of OLFM4, a gene associated to inflamed colonic epithelium and antiapoptotic features. f Expression of COL1A, a gene relevant in forming collagen and found in most connective tissues. Total counts of each transcript are depicted in each image and size bar is the same for all images
Fig. 4
Fig. 4
Significantly upregulated genes in neoplastic vs. non-neoplastic tissues compartments (N = 10). a, b Volcano plot of upregulated genes in the expression-based tissue compartment, and morphological-based tissue compartment. Genes which show a high significance and/or high fold change between the neoplastic and non-neoplastic tissue compartments are labelled by name. Genes belonging to different biological processes are marked with different symbols in different colours to achieve an overview of relevant processes upregulated in neoplastic tissue compartments. Each dot represents an individual gene, a two-sided paired t-test is used for statistical testing with a significance level α = 0.05 (horizontal line). c List of all significantly upregulated genes in the expression-based tissue compartment. Red labelled genes were only found significantly differential expressed in the expression-based tissue compartment. Black labelled genes are concordant between expression- and morphological-based tissue compartments. d Diagram of the amount of genes upregulated in the expression-based and the morphological tissue compartment. e List of all significantly upregulated genes in the morphological tissue compartment. TA stromal cells = tumour associated stromal cells, EMT = epithelial–mesenchymal transition. The 8 identified genes for the tumor gene signature are highlighted in yellow
Fig. 5
Fig. 5
Upregulated genes in neoplastic tissue compartments in relapsed patients in comparison to non-relapsed patients (N = 10). a Volcano plot with a significance level α = 0.05 of significantly upregulated genes in the neoplastic tissues compartment of relapsed patients in comparison to non-relapsed patients. bd The expression level of OTOP2, FGFR and MMP11 in relapsed patients (orange) indicated a significant increase in comparison to non-relapsed patients (green). Significant differences (*p < 0.05 and **p < 0.005) were highlighted with bars and asterisks
Fig. 6
Fig. 6
Spatial distribution and heatmaps of OTOP2, FGFR2 and MMP11. a The virtually stained H&E images of the samples from non-relapsed (patient 1–5) and relapsed patients (patient 6–10). Expression and the spatial distribution of b OTOP2, c FGFR2 and d MMP11 and heatmaps of e OTOP2, f FGFR2 and g MMP11. Total counts of each transcript are depicted in each image and size bar is the same for all images. The heatmaps visualize tumour heterogeneity, whereby each plot is normalised to its own maximum density value. The heat scale colour bar in e, patient 10 is the same for all heatmaps

References

    1. Sung H, Ferlay J, Siegel RL, Laversanne M, Soerjomataram I, Jemal A, et al. Global cancer statistics 2020: GLOBOCAN estimates of incidence and mortality worldwide for 36 cancers in 185 countries. CA Cancer J Clin. 2021;71:209–249. - PubMed
    1. Vuik FE, Nieuwenburg SA, Bardou M, Lansdorp-Vogelaar I, Dinis-Ribeiro M, Bento MJ, et al. Increasing incidence of colorectal cancer in young adults in Europe over the last 25 years. Gut. 2019;68:1820–1826. - PMC - PubMed
    1. Cardoso R, Guo F, Heisser T, De Schutter H, Van Damme N, Nilbert MC, et al. Overall and stage-specific survival of patients with screen-detected colorectal cancer in European countries: a population-based study in 9 countries. Lancet Reg Health Eur. 2022;21:100458. - PMC - PubMed
    1. Xie Y-H, Chen Y-X, Fang J-Y. Comprehensive review of targeted therapy for colorectal cancer. Signal Transduct Target Ther. 2020;5:22. - PMC - PubMed
    1. Rebuzzi SE, Pesola G, Martelli V, Sobrero AF. Adjuvant chemotherapy for stage II colon cancer. Cancers. 2020;12:1–12. - PMC - PubMed

Publication types

Substances

LinkOut - more resources