. 2023 Aug 5;14(1):4703.
doi: 10.1038/s41467-023-40398-4.

Combined PD-L1/TGFβ blockade allows expansion and differentiation of stem cell-like CD8 T cells in immune excluded tumors

Affiliations

Combined PD-L1/TGFβ blockade allows expansion and differentiation of stem cell-like CD8 T cells in immune excluded tumors

Alessandra Castiglioni et al. Nat Commun. .

Abstract

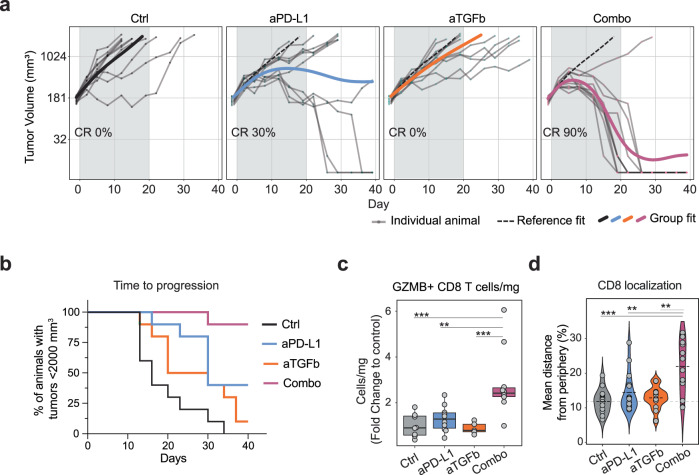
TGFβ signaling is associated with non-response to immune checkpoint blockade in patients with advanced cancers, particularly in the immune-excluded phenotype. While previous work demonstrates that converting tumors from excluded to inflamed phenotypes requires attenuation of PD-L1 and TGFβ signaling, the underlying cellular mechanisms remain unclear. Here, we show that TGFβ and PD-L1 restrain intratumoral stem cell-like CD8 T cell (TSCL) expansion and replacement of progenitor-exhausted and dysfunctional CD8 T cells with non-exhausted T effector cells in the EMT6 tumor model in female mice. Upon combined TGFβ/PD-L1 blockade IFNγhi CD8 T effector cells show enhanced motility and accumulate in the tumor. Ensuing IFNγ signaling transforms myeloid, stromal, and tumor niches to yield an immune-supportive ecosystem. Blocking IFNγ abolishes the anti-PD-L1/anti-TGFβ therapy efficacy. Our data suggest that TGFβ works with PD-L1 to prevent TSCL expansion and replacement of exhausted CD8 T cells, thereby maintaining the T cell compartment in a dysfunctional state.


Conflict of interest statement

All the authors are current or previous employees and shareholders of Roche/Genentech.

Figures

Fig. 1
Fig. 1. TGFβ restrains the anti-tumor response induced by anti-PD-L1 in the TME.
a Tumor volume (y axis) of EMT6 tumors treated with anti-PD-L1 and anti-TGFβ alone or in combination over time (x axis). Grey shade indicates treatment duration. Individual animal curves (grey lines) and group fit curves (thick solid lines) of the control group (black) and treatment groups (colored) are provided. CR complete responder. Representative experiment (n = 10 for all groups). b Percentage of animals bearing EMT6 tumor smaller than 2000 mm3 in the same study as (a) (y axis) over time (x axis). Representative experiment (n = 10 for all groups). c Tumor GZMB+ CD8 T cell quantification via flow cytometry (cells per mg of tissue, fold change over the average of the control group on the y axis; groups on the x axis; data from two independent experiments, n = 10 for all groups). d Quantification of tumor-infiltrating CD8 T cell localization by immunohistochemistry (y axis: % of the distance from tumor periphery; x axis: groups; two independent experiments, n = 15 for all groups; the dotted line represents mean). Source data are provided as a Source Data file. Ctrl = control (anti-GP120), aPD-L1 = anti-PD-L1, aTGFb = anti-TGFβ, combo = combination anti-PD-L1+ anti-TGFβ; adj P values *<0.1, **<0.05, ***<0.01, ****<0.001 Dunn’s test (two-sided) with Benjamini–Hochberg multiple testing correction. Adjusted P values for (c): 0.00136 (ctrl vs combo), 0.0166 (aPD-L1 vs combo), 0.00334 (aTGFb vs combo). Adjusted P values for (d): 0.00262 (ctrl vs combo), 0.0189 (aPD-L1 vs combo), 0.0258 (aTGFb vs combo). c Whiskers represent the minimum and maximum (unless points extend 1.5 * IQR from the hinge, then shown as individual points), the box represents the interquartile range, and the center line represents the median.
Fig. 2
Fig. 2. Single-cell RNA-seq identifies TSCL and TPEX CD8 T cells in EMT6 tumors.
a UMAP of 9,525 CD8 T cells (dots) colored by cluster (n = 5 mice per group). b Heatmap of relative average expression of four marker genes in each cluster from (a). c Scores for TSCM signature and Cd44 expression in cells from clusters in (a). ***Pairwise Wilcoxon rank-sum test (two-sided) P < −7.18e- 95. d Heatmap of relative average expression of selected genes in indicated clusters from (a). e Cytotoxic signature enrichment scores (top; all pairwise two-sided Wilcoxon rank-sum tests P < 0.004) and Ifng expression (bottom) in clusters from (a). f Levels of expression [Log(CPM/100 + 1)] of selected genes in UMAP space. The dotted line highlights cluster 0 cells. g Flow cytometry analysis of CD8 T cells. Left: gating strategy (representative plots of untreated sample, n = 3). Right: TCF1 and SLAMF6 expression in cells populating cluster T0 (PD1hiLAG3+TIM3), T1&7 (PD1lowLAG3), T2&3 (PD1hiLAG3+TIM3+CD39+), and T6 (PD1hiLAG3+TIM3+CD39-) compared to CD8+ T cells from naive lymph node (LN). Numbers indicate mean fluorescence intensity.
Fig. 3
Fig. 3. Combined PD-L1 and TGFβ blockade allows TSCL expansion in the tumor.
a UMAP as in Fig. 2a, here colored by cell density. Red indicates high cell density, blue low density. b Quantification of the frequency of cells in cluster T0 and T1 (y axis; n = 5 per group of treatment from one experiment) in each animal (dots) by treatment group (x axis). c Gating strategy for flow cytometry analysis of CD8 T cells at day 7 after initiation of treatment. Representative plots of control and combo samples. d Flow cytometry quantification of CD8 TSCL (PD1lowLAG3-) and TPEX cells (PD1hiLAG3+TIM3-) (cells per mg of tissue, fold change over average of the control group: y axis; groups: x axis; data from three independent experiments, ctrl n = 19, aPD-L1 n = 20, aTGFb n = 14, combo n = 17). e Heatmap of relative average expression of selected genes in CD8 T cells for each treatment group. f Signature score in cells (dots) from cluster T5 based on genes enriched in cluster T1. P value is from paired Wilcoxon rank-sum tests (two-sided) comparing between treatment conditions. Control not included due to low number of cells in cluster T5. (aPD-L1 n = 420 cells, aTGFb n = 326 cells, Combo n = 284 cells; all conditions include five animals). g Flow cytometry quantification of EdU+ TSCL (cells per mg of tissue, fold change over average of the control group: y axis; groups: x axis; data from two independent experiments, ctrl n = 14, aPD-L1 n = 15, aTGFb n = 14, combo n = 12). h Group fit curves of EMT6 tumor growth treated with FTY720 in addition to control, anti-PD-L1 and combo. Two independent experiments (10 animals in each experiment, mean ± SEM (see Supplementary Fig. 4i for individual animal curves)). Source data are provided as a Source Data file. Ctrl = control (anti-GP120), aPD-L1 = anti-PD-L1, aTGFb = anti-TGFβ, combo = combination anti-PD-L1 + anti-TGFβ; Adj P values *<0.1, **<0.05, ***<0.01, ****<0.001 Dunn’s test (two-sided) with Benjamini–Hochberg multiple testing correction. Adjusted P values for (b): 0.005517513 (ctrl vs combo T0), 0.030889647 (aTgfb vs combo T0), 0.08364055 (ctrl vs combo T1). Adjusted P values for (d): 0.000512 (ctrl vs combo), 0.0679 (aPD-L1 vs combo), 0.00197 (aTGFb vs combo), 0.0841 (ctrl vs aPD-L1). Adjusted P values for (g): 0.00347 (ctrl vs combo), 0.00308 (aTGFb vs combo). b, d, f, g Whiskers represent the minimum and maximum (unless points extend 1.5 * IQR from the hinge, then shown as individual points), the box represents the interquartile range, and the center line represents the median.
Fig. 4
Fig. 4. TSCL are precursors of diverse transcriptional states.
a Cells as in Fig. 2a, here in PCA space and colored by pseudo time. Trajectory is given by smoothed curves. b Quantification of spliced vs unspliced Ifng (left) and Prf1 (right) expression in cells colored by cluster from (a) for clusters T1, T2, and T6. c Flow cytometry analysis of E22-specific CD8 T cells at day 7 after initiation of treatment. Representative plots with flow cytometry control performed using an irrelevant tetramer (LCMV Ctrl). At the bottom right: quantification of the E22-specific CD8 T cells in the four groups of treatments (% of E22+ cells in the CD8 T cells, fold change over average of the control group: y axis; groups: x axis; data from two independent experiments, Ctrl n = 14; aPD-L1 n = 15; aTGFb n = 14; Combo n = 12). d (Left) UMAP of 10,521 CD8 T cells (dots) of unknown specificity from a single-cell RNA/TCR experiment colored by cluster. (Right) UMAP of 25,005 CD8 T cells specific for E22 in the same UMAP space as on the left and colored by cluster membership. e Quantification of the fraction of cells in each cluster that are either single TCR clones or expanded (>1 cell with clonotype) for unknown specificity (left) and E22-specific cells (right). f Clonal diversity as mean Hill diversity index (y axis) per mouse (bar) for unknown specificity and E22-specific cells. Mice are ranked by clonal diversity (x axis). g Distribution of clonal diversity (x axis) per animal for unknown specificity (left; Ctrl n = 3, aPD-L1 n = 3, aTGFb n = 1, Combo n = 3) and E22-specific cells (right; Ctrl n = 4; aPD-L1 n = 4; aTGFb n = 2; Combo n = 3) for each of the four treatment groups. h (Left) Fraction of cells assigned to a particular transcriptional cluster based on CD8 T cells from the 10 most expanded clones in each treatment group. (Right) Fraction of CD8 T cells assigned to each of the 10 most expanded clones in every group (one bar per clone) colored by transcriptional cluster membership. Both figures for T cells with unknown specificity. i Same as in (h) but for E22-specific cells. Source data are provided as a Source Data file. Ctrl = control (anti-GP120), aPD-L1 = anti-PD-L1, aTGFb = anti-TGFβ, combo = combination anti-PD-L1 + anti-TGFβ. c, g Whiskers represent the minimum and maximum (unless points extend 1.5 * IQR from the hinge, then shown as individual points), the box represents the interquartile range, and the center line represents the median.
Fig. 5
Fig. 5. Combination treatment induces an IFNγ response program in the TME.
a Relative average expression in each treatment condition for ligands (left) predicted to bind TSCL-specific receptors (right; Log2FC of TSCL vs all other T cell subsets); for fibroblast, tumor cell as well as myeloid interactions separately. b Venn diagram comparing the 50 top genes of the IFNg MCP program in fibroblasts, myeloid cells, and tumor cells. Numbers indicate the number of shared genes between cell types. Pathway enrichment analysis results are given by bar plots, where color indicates the P value (two-sided Fisher exact test) and bar height represents the number of genes overlapping with the respective pathway. c IFNg MCP program activity by treatment conditions and cell type. P values are from the comparison of each treatment to the control group (n = 5 per group). Adjusted P values: 0.009673458 (fibroblasts), 0.03598864 (myeloid), 0.03598864 (tumor). d Heatmap of relative average expression of indicated genes across conditions. Ctrl = control (anti-GP120), aPD-L1 = anti-PD-L1, combo = combination anti-PD-L1 + anti-TGFβ. Adj P values *<0.05, **<0.01, Dunn’s test (two-sided) with Benjamini–Hochberg multiple testing correction.
Fig. 6
Fig. 6. Combination treatment increases the amount of IFNγ+ CD8 T cells and their mobility in the TME.
a Flow cytometry quantification of IFNγ+ CD8 T cells (ctrl n = 10, aPD-L1 n = 10, aTGFb n = 5, combo n = 10). b Representative images of EMT6-mAPPLE tumors at 14 days after initiation of treatment (n = 8 per group). Blue, tumor cells; Red, IFNγ-YFP+ cells; Yellow, blood vessels; white dashed circles highlight IFNγ-YFP cells. c Density of IFNγ-YFP+ cells at three time points after initiation of treatment (n = 8 Ctrl, n = 7 combo (non-responders excluded); P < 0.0001 two-way ANOVA, mixed-effect analysis; mean and SEM are shown). d Correlation between tumor volume (y axis) and IFNγ-YFP+ cells density (x axis) (n = 8 per group). e IFNγ-YFP+ cell speed at day 7–9 after initiation of treatment (Control: n = 179 cells from 8 mice; Combination: n = 2310 cells from 7 mice (non-responders excluded); P < 0.0001, two-tailed Kolmogorov–Smirnov test). f IFNγ-YFP+ cells track length at day 7–9 after initiation of treatment (Control: n = 179 cells from 8 mice; Combination: n = 2,310 cells from seven mice (non-responders excluded); P value < 0.0001, two-tailed Kolmogorov–Smirnov test). g Tumor volume (y axis) of EMT6 tumors treated with anti-PD-L1, combo or combo plus IFNγ neutralizing antibody (a-IFNg) over time (x axis). Grey shade indicates treatment duration. Individual animal curves (grey lines) and group fit curves (thick solid lines) of the control group (black) and treatment groups (colored) are provided. CR complete responder, PR partial responder. Representative experiment of three (n = 10 for all groups). h Tumor volume (y axis) of EMT6 IFNGR1 KO tumors treated with anti-PD-L1 or combo over time (x axis). Grey shade indicates treatment duration. Individual animal curves (grey lines) and group fit curves (thick solid lines) of the control group (black) and treatment groups (colored) are provided. CR complete responder, PR partial responder (n = 10 for all groups). Source data are provided as a Source Data file. Ctrl = control (anti-GP120), aPD-L1 = anti-PD-L1, aTGFb = anti-TGFβ, combo = combination anti-PD-L1+ anti-TGFβ; Adj P values *<0.1, **<0.05 Dunn’s test (two-sided) with Benjamini–Hochberg multiple testing correction unless differently specified. Adjusted P values for (a): 0.0382 (ctrl vs combo), 0.0851 (aTGFb vs combo). a Whiskers represent the minimum and maximum (unless points extend 1.5 * IQR from the hinge, then shown as individual points), the box represents the interquartile range, and the center line represents the median.
Fig. 7
Fig. 7. TME interferon licensing is associated with improved overall survival in human tumors.
a (Left) Human immune-excluded (n = 134) versus inflamed (n = 74) tumor gene expression fold-changes (x axis) and their significance (y axis) (adj. P value from DESeq2). Human orthologues of IFNg MCP genes are highlighted in purple. (Right) IFNg MCP signature score between immune-excluded and inflamed tumor phenotypes. ***P < 2.2e-16. Wilcoxon rank-sum Test (two-sided). b (Top) Kaplan–Meier survival plot comparing survival probability (y axis) and follow-up time (x axis) for patients with locally advanced or metastatic urothelial carcinoma (IMvigor210; n = 348) receiving atezolizumab treatment. Groups were split by median: high (red, n = 174) or low (blue, n = 174) levels of IFNg MCP expression (left) or CD8A levels (right). (Bottom) Same plots as above, here showing only patients with inflamed tumor phenotype (high n = 37, low n = 37). c Forest plot depicting IFNg MCP signature overall survival hazard ratios (HRs; error bars represent 95% confidence interval) across specified TCGA indications (n = 7927). Solid circles represent P < 0.05 (Cox proportional hazards regression model). OS: Overall Survival. P values: 0.024 (THCA), 0.005 (SARC), 0.002 (BRCA), 0.018 (BLCA), 0.0008 (All), 5.09 e-08 (LGG). BLCA n = 408, BRCA n = 1085, CESC n = 303, COAD n = 444, HNSC n = 515, KIRC n = 515, KIRP n = 285, LGG n = 514, LIHC n = 368, LUAD n = 510, LUSC n = 487, OV n = 302, PRAD n = 494, SARC n = 255, STAD n = 412, THCA n = 501, UCEC n = 529. a Whiskers represent the minimum and maximum (unless points extend 1.5 * IQR from the hinge, then shown as individual points), the box represents the interquartile range, and the center line represents the median. THCA thyroid carcinoma, SARC sarcoma, PRAD prostate adenocarcinoma, BRCA breast invasive carcinoma, CESC cervical squamous cell carcinoma and endocervical adenocarcinoma, UCEC uterine corpus endometrial carcinoma, BLCA bladder urothelial carcinoma, LIHC liver hepatocellular carcinoma, OV Ovarian serous cystadenocarcinoma, COAD colon adenocarcinoma, HNSC head and neck squamous cell carcinoma, LUAD lung adenocarcinoma, STAD stomach adenocarcinoma, LUSC lung squamous cell carcinoma, KIRC kidney renal clear cell carcinoma, KIRP kidney renal papillary cell carcinoma, LGG brain lower-grade glioma.

References

    1. Pons-Tostivint E, et al. Comparative analysis of durable responses on immune checkpoint inhibitors versus other systemic therapies: a pooled analysis of phase III trials. JCO Precis. Oncol. 2019;3:1–10. - PubMed
    1. Hegde PS, Chen DS. Top 10 challenges in cancer immunotherapy. Immunity. 2020;52:17–35. - PubMed
    1. Chen DS, Mellman I. Elements of cancer immunity and the cancer–immune set point. Nature. 2017;541:321–330. - PubMed
    1. Darvin P, Toor SM, Nair VS, Elkord E. Immune checkpoint inhibitors: recent progress and potential biomarkers. Exp. Mol. Med. 2018;50:1–11. - PMC - PubMed
    1. Ayers M, et al. IFN-γ-related mRNA profile predicts clinical response to PD-1 blockade. J. Clin. Investig. 2017;127:2930–2940. - PMC - PubMed