. 2023 Aug 5;14(8):504.
doi: 10.1038/s41419-023-06030-5.

Deficiency of BAP1 inhibits neuroblastoma tumorigenesis through destabilization of MYCN

Affiliations

Deficiency of BAP1 inhibits neuroblastoma tumorigenesis through destabilization of MYCN

Xiaoling Zhang et al. Cell Death Dis. .

Abstract

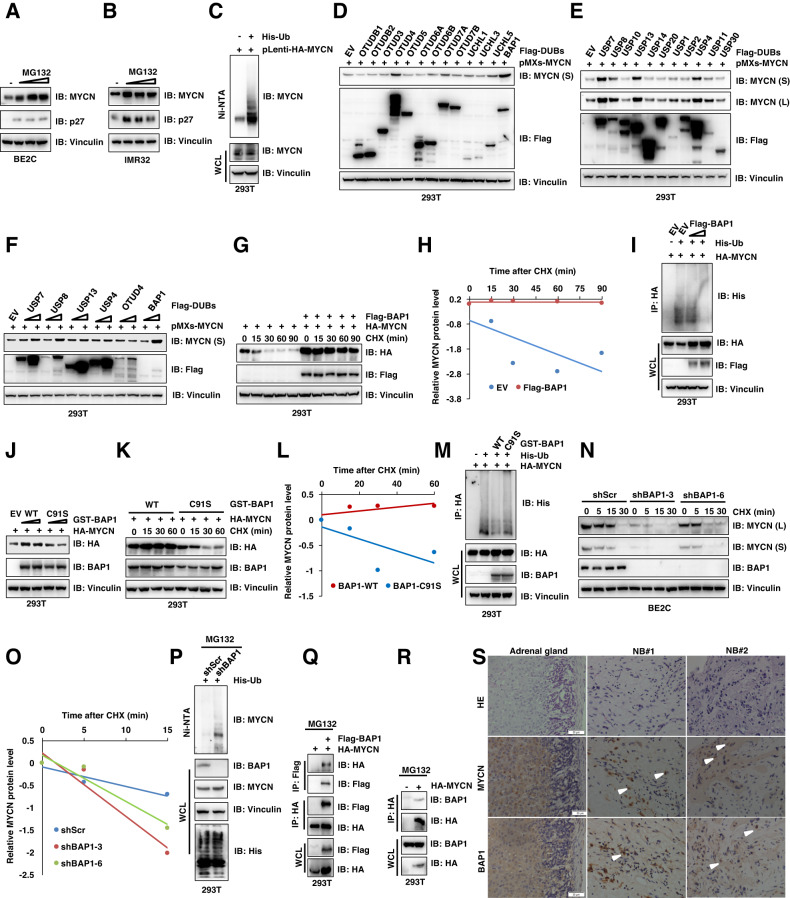
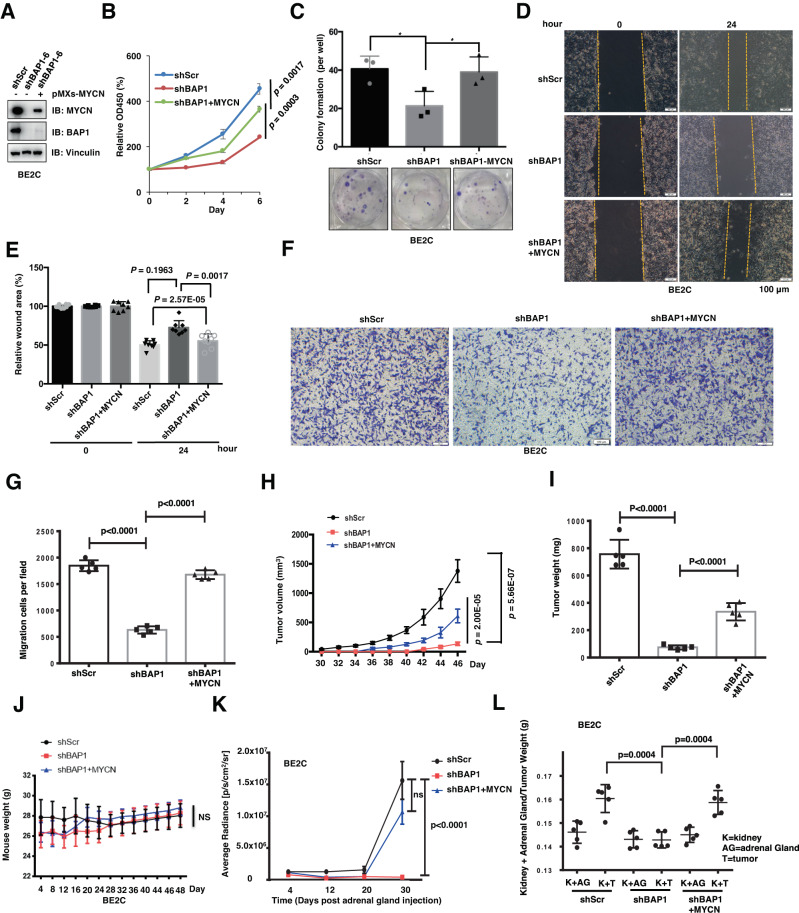
The transcription factor MYCN is frequently amplified and overexpressed in a variety of cancers including high-risk neuroblastoma (NB) and promotes tumor cell proliferation, survival, and migration. Therefore, MYCN is being pursued as an attractive therapeutic target for selective inhibition of its upstream regulators because MYCN is considered a "undruggable" target. Thus, it is important to explore the upstream regulators for the transcription and post-translational modification of MYCN. Here, we report that BRCA1-associated protein-1 (BAP1) promotes deubiquitination and subsequent stabilization of MYCN by directly binding to MYCN protein. Furthermore, BAP1 knockdown inhibits NB tumor cells growth and migration in vitro and in vivo, which can be rescued partially by ectopic expression of MYCN. Importantly, depletion of BAP1 confers cellular resistance to bromodomain and extraterminal (BET) protein inhibitor JQ1 and Aurora A kinase inhibitor Alisertib. Furthermore, IHC results of NB tissue array confirmed the positive correlation between BAP1 and MYCN protein. Altogether, our work not only uncovers an oncogenic function of BAP1 by stabilizing MYCN, but also reveals a critical mechanism for the post-translational regulation of MYCN in NB. Our findings further indicate that BAP1 could be a potential therapeutic target for MYCN-amplified neuroblastoma.


Conflict of interest statement

The authors declare no competing interests.

Figures

Fig. 1
Fig. 1. BAP1 deubiquitinates and controls MYCN protein stability.
A, B Immunoblot (IB) analyses of whole-cell lysate (WCL) from BE2C (A) and IMR32 (B) cells treated with different concentration of MG132 for 10 h. C In vivo ubiquitination analysis of WCL and His pulldown of 293T cells transfected with the indicated plasmids. Forty hours after transfection, cells were treated with 20 μM MG132 for 6 h before harvesting. Ni-NTA, nickel-nitrilotriacetic acid. DF IB analysis of WCL derived from 293T cells transfected with the indicated plasmids. G IB analysis of WCL derived from 293T cells transfected with HA-MYCN and Flag-BAP1 constructs. Cells were treated with 100 μg/ml cycloheximide (CHX) and collected at the indicated time points. H MYCN protein abundance in (G) was quantified by ImageJ and plotted as indicated (H). I Immunoblot analyses of WCL and immunoprecipitates from 293T cells transfected with plasmids expressing the indicated proteins. Twenty-four hours after transfection, cells were treated with MG132 (10 μM) for 10 h before they were harvested. His-Ub histidine-tagged ubiquitin. J IB analysis of WCL derived from 293T cells transfected with HA-MYCN and GST-BAP1-WT/C91S plasmids. K IB analysis of WCL derived from 293T cells transfected with HA-MYCN and GST-BAP1-WT/C91S constructs. Cells were treated with 100 μg/ml cycloheximide (CHX) and collected at the indicated time points. L MYCN protein abundance in (K) was quantified by ImageJ and plotted as indicated (L). M Immunoblot analyses of WCL and immunoprecipitates from 293T cells transfected with plasmids expressing the indicated proteins. Twenty-four hours after transfection, cells were treated with MG132 (10 μM) for 10 h before they were harvested. His-Ub, histidine-tagged ubiquitin. N BAP1-knockdown cells (shBAP1–3 and shBAP1-6) as well as control BE2C cells (shScr) were treated with 100 μg/ml cycloheximide (CHX) for the indicated time period before they were harvested. Equal amounts of WCL were immunoblotted with the indicated antibodies. O MYCN protein abundance in (N) was quantified by ImageJ and plotted as indicated (O). P In vivo ubiquitination analysis of WCL and His pulldown of 293T cells transfected with the His-Ub plasmids. Forty hours after transfection, cells were treated with 20 μM MG132 for 6 h before harvesting. Ni-NTA, nickel-nitrilotriacetic acid. Q, R Immunoblot (IB) analyses of whole-cell lysate (WCL) and immunoprecipitates (IP) derived from 293T cells transfected with indicated constructs. Thirty hours post-transfection, cells were treated with 10 μM MG132 for 10 h before harvesting. S Representative images for immunohistochemical staining of BAP1 and MYCN in human NB tumors and adrenal gland. Scale bars, 50 μm.
Fig. 2
Fig. 2. BAP1 deficiency inhibits NB cell growth in vitro.
A Immunoblot (IB) analyses of whole-cell lysate (WCL) derived from the BE2C cells infected with indicated lentiviral sgRNAs. The infected cells were selected with 2–3 μg/ml puromycin for 72 h to eliminate non-infected cells before they were harvested. B Quantification of the MYCN and BAP1 protein intensities in (A). C IB analysis of WCL derived from BE2C cells infected with the indicated BAP1 shRNAs. Cells were treated with or without indicated concentration of MG132 for overnight before they were harvested. D Representative images for the wound-healing assays of shBAP1 BE2C cells. The wound edges are indicated by yellow lines. Scale bar, 100 μm. E The quantitative results of (D) (n = 8). The y axis represents the relative wound area. Error bars represent s.d. from eight repeats. t test. F Representative images for the wound-healing assays of shBAP1 SH-EP Tet21/N cells (MYCN amplification). The wound edges are indicated by yellow lines. Scale bar, 100 μm. G The quantitative results of (F) (n = 10). The y axis represents the relative wound area. Error bars represent s.d. from ten repeats. t test. H, I Growth curves of BE2C (H) cells and SH-EP Tet21/N cells (I) with shRNA-mediated BAP1 knockdown (shBAP1). **P < 0.01. J Colony-formation assay. Depletion of endogenous BAP1 in BE2C cells displays moderate decrease in colony-formation ability. The number of colonies were counted and quantified. Data are shown as mean ± SD for three independent experiments. P value was indicated in figure, t test. BE2C cells were infected with indicated lentiviral shRNAs. The infected cells were selected with 2 μg/ml puromycin for 72 h to eliminate non-infected cells before they were used for colony-formation assay. K Colony-formation assay. Depletion of endogenous BAP1 in SH-EP Tet21/N cells decreases the colony-formation ability. However, upon depletion of MYCN by the Dox treatment, the colony-formation ability of SH-EP Tet21/N+Dox cells is not changed after depletion of endogenous BAP1. The number of colonies were counted and quantified. Data are shown as mean ± s.d. for three independent experiments. P value was indicated in the figure, t test. SH-EP Tet21/N cells were infected with indicated lentiviral shBAP1. The infected cells were selected with 2 μg/ml puromycin for 72 h to eliminate non-infected cells before they were used for colony-formation assay. L Representative images (n = 5) of migrated SH-EP Tet21/N cells infected with the indicated lentiviral shBAP1. The SH-EP Tet21/N cells were treated with or without Dox before plated for the transwell migration assay. Scale bar, 100 μm. M Quantification of the migrated cells in (L). In all plots, data are shown as mean ± s.d. for five independent experiments.
Fig. 3
Fig. 3. Deficiency of BAP1 inhibits NB cell growth in vitro and in vivo through MYCN.
A Immunoblot (IB) analyses of whole-cell lysate (WCL) from shBAP1 BE2C cells stably expressing MYCN. B Growth curves of BE2C cells with shRNA-mediated BAP1 knockdown (shBAP1) and stably expressing MYCN. C Colony-formation assay. Depletion of endogenous BAP1 in BE2C cells displays moderate decrease in colony-formation ability and overexpression of MYCN will partly recover the colony-formation ability. The number of colonies were counted and quantified. Data are shown as mean ± SD for three independent experiments. P value was indicated in figure, t test. BE2C cells were infected with indicated lentiviral shRNAs and retroviral MYCN. D Representative images for the wound-healing assays of BE2C cells with BAP1 knockdown and MYCN overexpression. The wound edges are indicated by yellow lines. Scale bar, 100 μm. E The quantitative results of (D) (n = 8). The y axis represents the relative wound area. Error bars represent s.d. from eight repeats. t test. F Representative images (n = 5) of migrated BE2C cells infected with the indicated lentiviral shBAP1 and/or stable overexpression of MYCN. Scale bar, 100 μm. G Quantification of the migrated cells in (F). In all plots, data are shown as mean ± s.d. for five independent experiments. H In vivo tumor growth was monitored at the indicated time points. I The weights of the dissected tumors in Supplementary Fig. 3C. J The body weights of the tumor-bearing mice were measured at the indicated time points. K In vivo orthotopic tumor growth was monitored over the indicated time period by detecting and analyzing the bioluminescence signals. L The weight of kidney + adrenal gland and kidney + tumor in Supplementary Fig. 3E (n = 5).
Fig. 4
Fig. 4. BAP1 knockdown conferred cellular resistance to BET inhibitor JQ1 and Aurora kinase inhibitor Alisertib in NB.
A, B Cell viability of BE2C cells with shRNA-mediated BAP1 knockdown (shBAP1) that were treated with indicated concentration of JQ1 (A) and Alisertib (B) for 24 h. shScr BE2C cells were used as control. P values are shown in figure, t test. C, D Representative images for the wound-healing assays of BAP1-knockdown (shBAP1) BE2C cells with or without JQ1 (C) and Alisertib (D) treatment. The wound edges are indicated by yellow lines. Scale bar, 100 μm. E The quantitative results of (C, D) (n = 8). The y axis represents the relative wound area. Error bars represent SD from eight repeats. t test. F, G Colony-formation assay. knockdown of endogenous BAP1 in BE2C cells displays moderate resistance to JQ1 and Alisertib treatment in colony-formation ability. The number of colonies were counted and quantified. The colony number of shScr and shBAP1 without drug treatment groups are set up to “100%”, then the colony number of the drug treatment groups were compared with the relative colony number of shScr and/or shBAP1. Data are shown as mean ± SD for three independent experiments. *P < 0.05, t test. BE2C cells were infected with indicated lentiviral shRNAs. The infected cells were selected with 2 μg/ml puromycin for 72 h to eliminate non-infected cells before they were used for colony-formation assay. H, I Cell viability of BE2C cells with shRNA-mediated BAP1 knockdown (shBAP1) and stably expressing MYCN that were treated with the indicated concentration of JQ1 (H) and Alisertib (I) for 48 h. shScr BE2C cells were used as control. *P < 0.05, **P < 0.01, t test. J, K Growth curves of BE2C cells with shRNA-mediated BAP1 knockdown (shBAP1) and stably expressing MYCN that were treated with or without 0.5 μM JQ1 (J) and 0.2 μM Alisertib (K) for 6 days. shScr BE2C cells were used as control. **P < 0.01, t test.
Fig. 5
Fig. 5. The clinical relevance of BAP1 and MYCN mRNA expression in human neuroblastoma.
A, B Kaplan–Meier survival curves showed a significant association between NB patient survival and BAP1 mRNA expression in the two human NB databases. A GEO: GSE45547 dataset, 649 neuroblastoma tumors were generated using 44 K oligonucleotide microarrays. B GEO: GSE62564 dataset, RNA-seq data, expressed in reads per million (RPM) for each gene, for 498 clinically annotated primary neuroblastoma samples (SEQC neuroblastoma cohort). C, D BAP1 expression between MYCN-amplified (MA) and MYCN non-amplified (MNA) patients. Adjusted P value is from one-way analysis of variance (ANOVA), followed by the Benjamini–Hochberg method. C GSE45547 dataset, n = 649, MA vs. MNA = 93 vs. 550, P = 4.56e-06. D GSE62564 dataset, n = 498, MA vs. MNA = 92 vs. 401, P = 7.89e-05. EH Correlation of BAP1 and MYCN mRNA levels in neuroblastomas. Two datasets were analyzed including the gencode19 cohort for neuroblastomas–Westermann (n = 579) (E, F) and GEO: GSE49710 (n = 498) (G, H). Correlation of BAP1 and MYCN mRNA levels in high-risk NB with MYCN amplification, p = 0.05 (E), p = 3.27e-07 (G), and in NB with MYCN non-amplification, P = 5.78e-12 (F), P = 1.45-15 (H). I Representative images for immunohistochemistry staining of BAP1 and MYCN in human NB tumors array. Scale bars, 10× (upper),100 μm; 20× (lower), 50 μm. J Positive correlation between BAP1 and MYCN protein levels in samples from NB tissue array. The tissue array consists of 22 NB samples which were classified into two groups (high BAP1, 6; low BAP1 14) according to the BAP1 protein level. P < 0.0001, chi-square test.
Fig. 6
Fig. 6. The proposed model of BAP1 promotes MYCN stabilization and mediates the drug sensitivity of NB cells.
A BAP1 promotes MYCN deubiquitination and stabilization as a deubiquitinase of MYCN. The NB cells with wide-type BAP1 are sensitive to JQ1 and Alisertib. B Downregulation of BAP1 by shRNA or siRNA to reduce MYCN level will retard the NB cell proliferation and growth. C Deficiency of BAP1 in NB cells confers resistance to JQ1 and Alisertib in a MYCN-dependent manner.

References

    1. Louis CU, Shohet JM. Neuroblastoma: molecular pathogenesis and therapy. Annu Rev Med. 2015;66:49–63. doi: 10.1146/annurev-med-011514-023121. - DOI - PMC - PubMed
    1. Tavana O, Li D, Dai C, Lopez G, Banerjee D, Kon N, et al. HAUSP deubiquitinates and stabilizes N-Myc in neuroblastoma. Nat Med. 2016;22:1180–6. doi: 10.1038/nm.4180. - DOI - PMC - PubMed
    1. Booker LY, Ishola TA, Bowen KA, Chung DH. Research advances in neuroblastoma immunotherapy. Curr Pediatr Rev. 2009;5:112–7. doi: 10.2174/157339609788185686. - DOI - PMC - PubMed
    1. Matthay KK, George RE, Yu AL. Promising therapeutic targets in neuroblastoma. Clin Cancer Res. 2012;18:2740–53. doi: 10.1158/1078-0432.CCR-11-1939. - DOI - PMC - PubMed
    1. Huang M, Weiss WA. Neuroblastoma and MYCN. Cold Spring Harb Perspect Med. 2013;3:a014415. doi: 10.1101/cshperspect.a014415. - DOI - PMC - PubMed

Publication types

MeSH terms