. 2023 Aug 5;13(1):12732.
doi: 10.1038/s41598-023-39907-8.

IL-1β transgenic mouse model of inflammation driven esophageal and oral squamous cell carcinoma

Affiliations

IL-1β transgenic mouse model of inflammation driven esophageal and oral squamous cell carcinoma

Sureshkumar Muthupalani et al. Sci Rep. .

Abstract

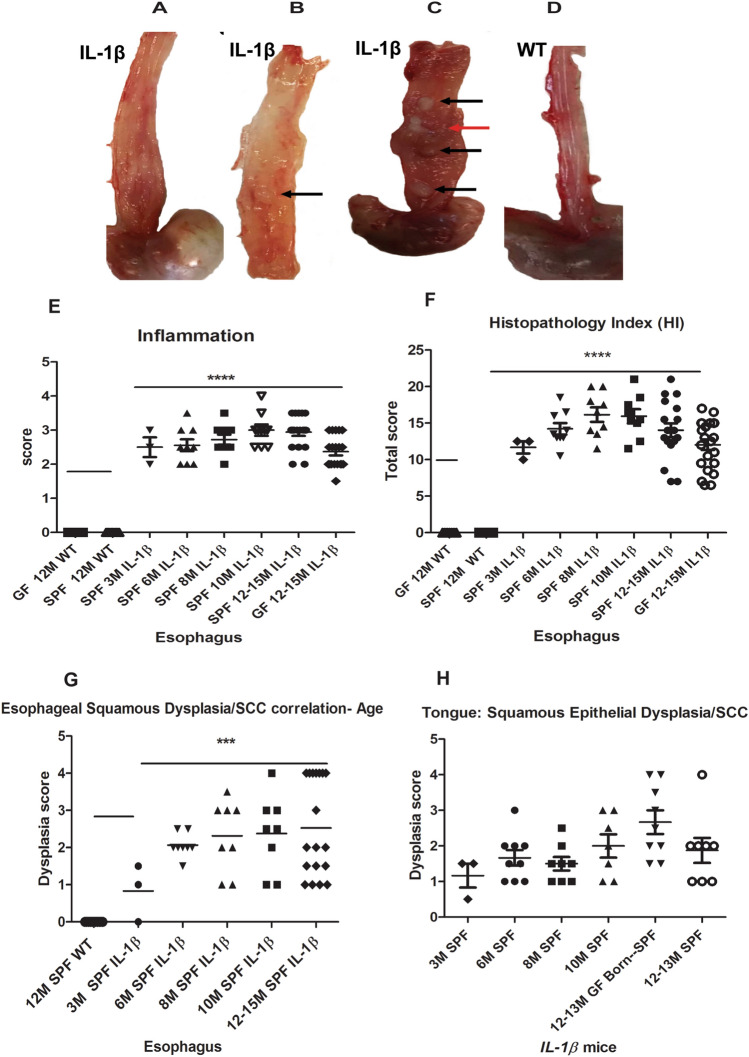
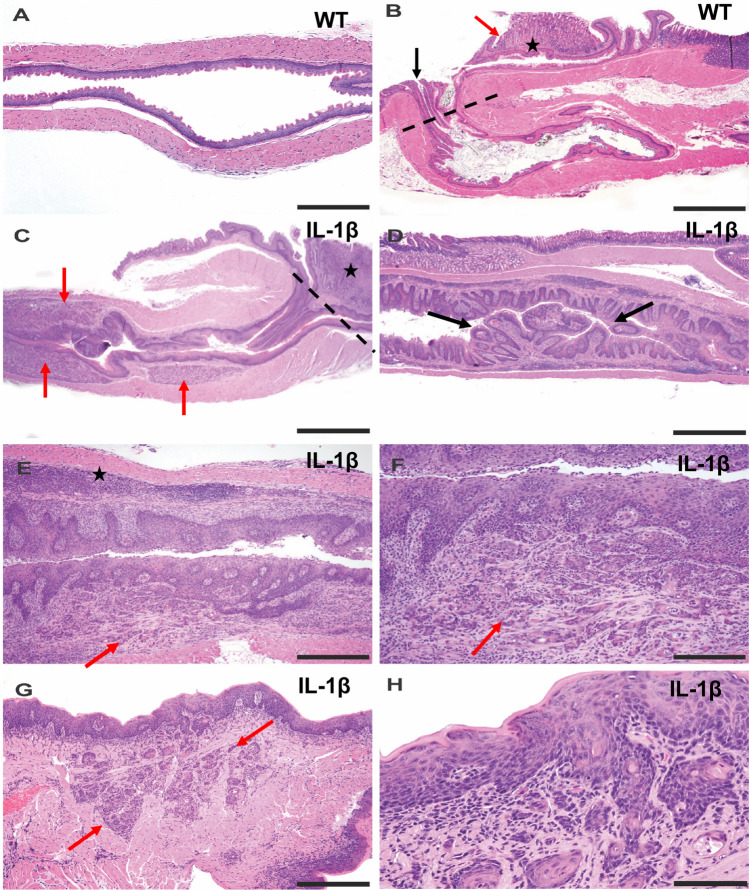
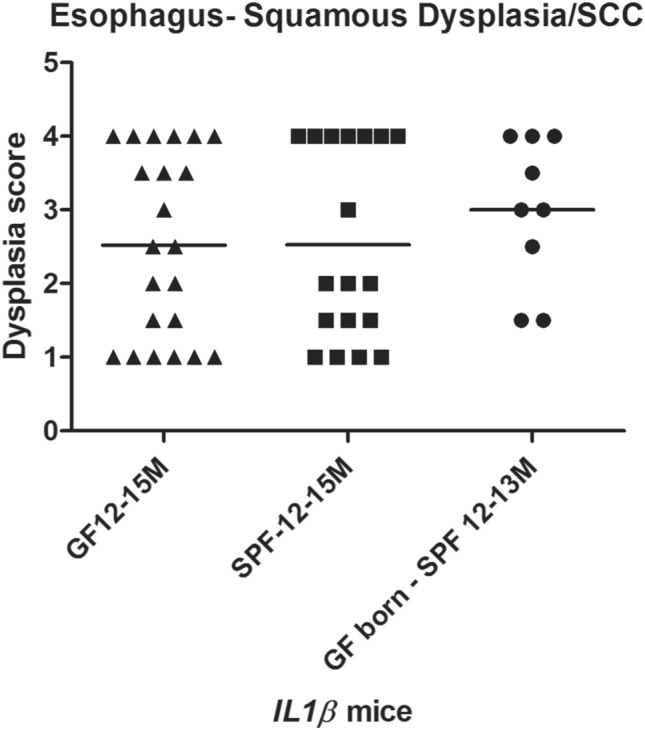
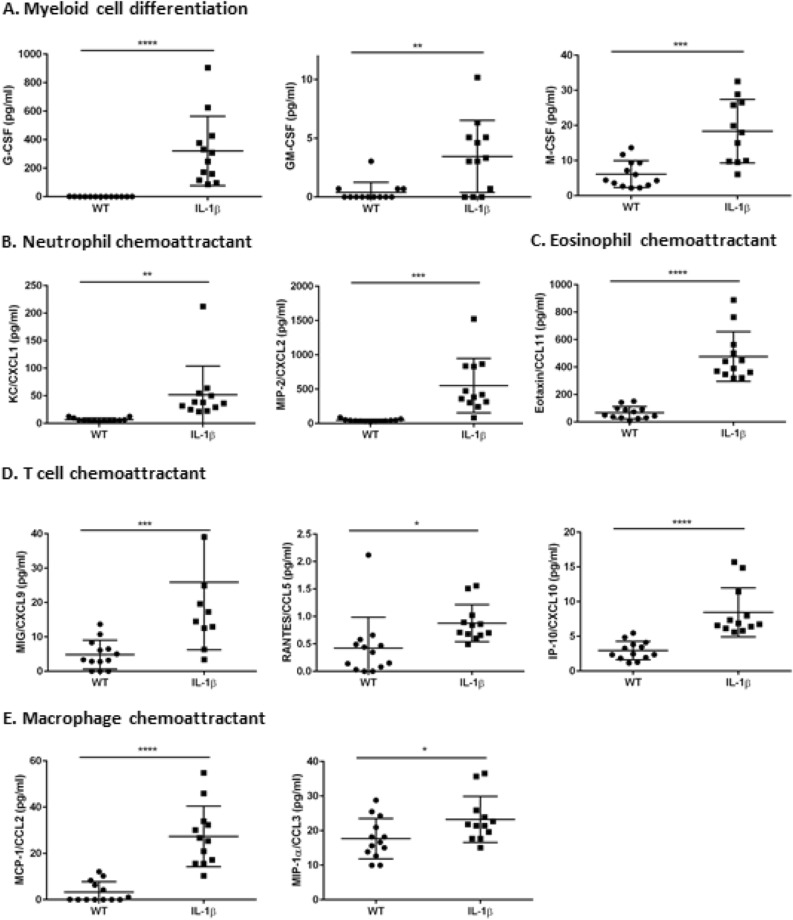
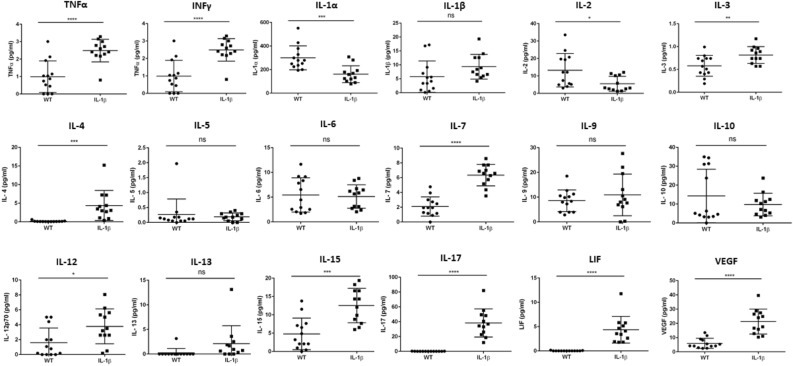
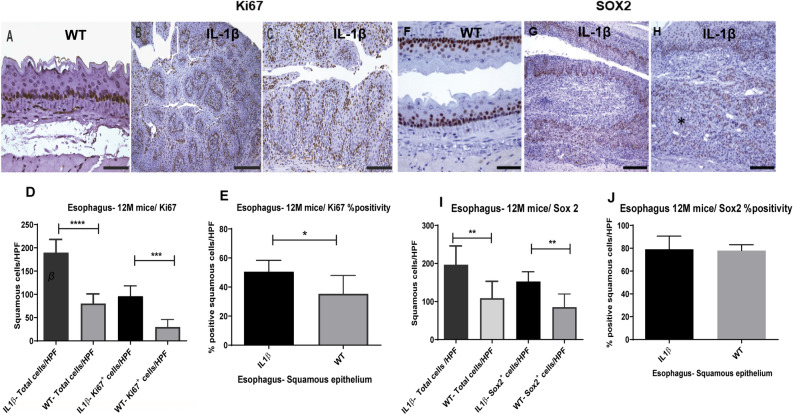
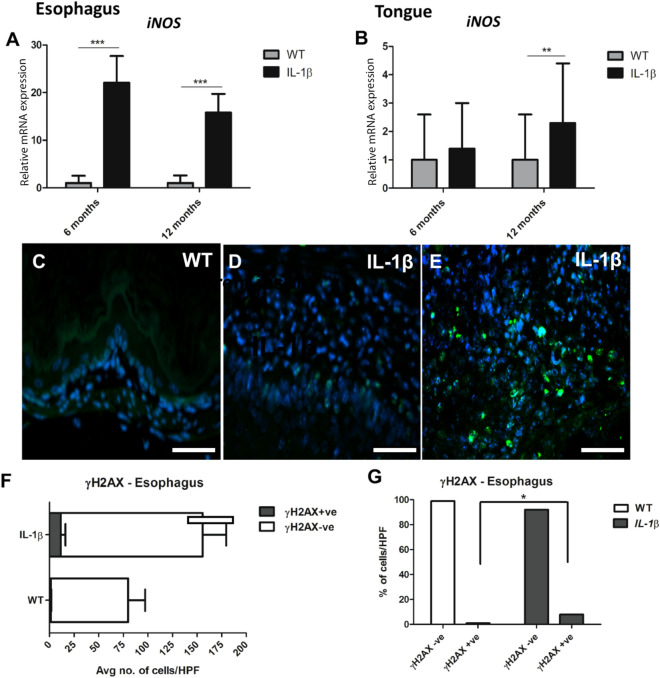
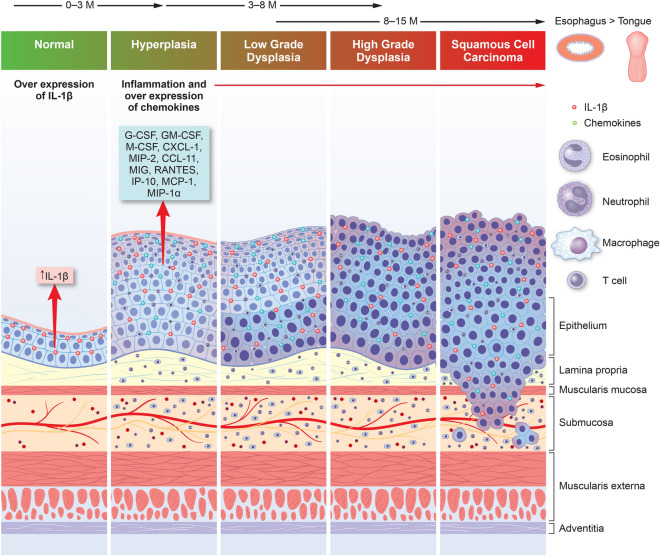
Chronic inflammation is integral to the development of esophageal adenocarcinoma (EAC) and esophageal squamous cell carcinoma (ESCC), although the latter has not been associated with reflux esophagitis. The L2-IL-1β transgenic mice, expressing human interleukin (IL)-1β in the oral, esophageal and forestomach squamous epithelia feature chronic inflammation and a stepwise development of Barrett's esophagus-like metaplasia, dysplasia and adenocarcinoma at the squamo-columnar junction. However, the functional consequences of IL-1β-mediated chronic inflammation in the oral and esophageal squamous epithelia remain elusive. We report for the first time that in addition to the previously described Barrett's esophagus-like metaplasia, the L2-IL-1β mice also develop squamous epithelial dysplasia with progression to squamous cell carcinoma (SCC) in the esophagus and the tongue. L2-IL-1β showed age-dependent progression of squamous dysplasia to SCC with approximately 40% (n = 49) and 23.5% (n = 17) incidence rates for esophageal and tongue invasive SCC respectively, by 12-15 months of age. Interestingly, SCC development and progression in L2-IL-1β was similar in both Germ Free (GF) and Specific Pathogen Free (SPF) conditions. Immunohistochemistry revealed a T cell predominant inflammatory profile with enhanced expression of Ki67, Sox2 and the DNA double-strand break marker, γ-H2AX, in the dysplastic squamous epithelia of L2-IL-1β mice. Pro-inflammatory cytokines, immunomodulatory players, chemoattractants for inflammatory cells (T cells, neutrophils, eosinophils, and macrophages) and oxidative damage marker, iNOS, were significantly increased in the esophageal and tongue tissues of L2-IL-1β mice. Our recent findings have expanded the translational utility of the IL-1β mouse model to aid in further characterization of the key pathways of inflammation driven BE and EAC as well as ESCC and Oral SCC.


Conflict of interest statement

The authors declare no competing interests.

Figures

Figure 1
Figure 1
Gross pathology and age-dependent histopathological score charts in the esophagus and tongue of L2-IL-1β mice. (AD) Representative gross photographs of the esophagus of IL-1β and WT mice. (A) Moderate to mid lower esophageal hypertrophy and dilatation of a 10 month (M) IL-1β mouse. (B) Focal tan-white well demarcated tumor (arrow) in mid esophagus with thickening of lower esophagus of a 12 M IL-1β mouse. (C) Diffuse thickening of esophagus with multiple tan-white well-demarcated tumors—mid to distal esophagus (black arrow) and a coalescing cavitated lesion (red arrow) in a 13 M IL-1β mouse. (D) Normal esophagus in a 12 M wild type control mouse. (E) Scatter dot plot of esophageal inflammation scores in different age groups, 3 M to 12–15 M in IL1β mice under specific pathogen free conditions (SPF). Note: WT littermate controls (SPF and germ free (GF), 12–15 M) and 12–15 M GF IL1β mice are also shown in the plot. (F) Scatter dot plot of cumulative esophageal histopathology index (HI) scores in different groups of IL1β mice. (G) Age-wise progression in esophageal squamous epithelial dysplasia in IL1β mice under SPF conditions (3 M to 12–15 M) compared to WT. (H) Scatter dot plot of IL1β mice showing tongue squamous epithelial dysplasia scores vs age. Dysplasia scores greater than 3 indicates invasive SCC. P values where significant are denoted by *. Individual n numbers per group/timepoint are listed in Supplemental Table S1.
Figure 2
Figure 2
Histopathology of esophageal and tongue squamous cell carcinoma in IL-1β transgenic mice. (A) Representative hematoxylin and eosin (H&E) image of a normal esophagus in a 12 M WT mouse. (B) Low magnification topographical image from a 12 M WT control showing normal tubular esophagus, gastric esophageal junction (GEJ) (dashed line) transitioning into squamous stomach (black arrow) and glandular stomach (star). (C) Low magnification topographical image from 12 M IL-1β mouse showing tubular esophagus with invasive SCC foci (red arrows), GEJ transition (dashed line) and squamous stomach and cardia (star) with inflammation and metaplasia. (DF) Representative H&E tumor images of the esophagus from a 13 M IL-1β mice. (D) Section from tumor and adjacent esophageal mucosa showing inflammation, squamous epithelial hyperplasia and papilloma (arrows). (E) Low magnification histological image of a grossly thickened esophagus characterized by erosion, loss of keratin layer, inflammation (star), squamous epithelial hyperplasia and high grade squamous epithelial dysplasia with focal submucosal invasive lesions consistent with squamous cell carcinoma (red arrow). (F) Higher magnification image of (E) showing submucosal downward haphazard spread of moderate to poorly differentiated neoplastic squamous cells in a fibro-inflammatory stroma (red arrow). (G,H) H&E images of tongue from a 12 M IL-1β mouse. (G) Depicts epithelial hyperplasia and invasive neoplastic squamous epithelial cell nests (arrows) deep within the tongue musculature. (H) Higher magnification image of (G) showing inflammation, hyperplastic and dysplastic squamous epithelium with invasive buds/nests. Scale bars 500 µM (panels BD), 200 µM (panels A,E,G), 100 µM (Panel F), and 50 µM (Panel H).
Figure 3
Figure 3
Squamous Dysplasia/ESCC incidence in IL-1β mice at 12–15 months in GF, SPF or mixed (GF born-SPF) conditions. Scatter plot of esophageal squamous dysplasia scores in different groups of mice. IL-1β mice: GF, n = 22; SPF, n = 18; GF born-SPF, n = 9.
Figure 4
Figure 4
Increased expression of chemoattractants in the esophagus of IL-1β transgenic mice. Quantification of chemoattractants for various inflammatory cells were done in the esophageal tissues of 12 M old WT and IL-1β SPF mice. Chemokines for (A) myeloid cell differentiation (G-CSF, GM-CSF and M-CSF), (B) Neutrophils (Eotaxin and MIP-2), (C) Eosinophils (KC and MIP-2), (D) T cell (MIG, RANTES and IP-10), (E) Macrophages (MCP-1 and MIP-1α) were determined in the esophageal tissue. n = 13, WT- SPF and n = 12, IL-1β- SPF. Unpaired two tailed t test, *p ≤ 0.05, **p ≤ 0.01, ***p ≤ 0.001, ****p ≤ 0.0001.
Figure 5
Figure 5
IL-1β overexpression alters cytokine landscape in the esophagus. Quantification of various cytokines in the esophagus of 12 M old WT and IL-1β SPF mice. TNFα, IL-3, IL-4, IL-7, IL-12, IL-15, IL-17, LIF and VEGF were significantly increased in the esophagus of IL-1β transgenic mice. n = 13, WT-SPF and n = 12, IL-1β-SPF. Unpaired two tailed t test, *p ≤ 0.05, **p ≤ 0.01, ***p ≤ 0.001, ****p ≤ 0.0001.
Figure 6
Figure 6
Esophageal squamous epithelial lesions in IL-1β mice correlate with increased Ki67 + ve cells and aberrant SOX2 immunolocalization. Representative immunohistochemical images of the esophagus of WT (A) and IL-1β mice (B,C) at 12–15 months of age: (A) basal Ki67 positivity of the normal thin esophageal epithelium in a representative WT mouse. (B,C) The low and high magnification images from the esophagus of IL-1β mouse with strong Ki67 positivity in a highly proliferative epithelium. (D,E) Depict bar charts of morphometric analysis of Ki67 positive nuclei in the squamous esophagus. (D) The average numbers of Ki67 positive and negative cells /40X HPF (5–6 fields/animal) of 12–15 month WT and IL-1β mice. (E) Represents % Ki67 nuclear positivity. (FH) Representative SOX2 immunostained images of the esophagus of WT and IL-1β mice at 12–15 months of age. (F) Strong SOX2 positivity is noted in basal and parabasal squamous cells in the esophagus of a normal WT esophagus. (G,H) Low and high magnification image of the esophagus from an IL-1β mouse with invasive SCC showing SOX2 nuclear positivity within the dysplastic epithelium and submucosal SCC (*). (I,J) Depict the bar chart counts of morphometric analysis of SOX2 positive nuclei in the squamous esophagus. I, shows the average numbers of SOX2 positive and negative cells /40X HPF (5–6 fields/animal) of 12–15 month WT and IL-1β mice. (J) Shows % SOX2 nuclear positivity. WT (n = 5: 3 GF and 2 SPF) and IL-1β mice (n = 8: 4GF and 4SPF). Unpaired, two tailed t test. *p ≤ 0.05, **p ≤ 0.01, ***p ≤ 0.001, ****p ≤ 0.0001. Scale bars 50 µM (Panels A and F), 100 µM (Panels C and H), and 200 µM (Panels B and G).
Figure 7
Figure 7
iNos overexpression and increased DNA double stranded breaks (γH2AX immunofluorescent staining) in IL-1β mice. (A,B) Upregulation of iNos in esophagus (A) and tongue (B) of IL-1β mice. Relative mRNA level of iNos were normalized to the expression of housekeeping gene Gapdh. The y-axes represent the mean fold changes (± standard deviation) of the mRNA levels in reference to wild type littermates. n = 10–13 per group (SPF only). (CG) Representative γH2AX immunofluorescent images from the esophagus of WT (C) and IL1β mice (D,E), n = 5 per group- WT (GF and SPF combined) and IL-1β (GF and SPF combined). (C) Basal levels of nuclear γH2AX expression (DNA double stranded breaks marker) in normal squamous epithelium. (D) increased granular nuclear γH2AX positive staining within hyperplastic squamous epithelium. (E) Increased γH2AX nuclear positivity within esophageal squamous tumor. (F,G) Depict bar charts of the average number of γH2AX + cells/HPF and their relative percentages, respectively. WT (n = 5: 3 GF and 2 SPF) and IL-1β mice (n = 8: 4GF and 4SPF). Scale bars 100 µM (Panels CE).
Figure 8
Figure 8
IL-1β mice as a model for Esophageal and Oral SCC progression: The graphical illustration depicts a cascade of events in IL-1β mice driven by IL1β overexpression leading to upregulation of inflammatory cells and cytokines with associated transformation of normal squamous epithelium to hyperplasia, dysplasia and esophageal and oral SCC (Graphical illustration—conceptualization, oversight and editing by S.M, D.A and JGF; created by Wendy Beth Jackelow, Medical and Scientific Illustration).

References

    1. Wenig BM. Squamous cell carcinoma of the upper aerodigestive tract: Dysplasia and select variants. Mod. Pathol. 2017;30(s1):S112–S118. - PubMed
    1. Thrift AP. The epidemic of oesophageal carcinoma: Where are we now? Cancer Epidemiol. 2016;41:88–95. - PubMed
    1. Abnet CC, Arnold M, Wei WQ. Epidemiology of esophageal squamous cell carcinoma. Gastroenterology. 2018;154(2):360–373. - PMC - PubMed
    1. Reichenbach ZW, Murray MG, Saxena R, Farkas D, Karassik EG, Klochkova A, et al. Clinical and translational advances in esophageal squamous cell carcinoma. Adv. Cancer Res. 2019;144:95–135. - PubMed
    1. Rustgi AK. Esophageal cancers and model systems. Trans. Am. Clin. Climatol. Assoc. 2019;130:266–271. - PMC - PubMed

Publication types

MeSH terms

Substances

Supplementary concepts