. 2023 Aug 5;14(1):4716.
doi: 10.1038/s41467-023-40203-2.

Cardiomyocyte proliferation is suppressed by ARID1A-mediated YAP inhibition during cardiac maturation

Affiliations

Cardiomyocyte proliferation is suppressed by ARID1A-mediated YAP inhibition during cardiac maturation

Cornelis J Boogerd et al. Nat Commun. .

Abstract

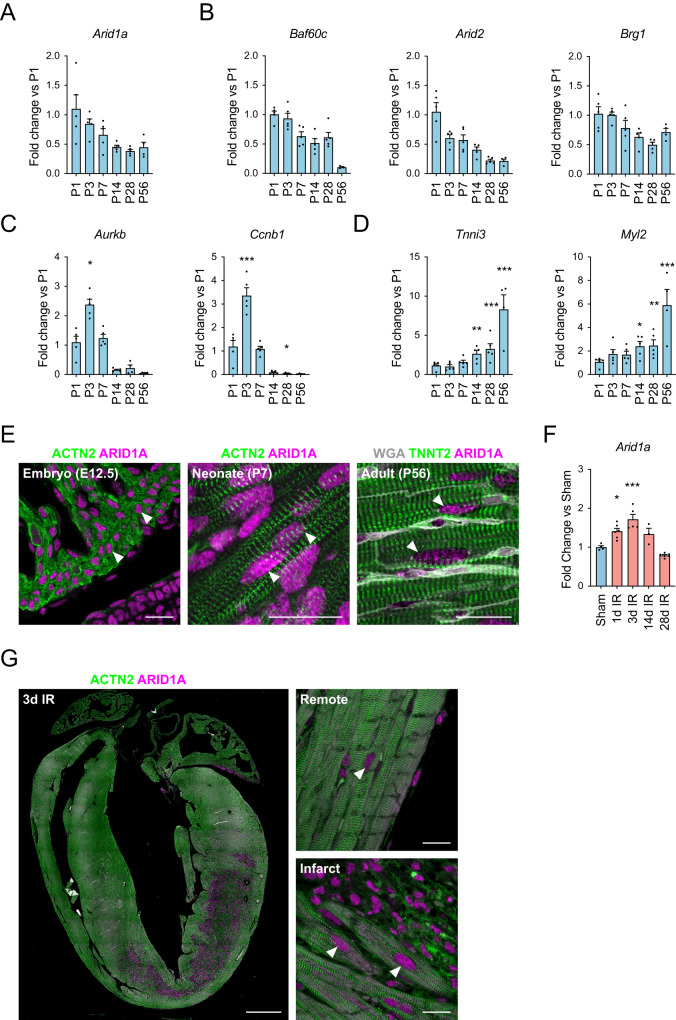
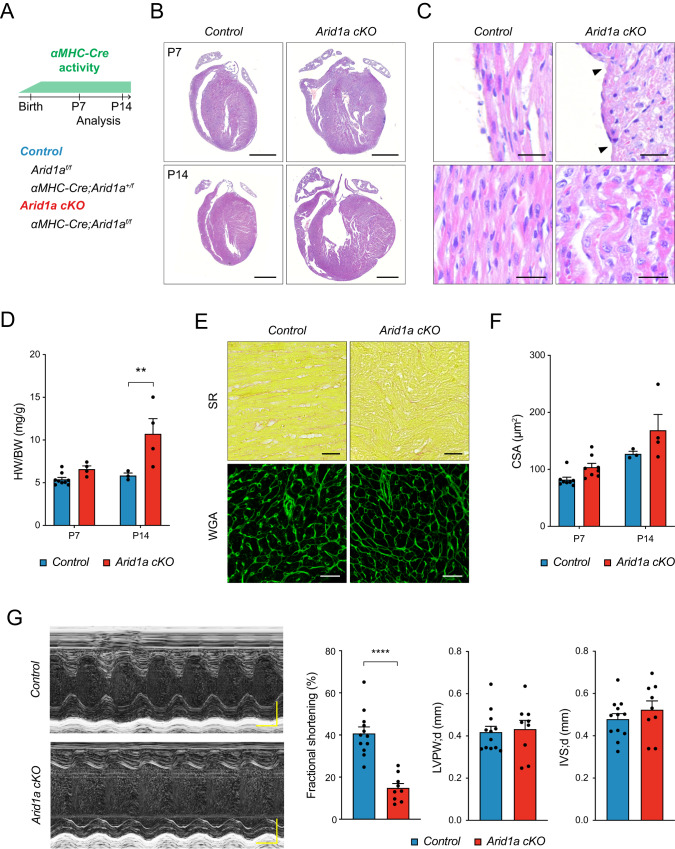
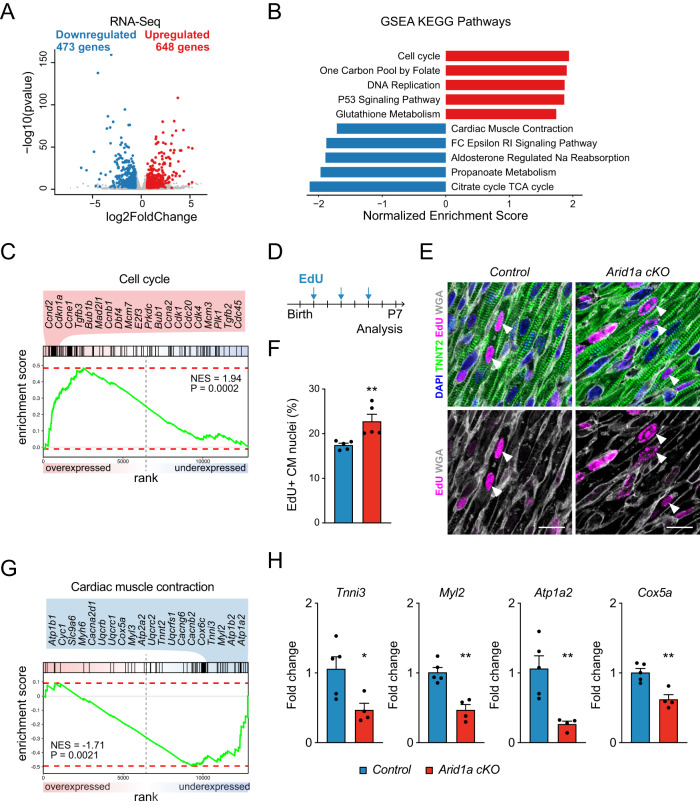
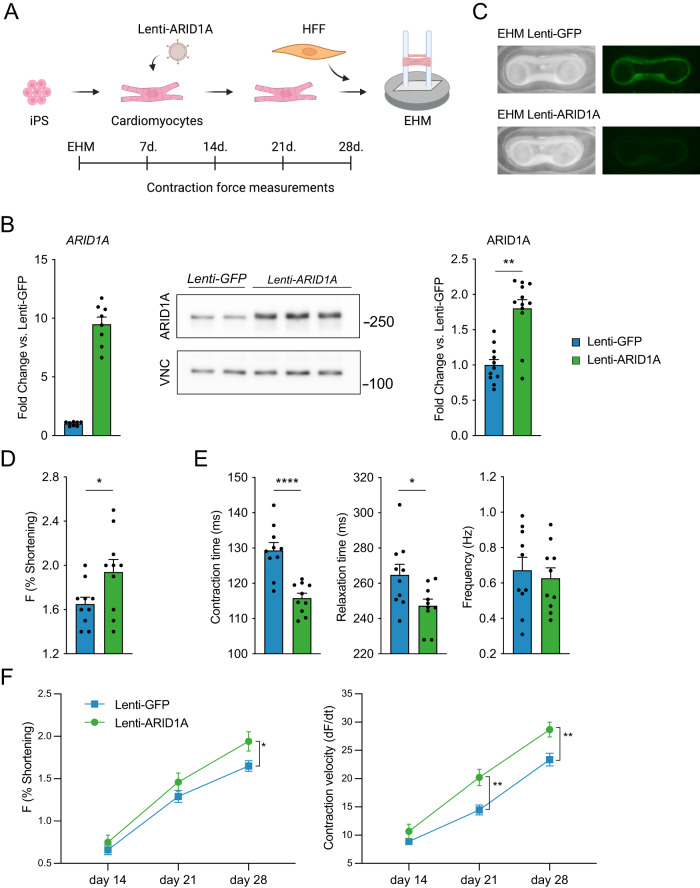
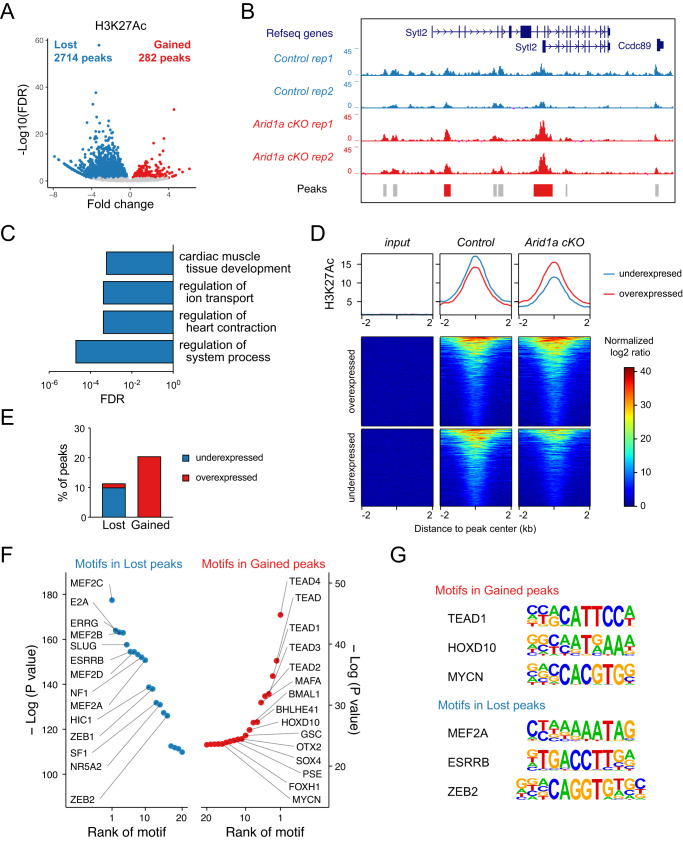
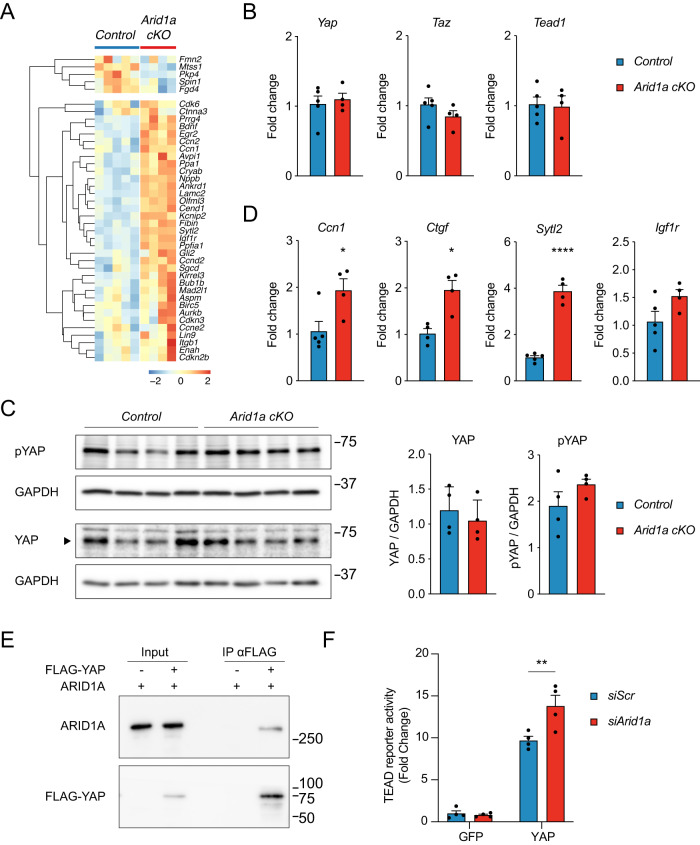
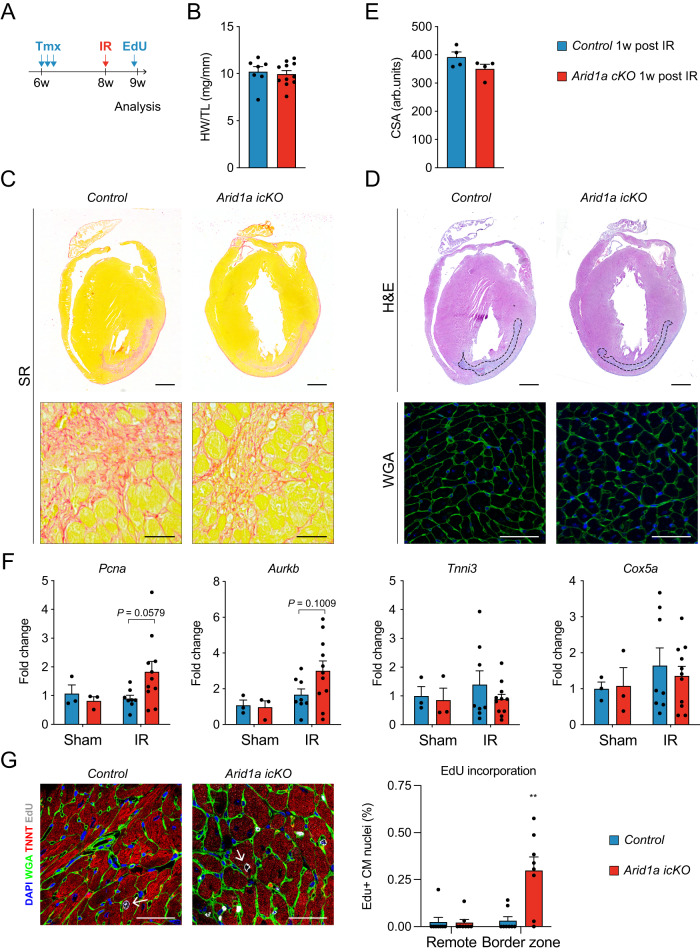
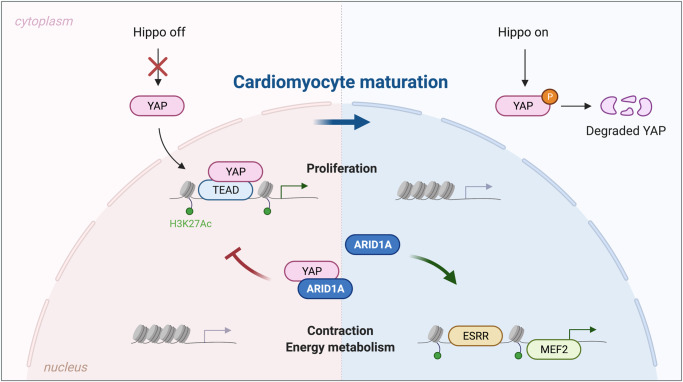
The inability of adult human cardiomyocytes to proliferate is an obstacle to efficient cardiac regeneration after injury. Understanding the mechanisms that drive postnatal cardiomyocytes to switch to a non-regenerative state is therefore of great significance. Here we show that Arid1a, a subunit of the switching defective/sucrose non-fermenting (SWI/SNF) chromatin remodeling complex, suppresses postnatal cardiomyocyte proliferation while enhancing maturation. Genome-wide transcriptome and epigenome analyses revealed that Arid1a is required for the activation of a cardiomyocyte maturation gene program by promoting DNA access to transcription factors that drive cardiomyocyte maturation. Furthermore, we show that ARID1A directly binds and inhibits the proliferation-promoting transcriptional coactivators YAP and TAZ, indicating ARID1A sequesters YAP/TAZ from their DNA-binding partner TEAD. In ischemic heart disease, Arid1a expression is enhanced in cardiomyocytes of the border zone region. Inactivation of Arid1a after ischemic injury enhanced proliferation of border zone cardiomyocytes. Our study illuminates the pivotal role of Arid1a in cardiomyocyte maturation, and uncovers Arid1a as a crucial suppressor of cardiomyocyte proliferation.


Conflict of interest statement

The authors declare no competing interests.

Figures

Fig. 1
Fig. 1. Arid1a expression during postnatal heart maturation.
AC Real-time quantitative PCR (qPCR) determined levels of gene expression during postnatal cardiac development. Levels are shown as fold change over P1 for (A) Arid1a, (P1-P28: n = 5, P56: n = 4) (B) other SWI/SNF complex subunits Baf60c (P1-P28: n = 5, P56: n = 3), Arid2 (P1-P28: n = 5, P56: n = 4) and Brg1 (P1-P28: n = 5, P56: n = 4), (C) proliferation markers Aurkb (P1-P14: n = 5, P28,P56: n = 4; P3 P = 0.0214) and Ccnb1 (P1-P28: n = 5, P56: n = 4; P3 P < 0.0001, P28 P = 0.0498), and (D) cardiomyocyte maturation markers Tnni3 (P1-P28: n = 5, P56: n = 4; P14 P = 0.0043, P28 P < 0.0001; P56 P < 0.0001) and Myl2 (P1-P28: n = 5, P56: n = 4; P14 P = 0.0156, P28 P = 0.0096, P56 P < 0.0001). E Representative example of immunofluorescence staining for ARID1A (red) in embryonic (E12.5; n = 3), postnatal (P7; n = 4) and adult (8-10w; n = 4) mouse cardiomyocytes (ACNT2 or TNNT2, green). Extracellular matrix is highlighted by WGA staining in the adult section. F Arid1a expression (qPCR) in sham (n = 4) and at 1 (n = 6; P = 0.0099), 3 (n = 5; P < 0.0001), 14 (n = 3) and 28 (n = 6) days (d) after ischemia-reperfusion injury (IR). G ARID1A expression in mouse heart 3 days post IR (n = 5). Arrowheads mark ARID1A positive cardiomyocyte nuclei near infarct area. Scale bars 1 mm (G, left panel), 20 µm (E; G right panels). Bar graphs show mean and standard error of the mean; one-way ANOVA with Dunnett’s test for multiple comparisons, compared to P1 (AD) or Sham (F): *P < 0.05; **P < 0.01; ***P < 0.001. Source data are provided as a Source Data file.
Fig. 2
Fig. 2. Arid1a is required in neonatal cardiomyocytes for heart maturation.
A Schematic showing analysis timeline for cardiomyocyte specific Arid1a mutants (Arid1a cKO). B Representative images of hematoxylin and eosin (H&E) staining of P7 and P14 control and Arid1a cKO hearts. C Uneven surface (arrowheads) and signs of myocardial disarray (bottom) in Arid1a cKO hearts (n = 4) compared to controls (n = 5) at P14. D Heart weight to body weight ratio (HW/BW) at P7 (Control, n = 9; Arid1a cKO, n = 4) and P14 (Control, n = 3; Arid1a cKO, n = 4; P = 0.0029; **P < 0.01, two-way ANOVA with Šídák’s multiple comparisons test). E Sirius red (SR) staining for fibrosis and wheat germ agglutinin (WGA) staining for extracellular matrix. F Quantification of cardiomyocyte cross-sectional area (CSA) as measured from WGA-stained hearts at P7 (n = 8) and P14 (Control, n = 3; Arid1a cKO, n = 4) revealed no significant difference between Arid1a cKO and control at P7 (P = 0.2049) or P14 (P = 0.1021; two-way ANOVA with Šídák’s multiple comparisons test). G Representative example of echocardiography analysis of cardiac function in P7 hearts, with quantification of fractional shortening (P < 0.0001), interventricular septum thickness (IVS; P = 0.7787) and left ventricular peripheral wall thickness (LVPW; P = 0.3624) during diastole (d) (Control, n = 12; Arid1a cKO, n = 9; ****P < 0.0001, two-tailed Student’s t-test). Scale bars 1 mm (B), 25 µm (C), 50 µm (E), 0,1 s (G, horizontal), 0,1 mm (G, vertical). All bar graphs show mean with standard error of the mean. Source data are provided as a Source Data file.
Fig. 3
Fig. 3. Increased proliferation and decreased maturation in Arid1a cKO cardiomyocytes.
A Volcano plot of RNA-Seq on P7 hearts with 473 genes downregulated (blue) and 648 genes upregulated (red) in Arid1a cKO (n = 4) compared to control (n = 5) hearts (Differentially expressed genes are defined as those genes with an absolute fold change >1.5x and Wald-test with Benjamini-Hochberg-adjusted P < 0.05). B Gene set enrichment analysis (GSEA) for Kyoto encyclopedia of genes and genomes (KEGG) identified pathways activated (red) or suppressed (blue) in Arid1a cKO compared to control hearts. C GSEA enrichment plot with most significantly induced cell cycle genes in Arid1a cKO hearts. D Schematic showing EdU incorporation assay timeline. EdU was administered to neonates at P1, P3 and P5. Hearts were analyzed at P7. E Representative example of EdU staining (magenta) in P7 Arid1a cKO and control hearts, co-stained with TNNT2 (green) and WGA (gray) to identify cardiomyocytes. Scale bars 20 µm. F Quantification of EdU incorporation in P7 control and Arid1a cKO hearts (n = 5; P = 0.0079). **P < 0.01, two-tailed Mann–Whitney test. G GSEA enrichment plot with most significantly suppressed cardiac muscle contraction genes in Arid1a cKO hearts. H Levels of mRNA transcripts encoding sarcomeric proteins (Myl2, P = 0.0012; Tnni3, P = 0.0269, ion channels (Atp1a2, P = 0.0066) and energy metabolism (Cox5a, P = 0.0032) in Arid1a cKO (n = 4) and control hearts (n = 5) as determined by qPCR). *P < 0.05; **P < 0.01, two-tailed Student’s t-test. All bar graphs show mean with standard error of the mean. Source data are provided as a Source Data file.
Fig. 4
Fig. 4. ARID1A overexpression in cardiomyocytes enhances maturation of engineered human myocardium.
A Schematic overview of cardiomyocyte differentiation and transduction with Lenti-ARID1A (or Lenti-GFP as control) and casting with human foreskin fibroblasts (HFF) to generate engineered human myocardium (EHM). Contraction force and kinetics measurements were performed weekly for 4 weeks. B Quantification of ARID1A RNA by qPCR (left, n = 2 independent differentiations, with 4 technical replicates each), western blot (middle) and quantification of ARID1A protein level (right; P = 0.0022, two-tailed Student’s t-test on average of 4 independent differentiations; graph shows 4 independent differentiations, with 2 or 3 replicates each); (**P < 0,01, two-tailed Student’s t-test) in iPS-CM transduced with Lenti-ARID1A or Lenti-GFP. Molecular weight marker (kDa) is shown at the right. C Representative images of EHM tissue (left) and GFP fluorescence (right) at the end of the experiment showing sustained expression of the Lentiviral cargo. DF EHM contraction measurements, n = 10 engineered human myocardium rings from a single experiment; *P < 0.05, **P < 0.01, ****P < 0.0001, two-tailed Student’s t-test, performed separately for each timepoint. D Force of contraction (F; P = 0.0380) measurements of Lenti-GFP or Lenti-ARID1A EHM at 4 weeks after casting. E Contraction time(P < 0.0001), relaxation time (P = 0.0225), and contraction frequency (P = 0.6375) at 4 weeks (n = 10; *P < 0.05, two-tailed Student’s t-test). F Force of contraction (left) and contraction velocity (dF/dt) measurements over time. Graphs show mean with standard error of the mean. Source data are provided as a Source Data file. A Created with BioRender.com.
Fig. 5
Fig. 5. Loss of Arid1a changes the chromatin landscape in cardiac maturation.
A Volcano plot of H3K27Ac ChIP-Seq on P7 hearts identifies 282 peaks with gained H3K27Ac signal (Gained peaks, red) and 2714 peaks with reduced H3K27Ac levels (Lost peaks, blue) in Arid1a cKO compared to control hearts (Wald test with Benjamini-Hochberg adjusted P-values (false discovery rate (FDR)) < 0.05). B Representative example of H3K27Ac signal within the Sytl2 genomic locus in two replicates (rep) of P7 control (blue) and Arid1a cKO (red) hearts. Peaks are shown below (not changed: gray; peaks with increased H3K27Ac in Arid1a cKO hearts: red). C Gene ontology analysis for biological processes associated with lost peaks. Cardiac muscle development and contraction, and ion handling are enriched. D Average H3K27Ac peak signals (top) and heatmaps for genes overexpressed (middle) or underexpressed (bottom) in Arid1a cKO hearts compared to controls. H3K27Ac in overexpressed genes is increased in Arid1a cKO hearts, whereas H3K27Ac in underexpressed genes is decreased compared to controls. E Intersection of RNA-Seq and H3K27Ac ChIP-Seq indicates that lost peaks are associated with downregulated genes, whereas gained peaks are linked to overexpressed genes. F Motif enrichment analysis shows transcription factor motifs enriched in lost peaks (left, blue) and gained peaks (right, red), ranked by increasing P-value (Hypergeometric Optimization of Motif EnRichment (HOMER) determined P-values of motif enrichment). G Distinct DNA binding motifs of enriched factors in gained peaks and lost peaks. Source data are provided as a Source Data file.
Fig. 6
Fig. 6. ARID1A directly binds YAP/TAZ and suppresses its activity.
A Heatmap showing relative expression (z-score) of known YAP-TEAD cardiac target genes in P7 Arid1a cKO and control hearts. B Relative expression (Fold change vs Control) of YAP (P = 0.6700), Taz (P = 0.2239), and Tead1 (P = 0.8537) in P7 Arid1a cKO (n = 4) and control hearts (n = 5) as determined by qPCR (two-tailed Student’s t-test). C Western blot analysis of total YAP and phosphorylated YAP (pYAP) in P7 control and Arid1a cKO hearts. Quantification indicates no difference in YAP (P = 0.6700) or pYAP (P = 0.2038) expression between control and Arid1a cKO hearts (n = 4; two-tailed Student’s t-test). Molecular weight marker (kDa) is shown at the right. D Relative expression of known YAP target genes Ccn1 (P = 0.0295), Ctgf (P = 0.0111), Sytl2 (P < 0.0001), and Igf1r (P = 0.0876) in Arid1a cKO (n = 4) and control hearts (n = 4–5) as determined by qPCR (*P < 0.05; ***P < 0.001, ****P < 0.0001, two-tailed Student’s t-test). E Representative example of 3 independent immunoprecipitations (IP) of FLAG-YAP and ARID1A in H10 cells, showing specific co-precipitation of ARID1A with YAP. Molecular weight marker (kDa) is shown at the right. F Luciferase assay with 8xGTIIC-luciferase YAP-TEAD reporter construct in H10 cells (Fold change versus siScr in GFP condition). Co-transfection of siRNA against Arid1a significantly induces reporter expression in the presence of YAP (P = 0.0028). pCDNA-GFP was used as a control vector. (**, P < 0.01. two-way ANOVA with Sidak’s multiple comparison test; n = 4 independent experiments). Bar graphs show mean with standard error of the mean. Source data are provided as a Source Data file.
Fig. 7
Fig. 7. Loss of ARID1A induces cardiomyocyte proliferation after ischemic injury.
A Schematic showing ischemia-reperfusion (IR) injury timeline. Two weeks after tamoxifen (TMX) administration, IR injury was induced. EdU was injected IP 6 days after IR, and hearts were harvested for analysis 24 h later. B Arid1a icKO hearts (n = 11) have similar heart weight to tibia length (HW/TL) to controls (n = 7) 1 week (w) after IR (P = 0.7149; two-tailed Student’s t-test). C Representative examples of Sirius red (SR) staining for fibrosis (red, n = 4). D Hematoxylin and eosin (H&E) staining for gross tissue morphology and wheat germ agglutinin (WGA) staining for assessment of cardiomyocyte cross sections area (CSA), as quantified in (E) reveals no differences between Arid1a icKO and control hearts 1w after IR (n = 4; P = 0.4857; two-tailed Student’s t-test). F qPCR of key cell cycle, contraction and metabolism genes in Arid1a icKO and control hearts subjected to Sham (n = 3) or IR surgery (Control, n = 8; Arid1a icKO, n = 11). Expression in infarct regions for cell cycle regulators Pcna (P = 0.0579) and Aurkb (P = 0.1009) trends towards being increased in in Arid1a icKO compared to controls, Tnni3 (P = 0.4331) and Cox5a (0.8074) do not (two-way ANOVA with Šídák’s multiple comparisons test). G Representative example of EdU incorporation in control and Arid1a icKO IR hearts and quantification of EdU incorporation. EdU incorporation is enhanced specifically in Arid1a icKO border zone cardiomyocytes (P = 0.0044; n = 8; **P < 0.01; Conway-Maxwell Poisson regression analysis). Scalebars 1 mm (top panels in C, D), 50 µm (bottom panels in C, D; G). Bar graphs show mean with standard error of the mean. Source data are provided as a Source Data file.
Fig. 8
Fig. 8. ARID1A regulates cardiomyocyte proliferation through interaction with YAP.
In neonatal cardiomyocytes (left), the Hippo pathway is inactive, and YAP translocates to the nucleus where it teams up with TEAD factors to drive a pro-proliferative gene program. Proliferation genes are marked by open chromatin and H3K27Ac histone marks. As cardiomyocytes switch towards maturation, ARID1A binds YAP, inhibiting its transcriptional activity. Proliferation gene program is stably silenced by decreased H3K27Ac levels and transcriptionally inactive heterochromatin. During cardiomyocyte maturation, ARID1A is required for inducing activation of cardiac contractility and metabolism genes, driven by MEF2 and ESRR transcription factors. Created with BioRender.com.

References

    1. Porrello ER, et al. Transient regenerative potential of the neonatal mouse heart. Science. 2011;331:1078–1080. doi: 10.1126/science.1200708. - DOI - PMC - PubMed
    1. Guo Y, Pu WT. Cardiomyocyte maturation: new phase in development. Circ. Res. 2020;126:1086–1106. doi: 10.1161/CIRCRESAHA.119.315862. - DOI - PMC - PubMed
    1. Senyo SE, et al. Mammalian heart renewal by pre-existing cardiomyocytes. Nature. 2013;493:433–436. doi: 10.1038/nature11682. - DOI - PMC - PubMed
    1. Lopaschuk GD, Jaswal JS. Energy metabolic phenotype of the cardiomyocyte during development, differentiation, and postnatal maturation. J. Cardiovasc. Pharmacol. 2010;56:130–140. doi: 10.1097/FJC.0b013e3181e74a14. - DOI - PubMed
    1. Li F, Wang X, Capasso JM, Gerdes AM. Rapid transition of cardiac myocytes from hyperplasia to hypertrophy during postnatal development. J. Mol. Cell Cardiol. 1996;28:1737–1746. doi: 10.1006/jmcc.1996.0163. - DOI - PubMed

Publication types