. 2023 Nov;149(15):13995-14014.
doi: 10.1007/s00432-023-05211-1. Epub 2023 Aug 6.

Identification of disulfidptosis-related subtypes, characterization of tumor microenvironment infiltration, and development of a prognosis model in colorectal cancer

Affiliations

Identification of disulfidptosis-related subtypes, characterization of tumor microenvironment infiltration, and development of a prognosis model in colorectal cancer

Ying Li et al. J Cancer Res Clin Oncol. 2023 Nov.

Abstract

Background: Colorectal cancer is the second leading cause of cancer-related deaths, which imposes a significant societal burden. Regular screening and emerging molecular tumor markers have important implications for detecting the progression and development of colorectal cancer. Disulfidptosis is a newly defined type of programmed cell death triggered by abnormal accumulation of disulfide compounds in cells that stimulate disulfide stress. Currently, there is no relevant discussion on this mechanism and colorectal cancer.

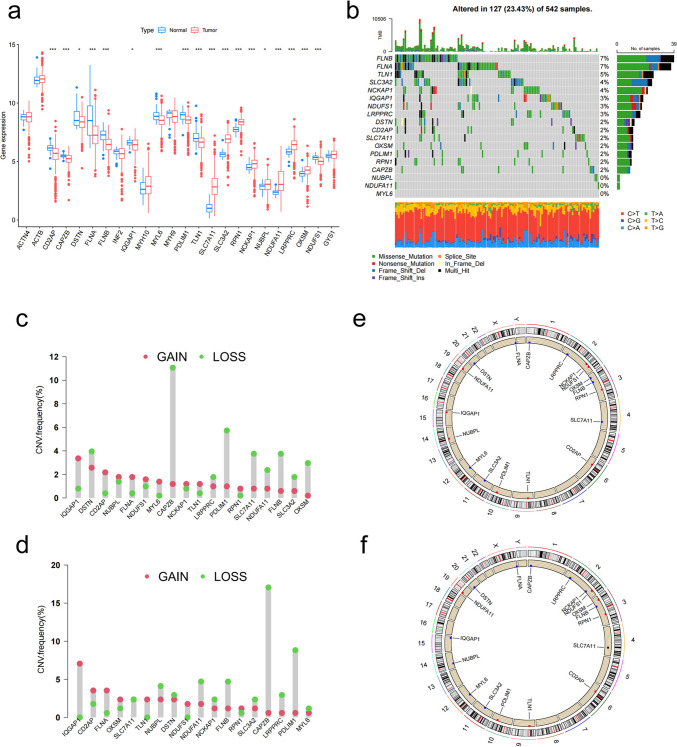
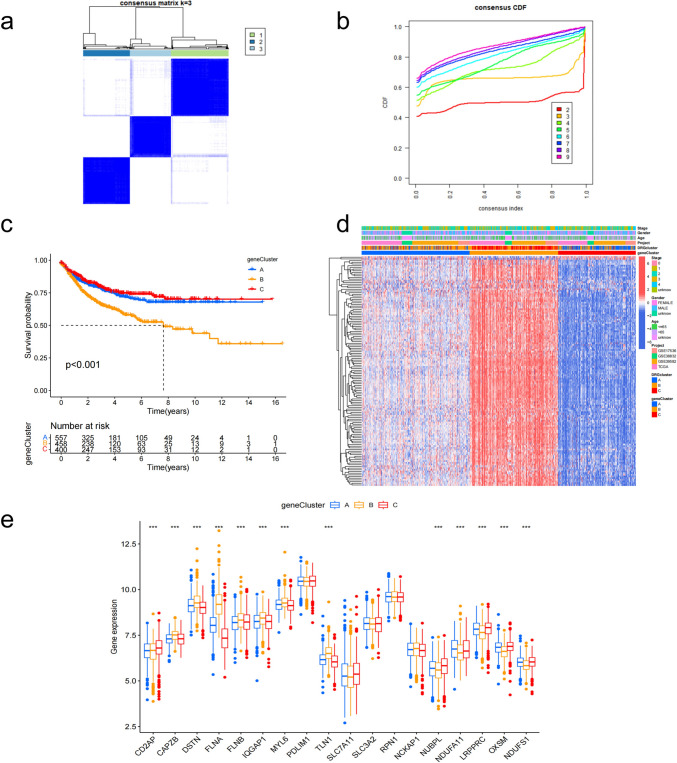
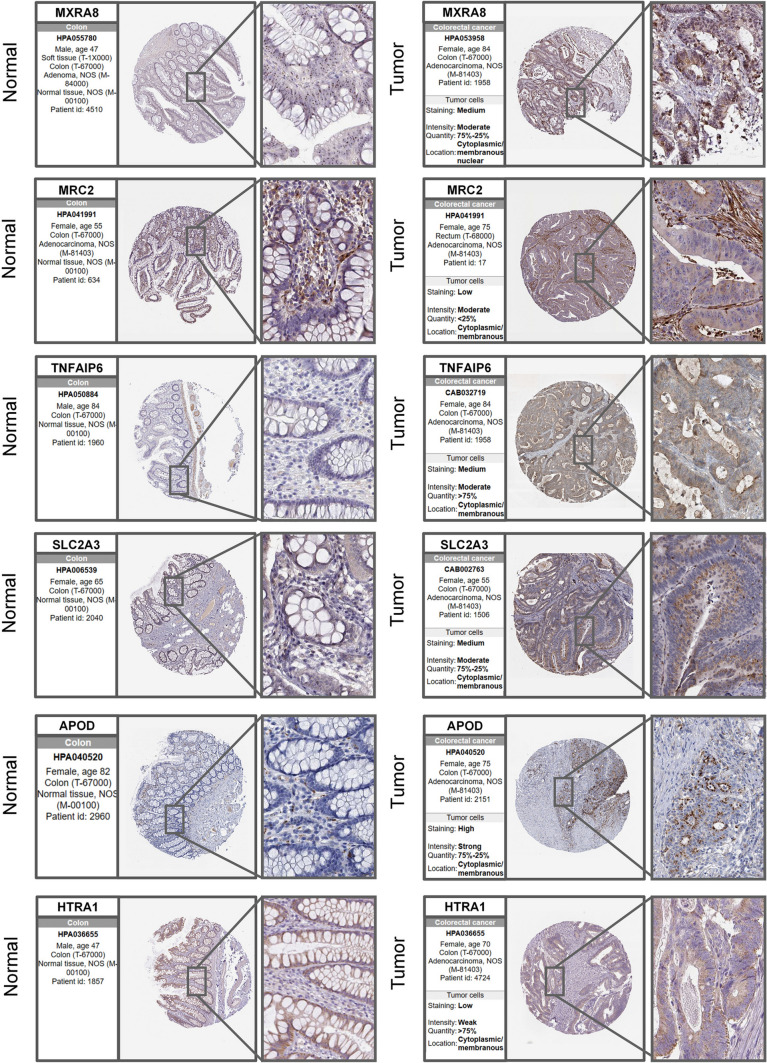
Methods: We classified the disulfidptosis-related subtypes of colorectal cancer using bioinformatics methods. Through secondary clustering of differentially expressed genes between subtypes, we identified characteristic genes of the disulfidptosis subtype, constructed a prognostic model, and searched for potential biomarkers through clinical validation.

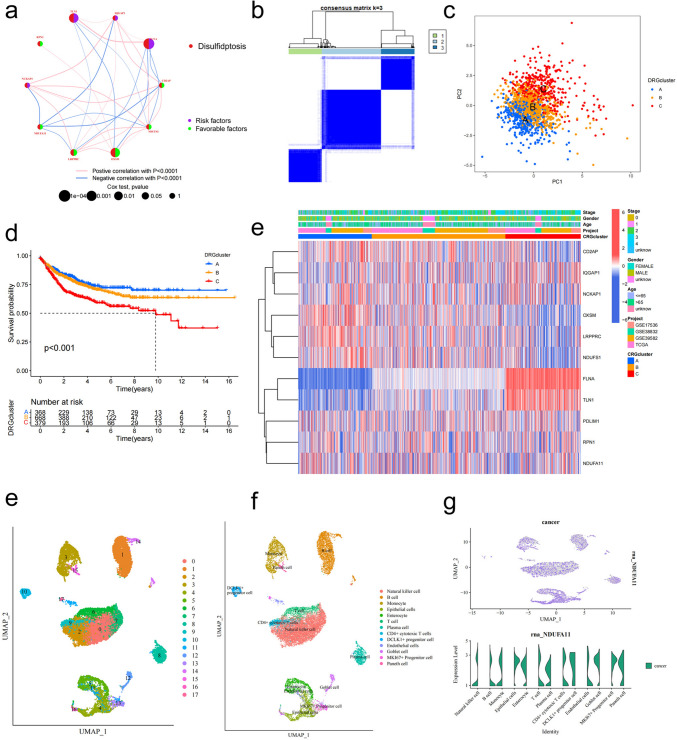
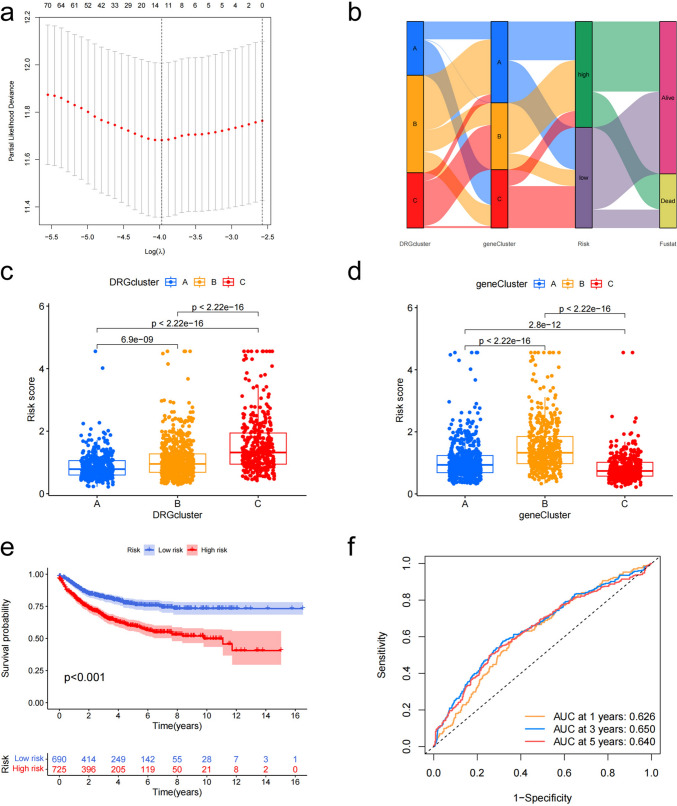
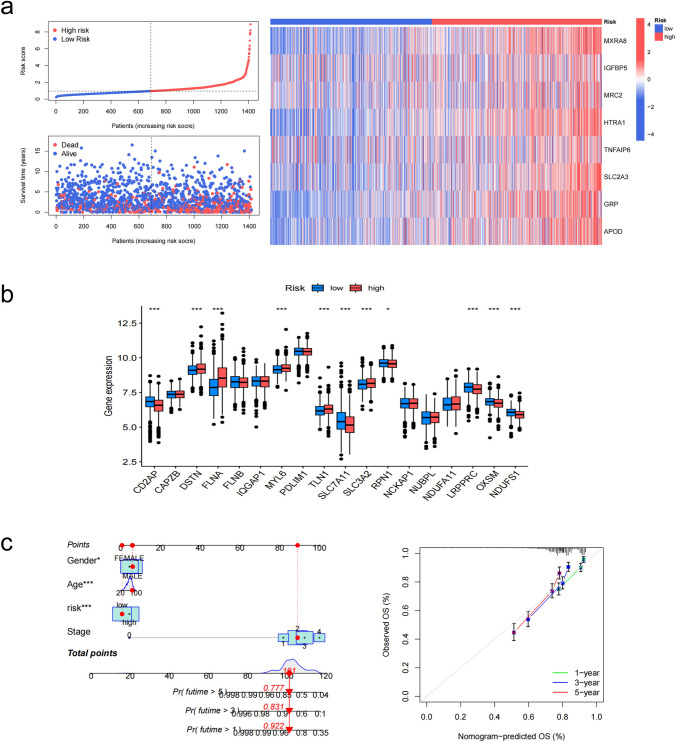
Results: Using disulfidptosis-related genes collected from the literature, we classified colorectal cancer patients from public databases into three subtypes. The differentially expressed genes between subtypes were clustered into three gene subtypes, and eight characteristic genes were screened to construct a prognostic model.

Conclusion: The disulfidptosis mechanism has important value in the classification of colorectal cancer patients, and characteristic genes selected based on this mechanism can serve as a new potential biological marker for colorectal cancer.

Keywords: Bioinformatics; Cell death; Colorectal cancer; Disulfidptosis; Prognostic model; Tumor classification.


Conflict of interest statement

The authors have no relevant financial or non-financial interests to disclose.

Figures

Fig. 1
Fig. 1
Workflow diagram
Fig. 2
Fig. 2
Expression, genetic, and transcriptional results of DRGs in CRC: a differential expression of 24 DRGs in normal individuals and CRC patients; b mutation status of 24 DRGs in CRC; c frequency of CNV gain or loss in DRGs in COAD; d frequency of CNV gain or loss in DRGs in READ; e locations of CNV changes in DRGs on the 23 chromosomes in the COAD cohort; f locations of CNV changes in DRGs on the 23 chromosomes in the READ cohort
Fig. 3
Fig. 3
Subtypes related to disulfidptosis and prognosis DRG single-cell validation results: a prognosis network diagram composed of prognosis-related DRGs, in which the lines represent interactions between DRGs and the thickness represents the strength of the correlation; b consensus matrix heatmap of three subgroups (k = 3) and their related areas; c PCA analysis of transcriptome differences among the three subtypes; d Kaplan–Meier plot of survival for the three subtypes; e differences in clinical pathological features and expression levels of DRGs among the three subtypes; f, g annotation diagrams of cell clustering in CRC single-cell sequencing dataset; h expression results of NDUFA11 in each cell type
Fig. 4
Fig. 4
Heatmap of GSVA function and pathway enrichment between subtypes
Fig. 5
Fig. 5
The analysis of immune cell infiltration and enrichment between subtypes: a the boxplot displaying immune cell infiltration between the three subtypes; b the bar plot displaying GO enrichment analysis of the differentially expressed genes (DEGs) between subtypes; c the bubble plot displaying GO enrichment analysis of the DEGs between subtypes
Fig. 6
Fig. 6
The gene subtypes identified based on the DEGs between DRG subtypes. a The heatmap matrix of the gene subgroups divided by the consensus clustering algorithm (k = 3); b a CDF (cumulative distribution function) plot of the consensus clustering algorithm. c Kaplan–Meier survival curves of the three identified gene subtypes in CRC patients. d The heatmap illustrating the relationship between the three gene subtypes and clinical pathological characteristics. e Boxplots depicting the differential expression of prognosis-related DRGs among the three gene subtypes
Fig. 7
Fig. 7
The analysis results of the prognostic DRG score are presented as follows: a a LASSO regression result plot for the prognostic model; b a relationship diagram between the DRG subtypes, gene subtypes, and prognostic outcomes; c differences in DRG score between disulfidptosis subtypes; d differences in DRG score between gene subtypes; e Kaplan–Meier survival curves for the risk groups divided by DRG score; f ROC curves for predicting the sensitivity and specificity of DRG score in predicting 1-, 3-, and 5-year survival periods
Fig. 8
Fig. 8
The prognostic analysis results of DRG scores are presented: a differences in survival outcomes and prognostic gene expression between the risk groups; b differences in the prognostic expression of DRGs between the risk groups; c the nomogram and calibration chart of DRG scores
Fig. 9
Fig. 9
Immunohistochemical map of prognostic genes
Fig. 10
Fig. 10
The analysis of DRG score and its association with TME, TMB, and MSI: a correlation between prognostic genes and 22 immune cell infiltrations; b TME score analysis between the risk groups; c tumor mutation burden (TMB) analysis between the risk groups; d waterfall plot showing the tumor mutation frequency in the low-risk group; e waterfall plot showing the tumor mutation frequency in the high-risk group; f, g the relationship between DRG score and different MSI statuses; h the relationship between DRG score and CSC

References

    1. Ancey PB, Contat C, Meylan E (2018) Glucose transporters in cancer—from tumor cells to the tumor microenvironment. FEBS J 285(16):2926–2943. 10.1111/febs.14577 - PubMed
    1. Augustine T, Maitra R, Zhang J, Nayak J, Goel S (2019) Sensitization of colorectal cancer to irinotecan therapy by PARP inhibitor rucaparib. Investig New Drugs 37(5):948–960. 10.1007/s10637-018-00717-9 - PubMed
    1. Bajo-Grañeras R, Crespo-Sanjuan J, García-Centeno RM, Garrote-Adrados JA, Gutierrez G, García-Tejeiro M et al (2013) Expression and potential role of apolipoprotein D on the death-survival balance of human colorectal cancer cells under oxidative stress conditions. Int J Colorectal Dis 28(6):751–766. 10.1007/s00384-012-1616-2 - PubMed
    1. Chan TC, Li CF, Ke HL, Wei YC, Shiue YL, Li CC et al (2019) High TNFAIP6 level is associated with poor prognosis of urothelial carcinomas. Urol Oncol 37(4):293.e11-293.e24. 10.1016/j.urolonc.2018.12.009 - PubMed
    1. Chen P, Li X, Zhang R, Liu S, Xiang Y, Zhang M et al (2020) Combinative treatment of β-elemene and cetuximab is sensitive to KRAS mutant colorectal cancer cells by inducing ferroptosis and inhibiting epithelial-mesenchymal transformation. Theranostics 10(11):5107–5119. 10.7150/thno.44705 - PMC - PubMed

LinkOut - more resources