. 2023 Oct:36:101749.
doi: 10.1016/j.tranon.2023.101749. Epub 2023 Aug 4.

APE1 promotes radiation resistance against radiation-induced pyroptosis by inhibiting the STING pathway in lung adenocarcinoma

Affiliations

APE1 promotes radiation resistance against radiation-induced pyroptosis by inhibiting the STING pathway in lung adenocarcinoma

Jing Zhou et al. Transl Oncol. 2023 Oct.

Abstract

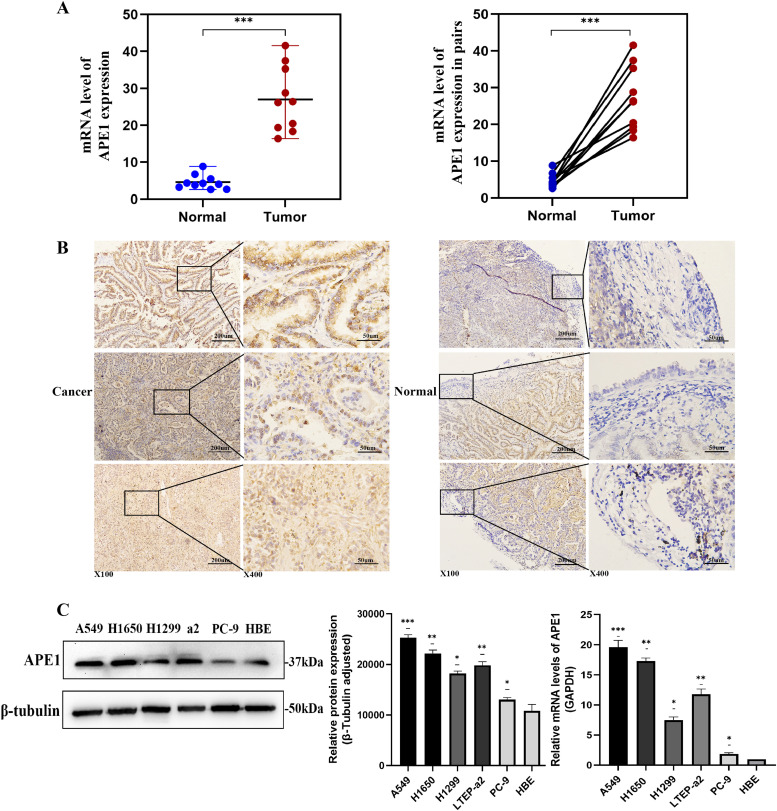
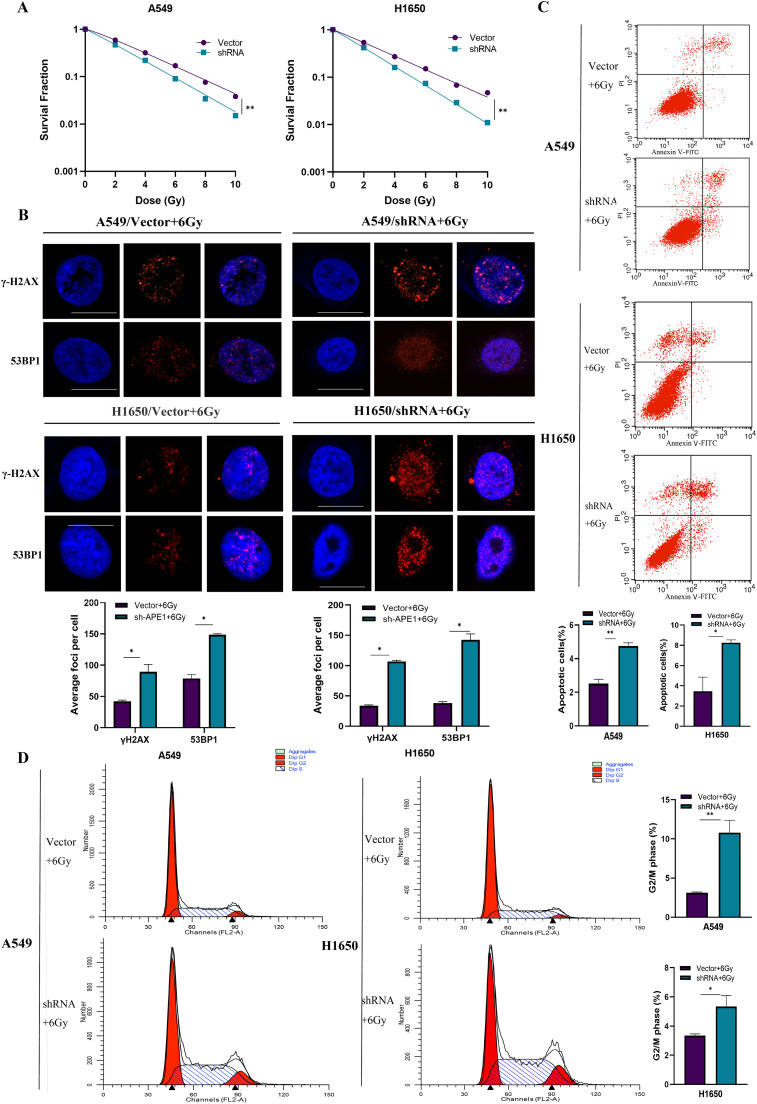
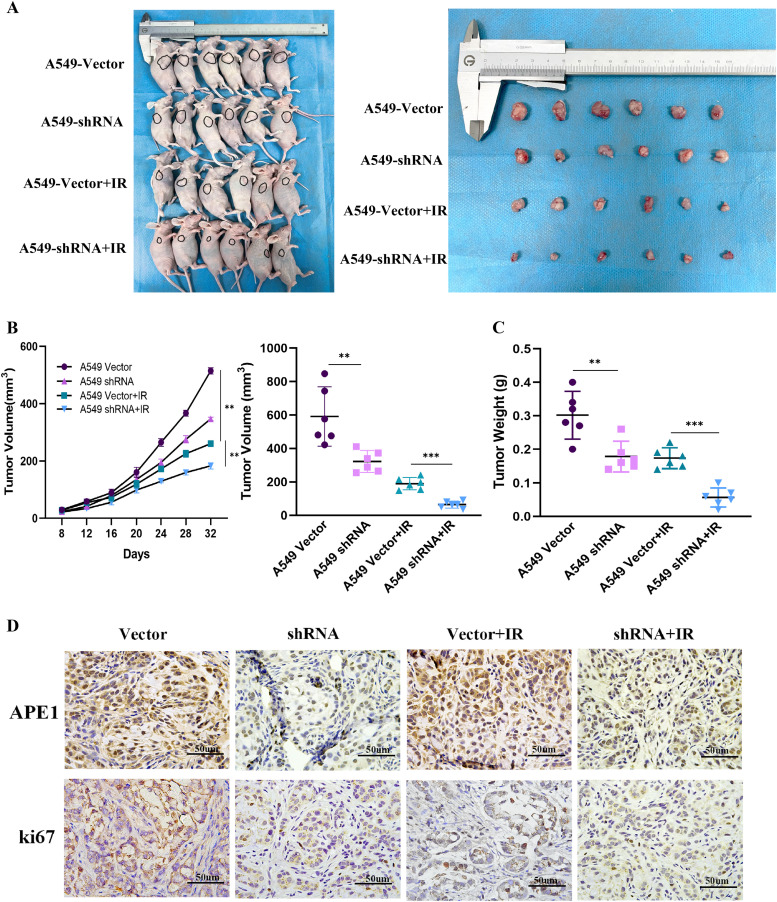
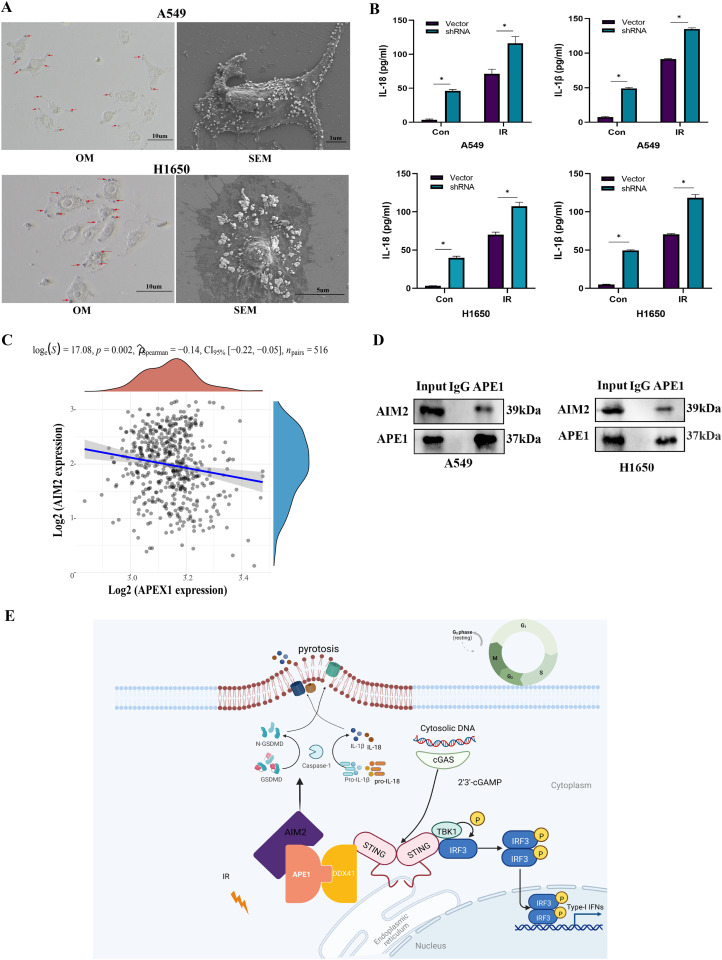
Mammalian apurinic/apyrimidinic endonuclease 1 (APE1, APEX1) is a multifunctional enzyme that maintains cellular homeostasis. It is involved in the base excision repair (BER) pathway and plays a key role in radiation-induced DNA damage response. However, the relationship between APE1-driven radiation resistance and pyroptosis in lung adenocarcinoma (LUAD) cells and the underlying molecular mechanisms remain unclear. We found that APE1 was significantly upregulated in LUAD tissues compared to para-carcinoma tissues and promoted the proliferation and invasion of LUAD cells in vitro and in vivo. Mechanistically, APE1 inhibited pyroptosis by inactivating the interferon gene stimulator (STING) pathway via direct interaction with AIM2 and DDX41, as detected by RNA-seq and co-immunoprecipitation. APE1 protects LUAD cells against radiation-induced damage and induces radio-resistance by targeting the STING pathway. It can induce pyroptosis and is negatively regulated by interactions with AIM2 and DDX41. Therefore, APE1 inhibitors should be considered to enhance the radiosensitivity of LUAD cells and improve patient prognosis and therapeutic outcomes. Thus, APE1 play a role in the tumor immune microenvironment and in tumor immunotherapy.

Keywords: APE1; LUAD; Pyroptosis; Radiosensitivity; STING.


Conflict of interest statement

Declaration of Competing Interest None.

Figures

Fig 1
Fig. 1
APE1 upregulates in the tumor tissues in datasets. (A) APE1 was significantly upregulated in LUAD tissues(n=486) compared to the normal tissues(n=54) through the bioinformatics analysis of the TCGA-LUAD datasets. An independent-sample Student's t-test was performed and significant differences were indicated. (B) The expression distribution of APE1 gene were in lung cancer and adjacent normal tissues in GEO datasets (GSE33532 and GSE75037). There are unpaired samples in GSE33532 including tumor number(n=80), normal lung tissues number(n=20) and paired samples in GSE75037(n=83). The abscissa represents different groups of samples: G1 means tumor tissues and G2 means non-malignant lung tissues and the ordinate represents the expression distribution of the gene, different colors represent different groups, top-left represents the significance P-value. (C) The expression of APE1 was associated with the tumor stage (T stage). (D) The expression of APE1 was associated with the lymphatic metastasis. (E) The expression of APE1 was associated with the pathologic stage. (F) The expression of APE1 was irrelated to smoke. The statistical difference of two groups was compared through the Wilcox test.
Fig 2
Fig. 2
The expression of APE1 is higher in LUAD tissues and cells. (A) The expression of APE1 in tumorous and their paired paracarcinoma tissues from 10 LUAD patients were detected in the level of mRNA by qPCR. (B) APE1 was upregulated in the tumor tissues compared with corresponding adjacent normal tissues. APE1 was primarily located in the nucleus. (C) The protein and mRNA expression of APE1 in a normal human lung bronchial epithelial cell line HBE and five LUAD cell lines were tested by western blot and qRT-PCR. *P<0.05, **P<0.01, ***P<0.001.
Fig 3
Fig. 3
APE1 promotes cell proliferation of LUAD cells in vitro. A549 and H1650 cells were transfected with two effective APE1-siRNA (si-APE1–2 and si-APE1–3). (A) Cell proliferation was examined by CCK8. (B) EdU incorporation assay was that in which cells synthesizing DNA stained with EDU (red), nuclei counter stained with Hoechst 33,342 (blue). These three kinds of cells were labelled with EdU about 2h. Scale bar is 100 µm. (C) Flow cytometric was analysis apoptosis in A549 shRNA and H1650 shRNA cells by Annexin-V FITC and PI staining. A representative flow profile is presented (left), and a summary of the percentages for Annexin V-positive cells is shown (right). Error bars correspond to means ± standard deviations from three independent experiments. *P<0.05.
Fig 4
Fig. 4
APE1 promotes cell migration and invasion of LUAD cells in vitro. (A) The wound healing assay was used to show the migration of APE1 in A549 and H1650 cells. The cells migrated into the wounded areas were photographed at 0h and 48h. Error bars correspond to means ± standard deviations from three independent experiments. *P< 0.05. Scale bar is 100µm. (B) The migration and invasion of APE1 in A549 and H1650 cells were also examined by Transwell assay. It showed that cell migration/invasion was significantly inhibited by APE1 knockdown in A549 and H1650 cells compared to that in controls. The results were represented as mean ± SD, *P<0.05. Scale bar is 100 µm.
Fig 5
Fig. 5
APE1 affects radiation sensitivity in NSCLC cells. The stably transfected A549 cells and H1650 cells were exposed in X-ray irradiation. (A) Clone formation statistical data of A549 and H1650 cells were after APE1 knockdown irradiated by different doses of X-ray. A549/shRNA and H1650/shRNA cells with APE1 knockdown were more sensitive to irradiation than control cells. (B) The number of foci was in γ-H2AX and 53BP1 after irradiation. Scale bars is 10μm. (C) Flow cytometric was analysis of apoptosis in A549/shRNA and H1650/shRNA cells after irradiation by Annexin-V FITC and PI staining. (D) Flow cytometric was analysis of the cell cycle in A549/shRNA and H1650/shRNA cells after irradiation compared to control cells. Error bars correspond to means ± standard deviations from three independent experiments. *P<0.05; **P<0.01.
Fig 6
Fig. 6
APE1 negatively regulates STING-TBK1-IRF3 pathway. (A) P-STING protein expression level was increased after knockdown of APE1 in A549 and H1650 cells, as well as the downstream molecules of STING pathway. (B) P-STING protein expression level and the downstream molecules of STING pathway were decreased in PC9 cells with overexpression of APE1. *P<0.05; **P<0.01 (C) DDX41 was closely related to APE1 in TCGA-LUAD datasets, according to the correlations between two genes. The expression correlation of two genes was analyzed with Spearman. The abscissa represents the expression distribution of the first gene APE1, and the ordinate represents the expression distribution of the second gene DDX41.The density curve on the right represents the trend in distribution of the second gene, the upper density curve represents the trend in distribution of first gene expression. The value on the top represents the correlation p value, correlation coefficient and correlation calculation Amethod. (D) Co-immunoprecipitation (co-IP) was used to validate the interaction of APE1 and DDX41, APE1 was pulled down by anti-DDX41, and western blot was used to detect APE1 and DDX41.
Fig 7
Fig. 7
APE1 promotes tumorigenesis and the radiation resistance of LUAD cells in vivo. (A) Representative images of BALB/c nude mice and tumor lumps were at day 32 after inoculation of A549 cells with or without shRNA mediated silencing of APE1. It included Vector control group: mice inoculated with control A549 cells, shRNA group: mice inoculated with A549/shRNA cells, Vector control+IR group: mice inoculated with control A549 cells and treated with irradiation, shRNA+IR group: mice inoculated with A549/shRNA cells and treated with irradiation. The mice in two irradiation groups were irradiated by a total dose of 10Gy X-ray (two exposures every 6 days) with an 8-MeV electron beam. (B) The subcutaneous tumor volume curves were different. (C) Tumor weight was measured. The tumors were weighted immediately after dissection. Tumor weights are represented as means of tumor weights ± SD (n = 12). *P<0.05; **P<0.01; ***P<0.005. (D) Representative images of the immunohistochemical staining of APE1 and Ki-67 expression were in nude mice xenograft tumor sections (magnification, × 400). (*P<0.05. Data were obtained from three independent experiments). Scale bar is 50 µm.
Fig 8
Fig. 8
APE1 regulates STING by DDX41 and induce pyroptosis by interacting with AIM2. (A) A549 and H1650 cells were observed with optical and electronic microscope after irradiation. (B) The detection release quantity of A549 and H1650 cells after radiation were higher than control cells by ELISA experiment. *P<0.05. (C) AIM2 was closely related to APE1 in TCGA-LUAD datasets, according to the correlations between two genes. The abscissa represents the expression distribution of the first gene APE1, and the ordinate represents the expression distribution of the second gene AIM2. The density curve on the right represents the trend in distribution of the second gene, the upper density curve represents the trend in distribution of first gene expression. The value on the top represents the correlation p value, correlation coefficient and correlation calculation method. (D) Co-IP also was used to prove the interaction of APE1 and AIM2 in A549 and H1650 cells. APE1 was pulled down by anti-AIM2, and then APE1 and AIM2 were detected by western blot. (E) A schematic diagram of the functional roles of APE1 in LUAD cells. The results were represented as mean ± SD. All experiments were repeated three times.

Similar articles

Cited by

References

    1. Sun B., Brooks E.D., Komaki R.U., Liao Z., Jeter M.D., McAleer M.F., et al. 7-year follow-up after stereotactic ablative radiotherapy for patients with stage I non-small cell lung cancer: results of a phase 2 clinical trial. Cancer. 2017;123(16):3031–3039. - PMC - PubMed
    1. Smith R.A., Andrews K.S., Brooks D., Fedewa S.A., Manassaram-Baptiste D., Saslow D., et al. Cancer screening in the United States, 2019: a review of current American Cancer Society guidelines and current issues in cancer screening. CA Cancer J. Clin. 2019;69(3):184–210. - PubMed
    1. Siegel R.L., Miller K.D., Fuchs H.E., Jemal A. Cancer Statistics, 2021. CA Cancer J. Clin. 2021;71(1):7–33. - PubMed
    1. Lamkanfi M., Dixit V.M. Mechanisms and functions of inflammasomes. Cell. 2014;157(5):1013–1022. - PubMed
    1. Man S.M., Karki R., Kanneganti T.D. Molecular mechanisms and functions of pyroptosis, inflammatory caspases and inflammasomes in infectious diseases. Immunol. Rev. 2017;277(1):61–75. - PMC - PubMed