

Cause-specific mortality by county, race, and ethnicity in the USA, 2000-19: a systematic analysis of health disparities
- PMID: 37544309
- PMCID: PMC10528747
- DOI: 10.1016/S0140-6736(23)01088-7
Cause-specific mortality by county, race, and ethnicity in the USA, 2000-19: a systematic analysis of health disparities
Abstract
Background: Large disparities in mortality exist across racial-ethnic groups and by location in the USA, but the extent to which racial-ethnic disparities vary by location, or how these patterns vary by cause of death, is not well understood. We aimed to estimate age-standardised mortality by racial-ethnic group, county, and cause of death and describe the intersection between racial-ethnic and place-based disparities in mortality in the USA, comparing patterns across health conditions.
Methods: We applied small-area estimation models to death certificate data from the US National Vital Statistics system and population data from the US National Center for Health Statistics to estimate mortality by age, sex, county, and racial-ethnic group annually from 2000 to 2019 for 19 broad causes of death. Race and ethnicity were categorised as non-Latino and non-Hispanic American Indian or Alaska Native (AIAN), non-Latino and non-Hispanic Asian or Pacific Islander (Asian), non-Latino and non-Hispanic Black (Black), Latino or Hispanic (Latino), and non-Latino and non-Hispanic White (White). We adjusted these mortality rates to correct for misreporting of race and ethnicity on death certificates and generated age-standardised results using direct standardisation to the 2010 US census population.
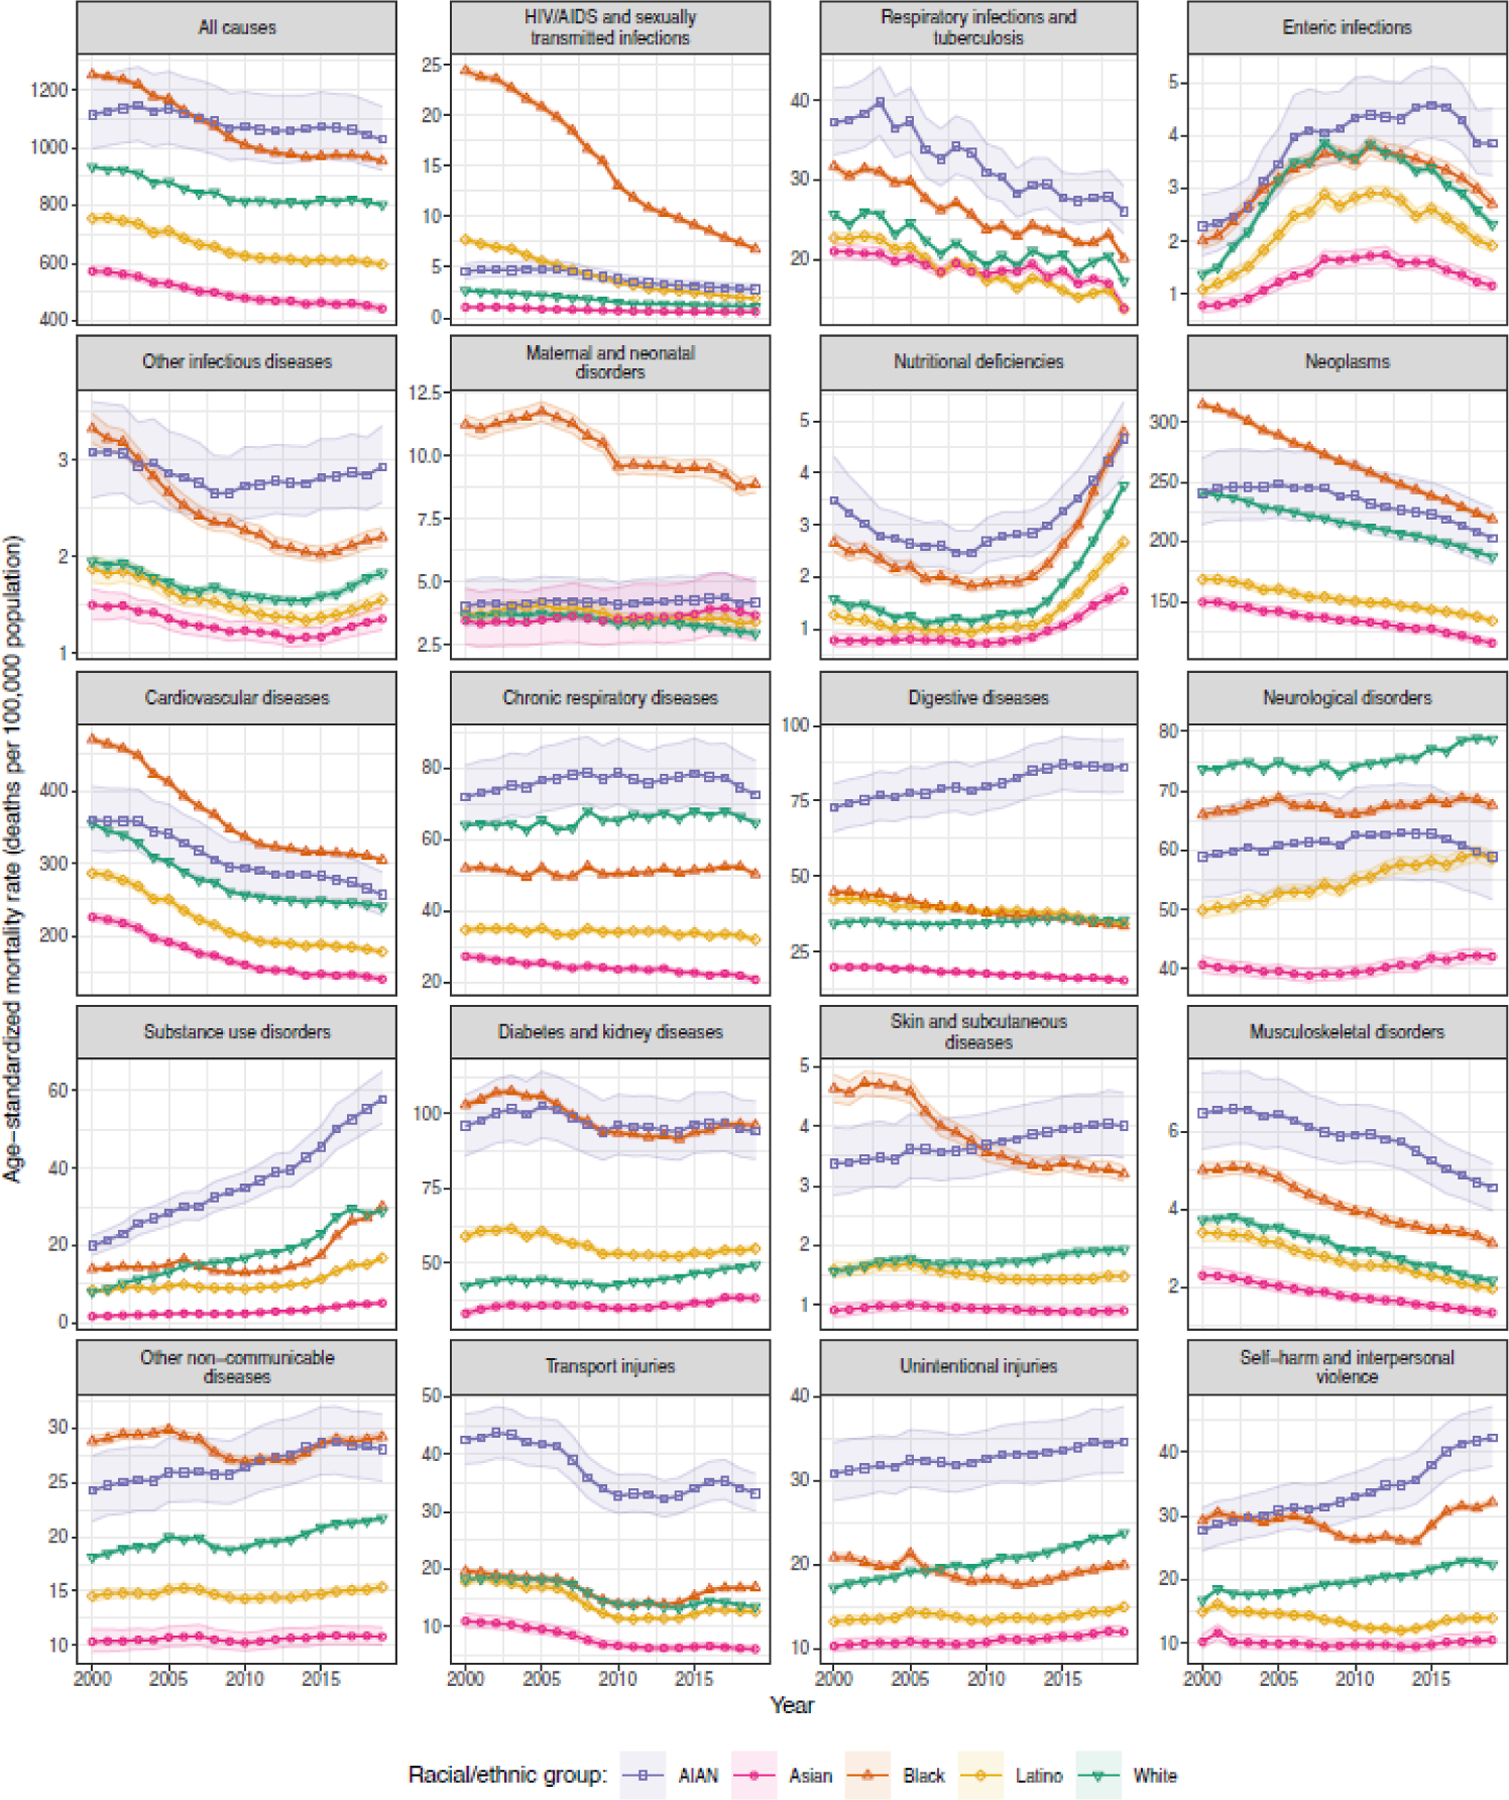
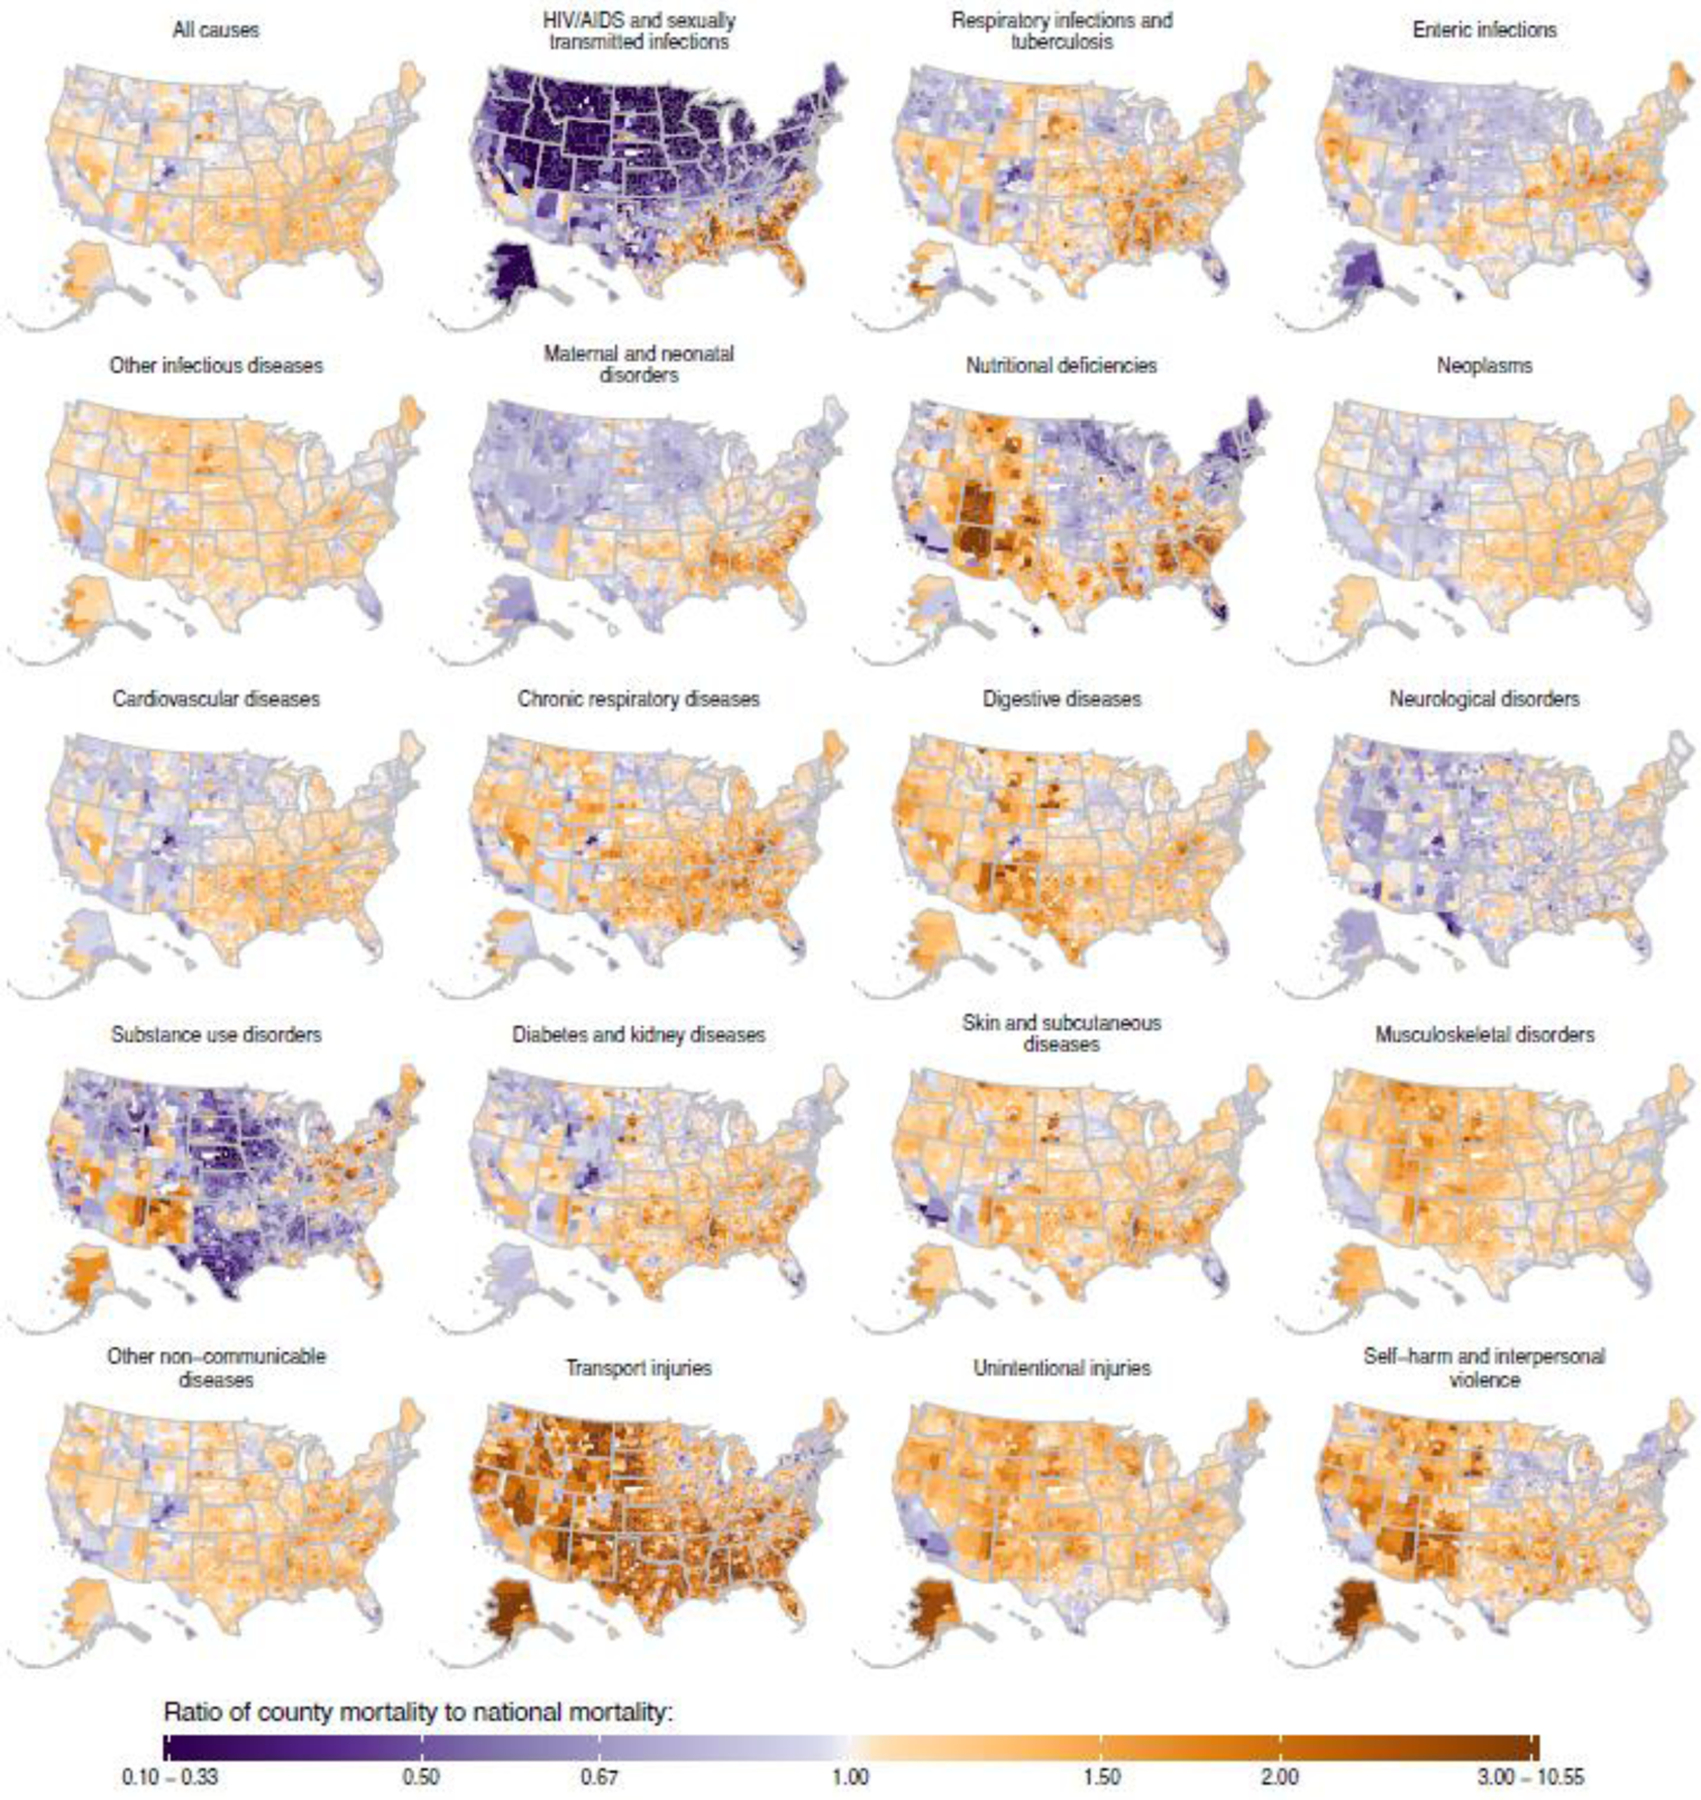
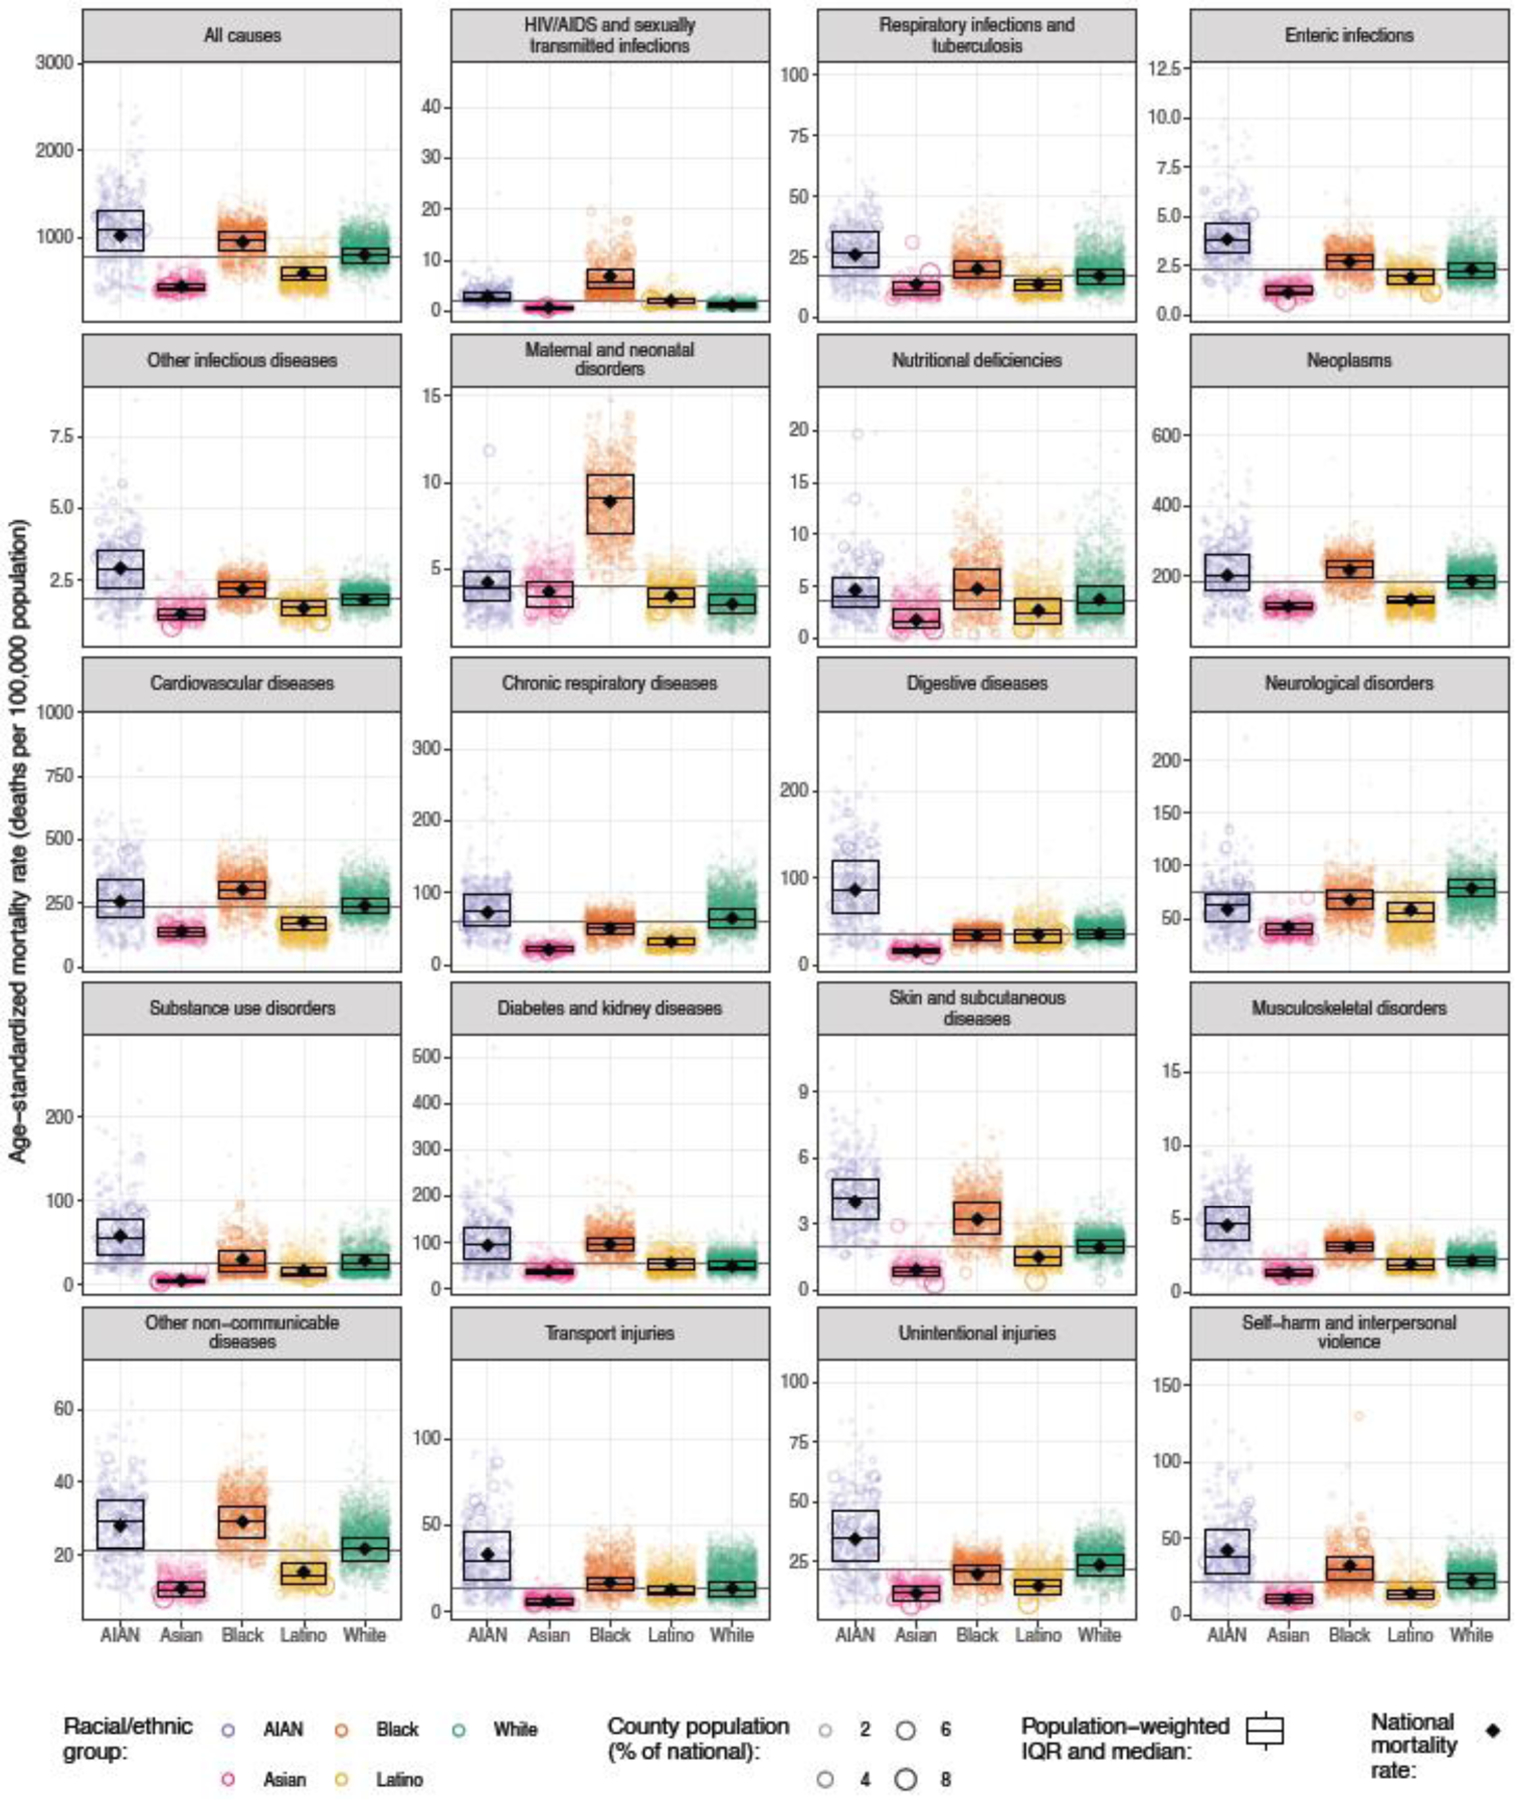
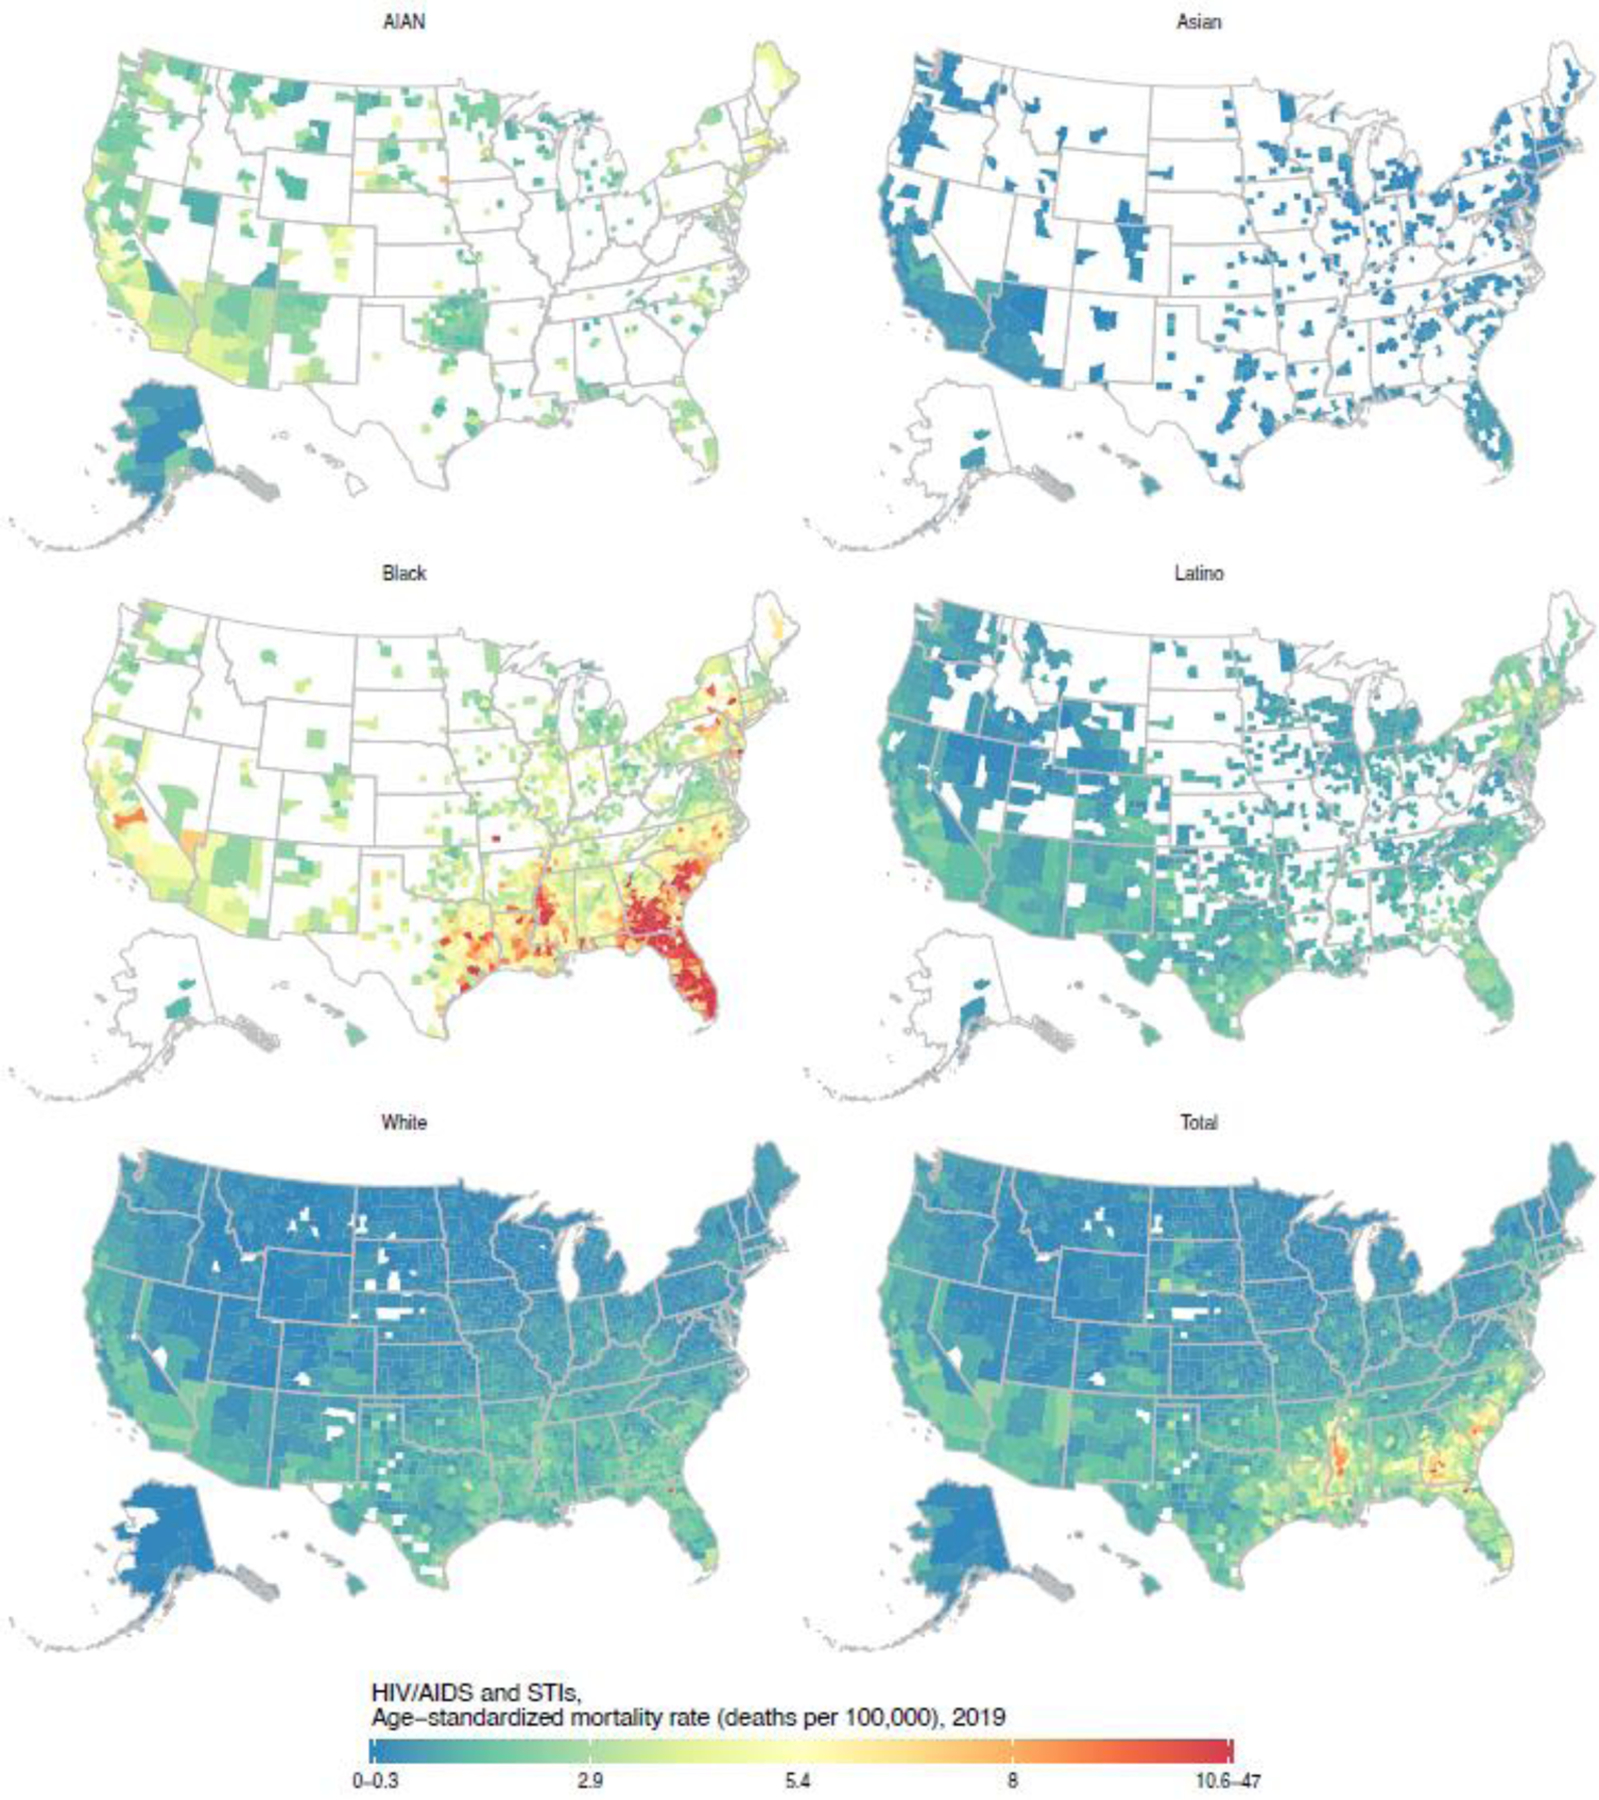
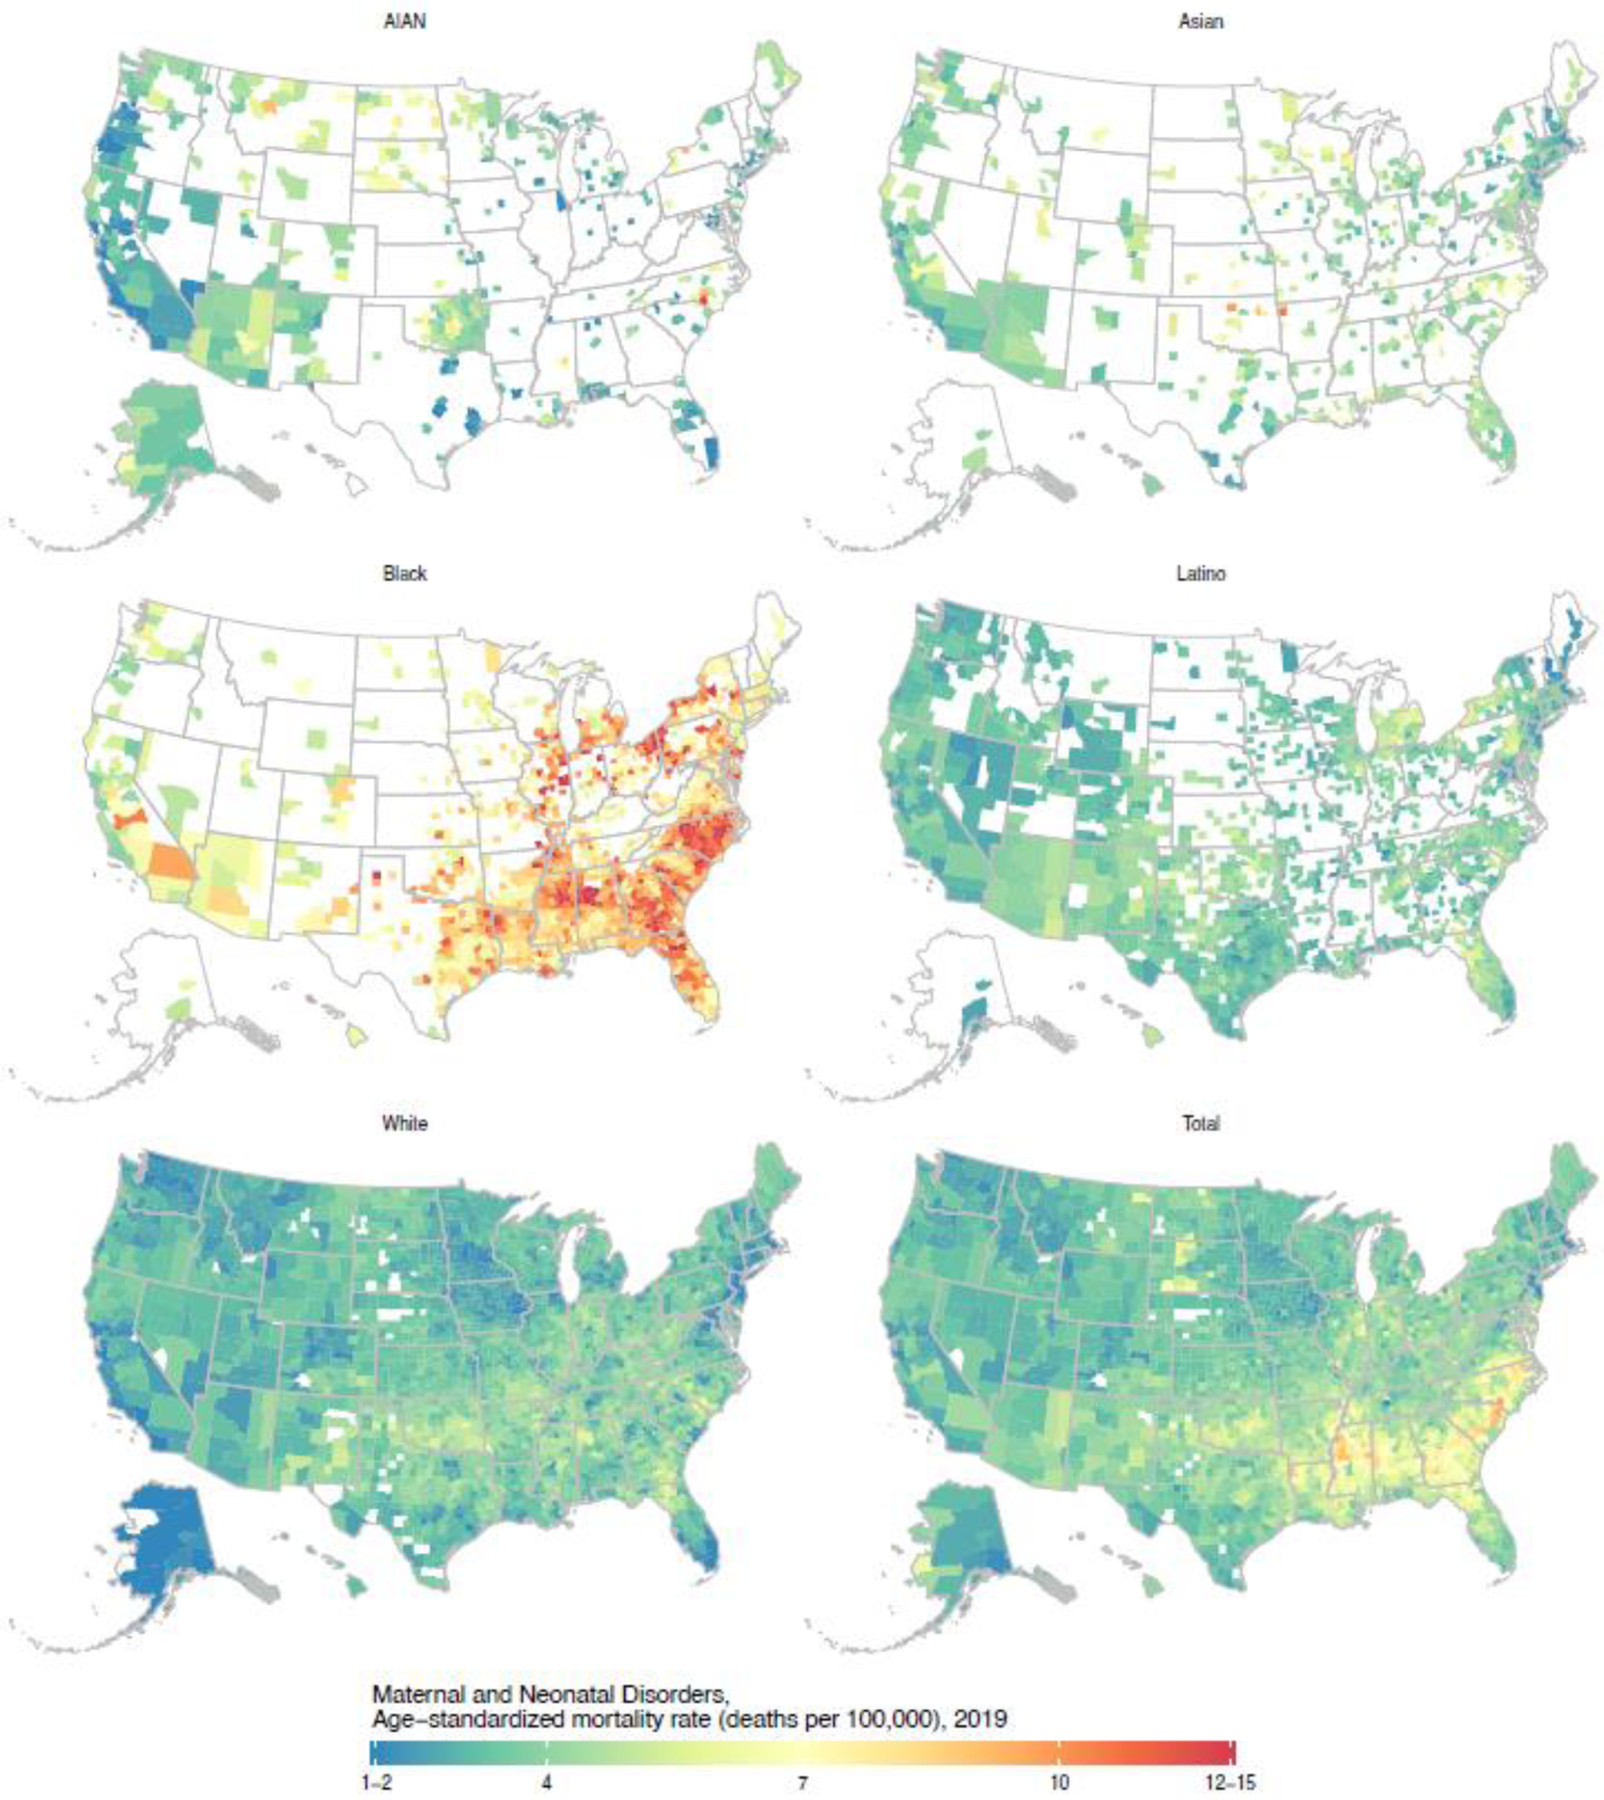
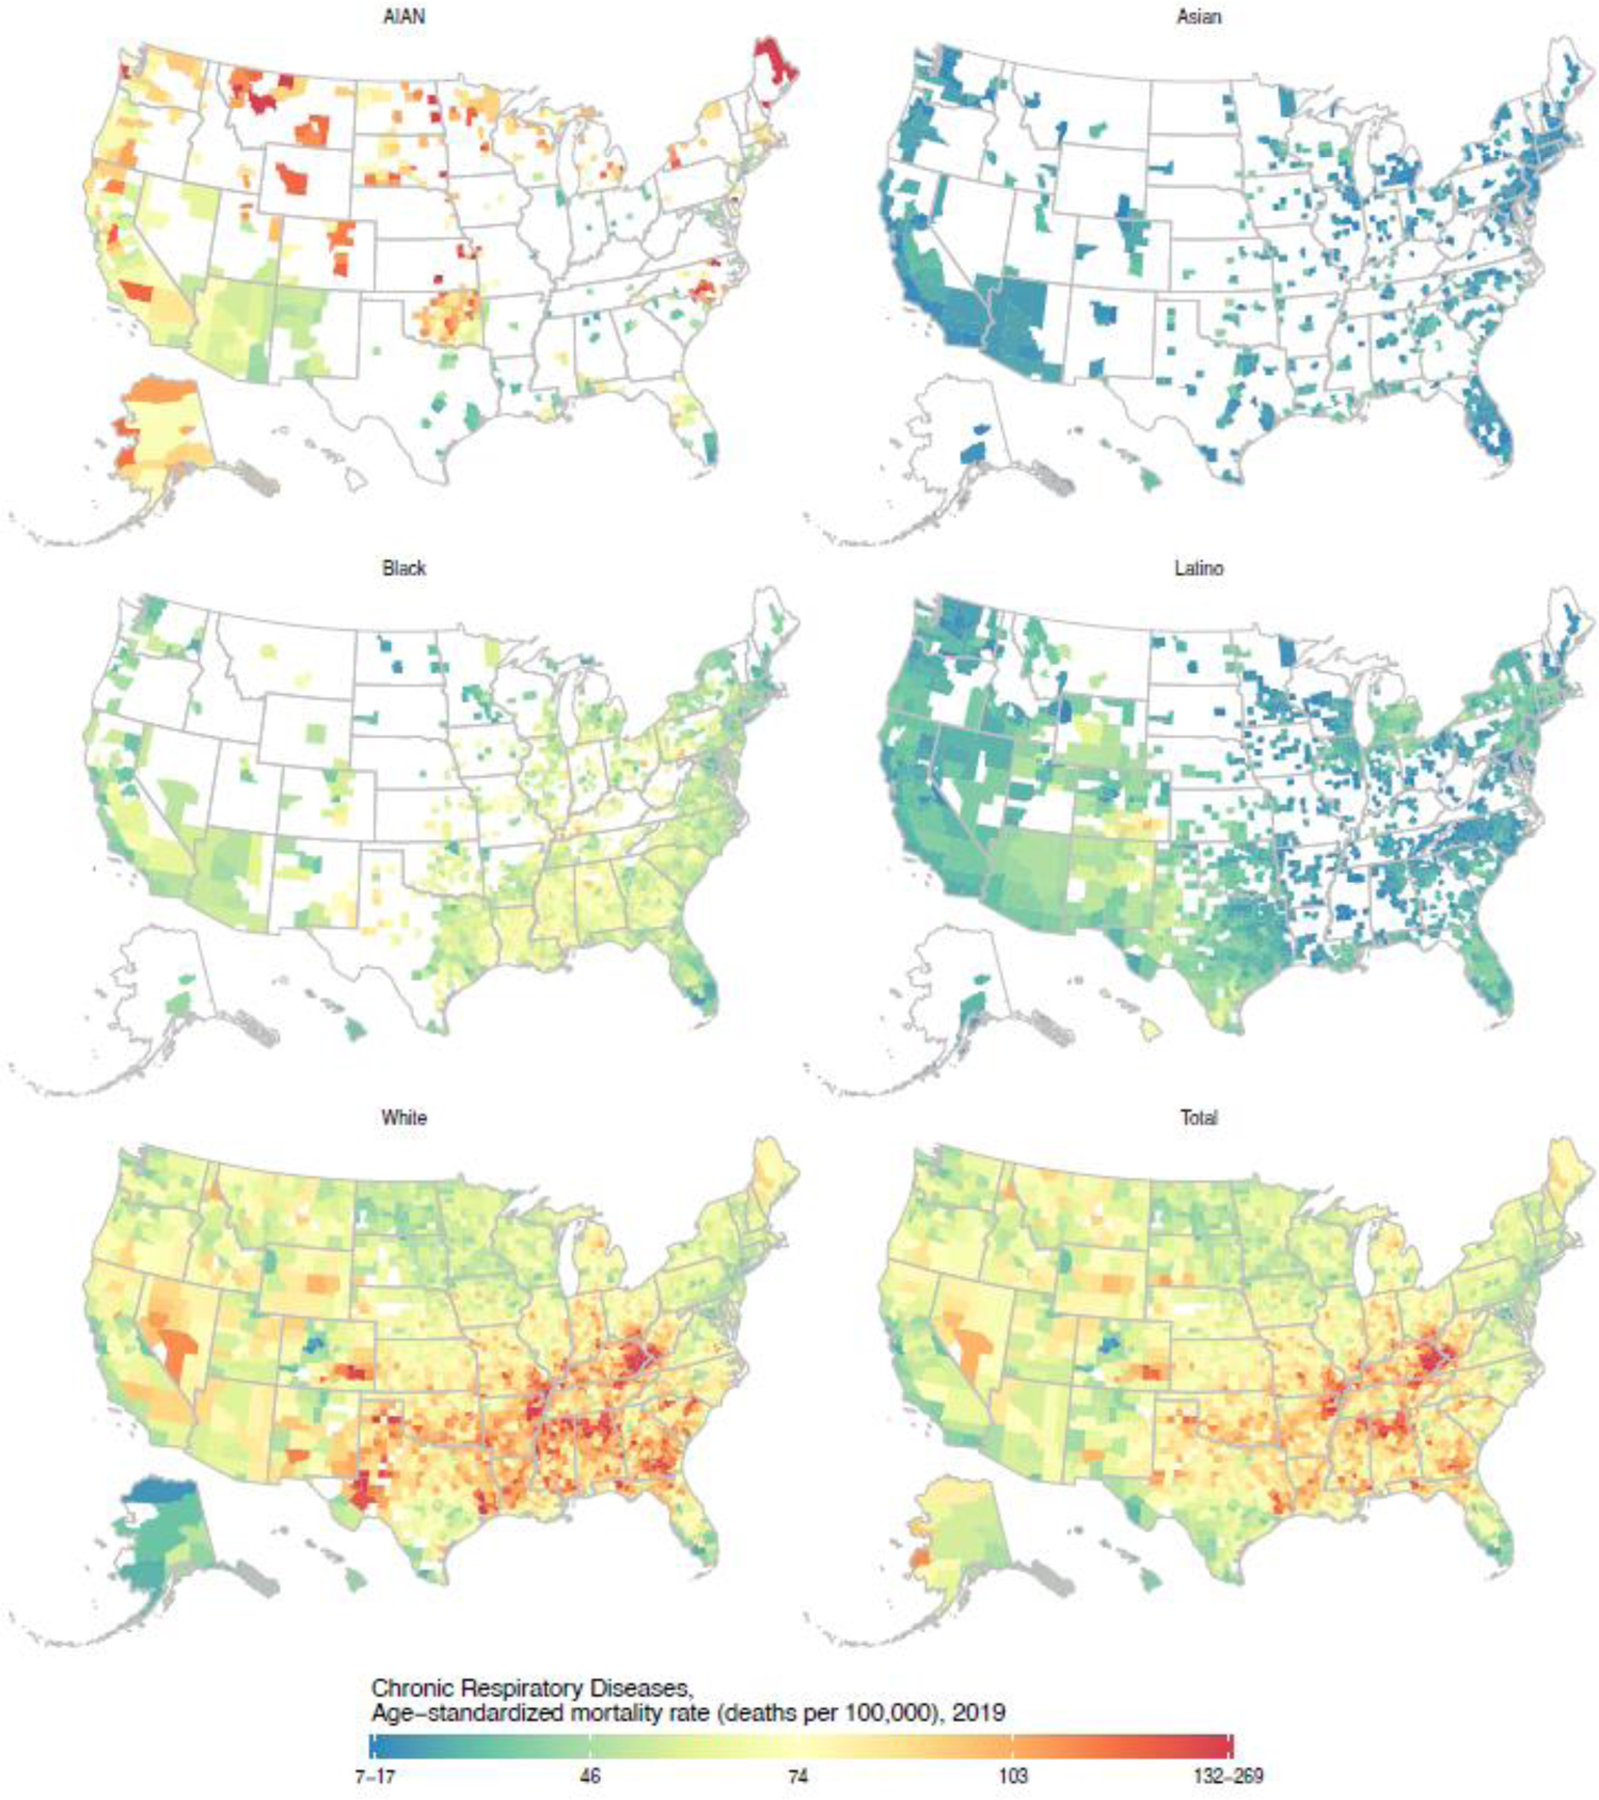
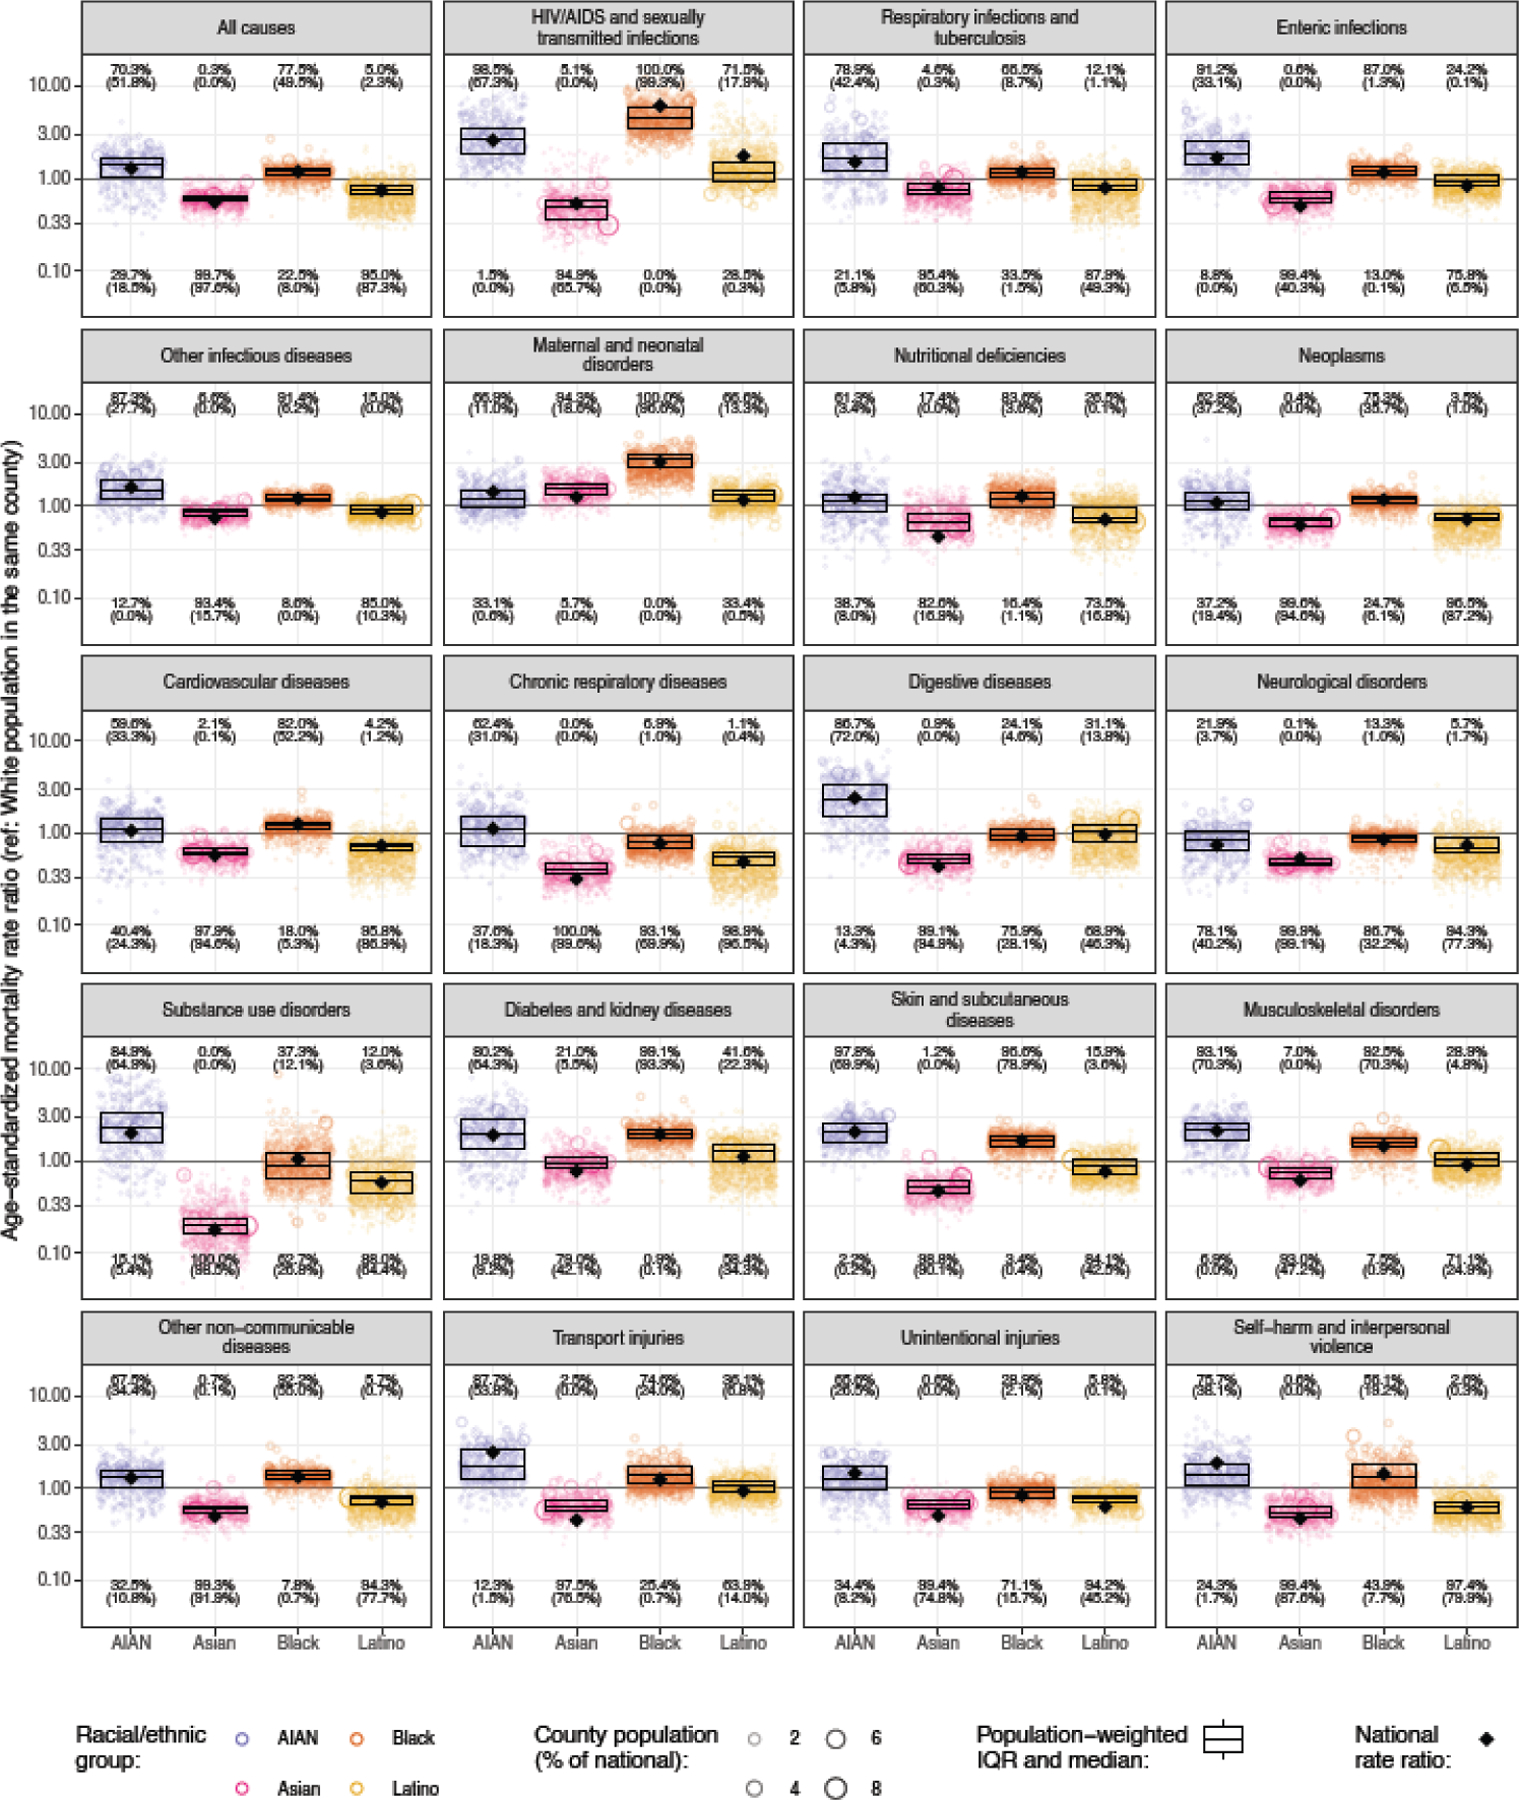
Findings: From 2000 to 2019, across 3110 US counties, racial-ethnic disparities in age-standardised mortality were noted for all causes of death considered. Mortality was substantially higher in the AIAN population (all-cause mortality 1028·2 [95% uncertainty interval 922·2-1142·3] per 100 000 population in 2019) and Black population (953·5 [947·5-958·8] per 100 000) than in the White population (802·5 [800·3-804·7] per 100 000), but substantially lower in the Asian population (442·3 [429·3-455·0] per 100 000) and Latino population (595·6 [583·7-606·8] per 100 000), and this pattern was found for most causes of death. However, there were exceptions to this pattern, and the exact order among racial-ethnic groups, magnitude of the disparity in both absolute and relative terms, and change over time in this magnitude varied considerably by cause of death. Similarly, substantial geographical variation in mortality was observed for all causes of death, both overall and within each racial-ethnic group. Racial-ethnic disparities observed at the national level reflect widespread disparities at the county level, although the magnitude of these disparities varied widely among counties. Certain patterns of disparity were nearly universal among counties; for example, in 2019, mortality was higher among the AIAN population than the White population in at least 95% of counties for skin and subcutaneous diseases (455 [97·8%] of 465 counties with unmasked estimates) and HIV/AIDS and sexually transmitted infections (458 [98·5%] counties), and mortality was higher among the Black population than the White population in nearly all counties for skin and subcutaneous diseases (1436 [96·6%] of 1486 counties), diabetes and kidney diseases (1473 [99·1%]), maternal and neonatal disorders (1486 [100·0%] counties), and HIV/AIDS and sexually transmitted infections (1486 [100·0%] counties).
Interpretation: Disparities in mortality among racial-ethnic groups are ubiquitous, occurring across locations in the USA and for a wide range of health conditions. There is an urgent need to address the shared structural factors driving these widespread disparities.
Funding: National Institute on Minority Health and Health Disparities; National Heart, Lung, and Blood Institute; National Cancer Institute; National Institute on Aging; National Institute of Arthritis and Musculoskeletal and Skin Diseases; Office of Disease Prevention; and Office of Behavioral and Social Sciences Research, US National Institutes of Health.
Copyright © 2023 Elsevier Ltd. All rights reserved.
Conflict of interest statement
Declaration of interests We declare no competing interests.
Figures
Comment in
-
Understanding disparities in the burden of mortality as a step towards health equity in the USA.Lancet. 2023 Sep 23;402(10407):1022-1023. doi: 10.1016/S0140-6736(23)01522-2. Epub 2023 Aug 3. Lancet. 2023. PMID: 37544308 Free PMC article. No abstract available.
References
-
- Du Bois WEB. The Philadelphia Negro: a social study. Philadelphia: University of Pennsylvania Press, 1899.
-
- Harper S, MacLehose RF, Kaufman JS. Trends in the black-white life expectancy gap among US states, 1990–2009. Health Aff (Millwood) 2014; 33: 1375–82. - PubMed
Publication types
MeSH terms
Grants and funding
LinkOut - more resources
Full Text Sources
Medical
