. 2023 Aug;11(8):e007180.
doi: 10.1136/jitc-2023-007180.

Single-cell sequencing on CD8+ TILs revealed the nature of exhausted T cells recognizing neoantigen and cancer/testis antigen in non-small cell lung cancer

Affiliations

Single-cell sequencing on CD8+ TILs revealed the nature of exhausted T cells recognizing neoantigen and cancer/testis antigen in non-small cell lung cancer

Hiroyasu Komuro et al. J Immunother Cancer. 2023 Aug.

Abstract

Background: CD8+tumor infiltrating lymphocytes (TILs) are often observed in non-small cell lung cancers (NSCLC). However, the characteristics of CD8+ TILs, especially T-cell populations specific for tumor antigens, remain poorly understood.

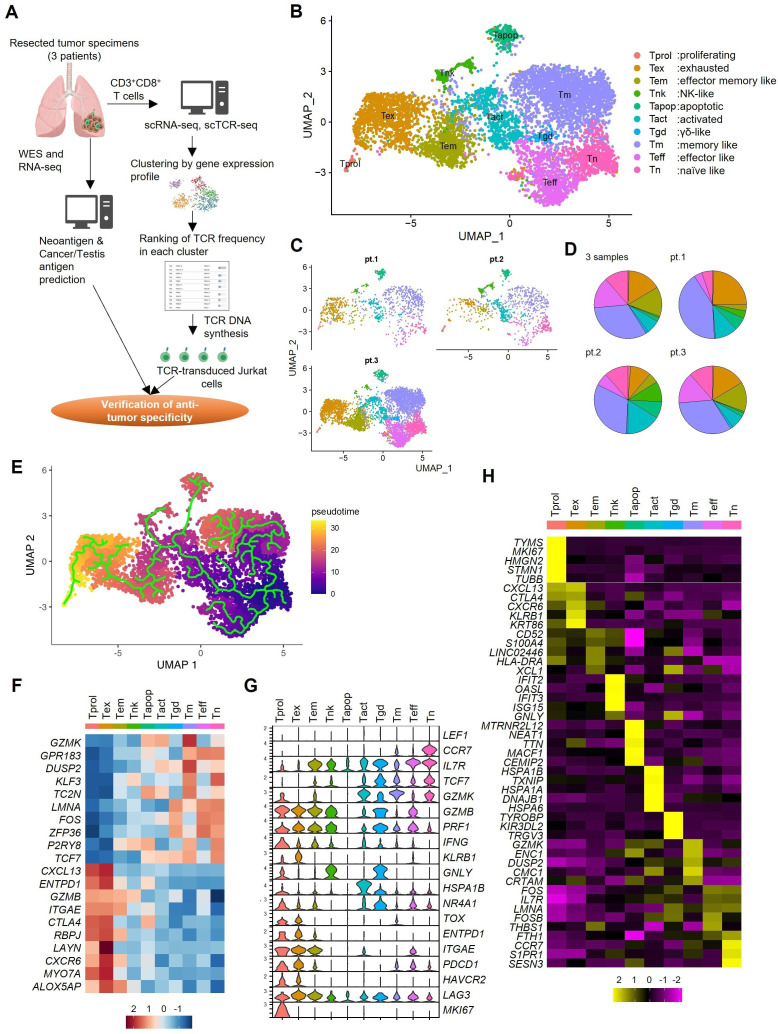
Methods: High throughput single-cell RNA sequencing and single-cell T-cell receptor (TCR) sequencing were performed on CD8+ TILs from three surgically-resected lung cancer specimens. Dimensional reduction for clustering was performed using Uniform Manifold Approximation and Projection. CD8+ TIL TCR specific for the cancer/testis antigen KK-LC-1 and for predicted neoantigens were investigated. Differentially-expressed gene analysis, Gene Set Enrichment Analysis (GSEA) and single sample GSEA was performed to characterize antigen-specific T cells.

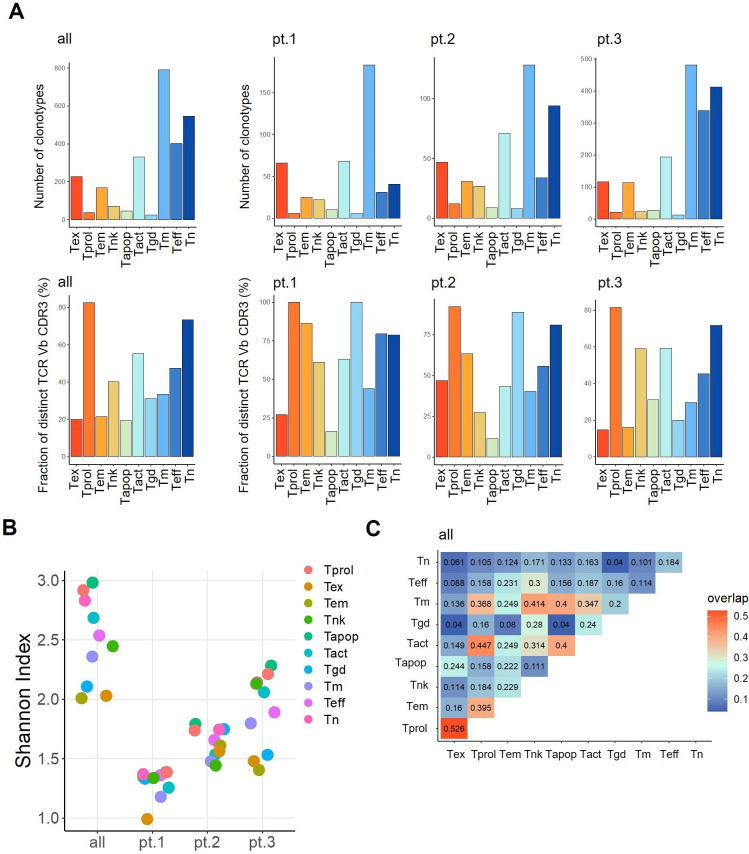
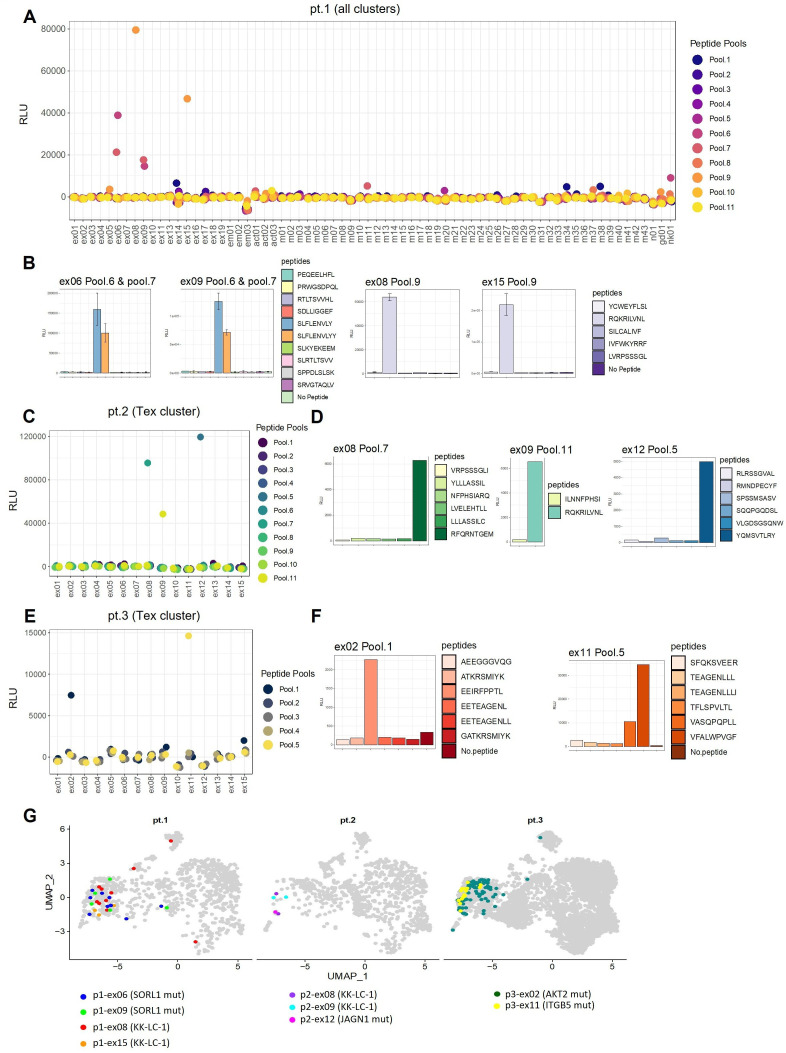
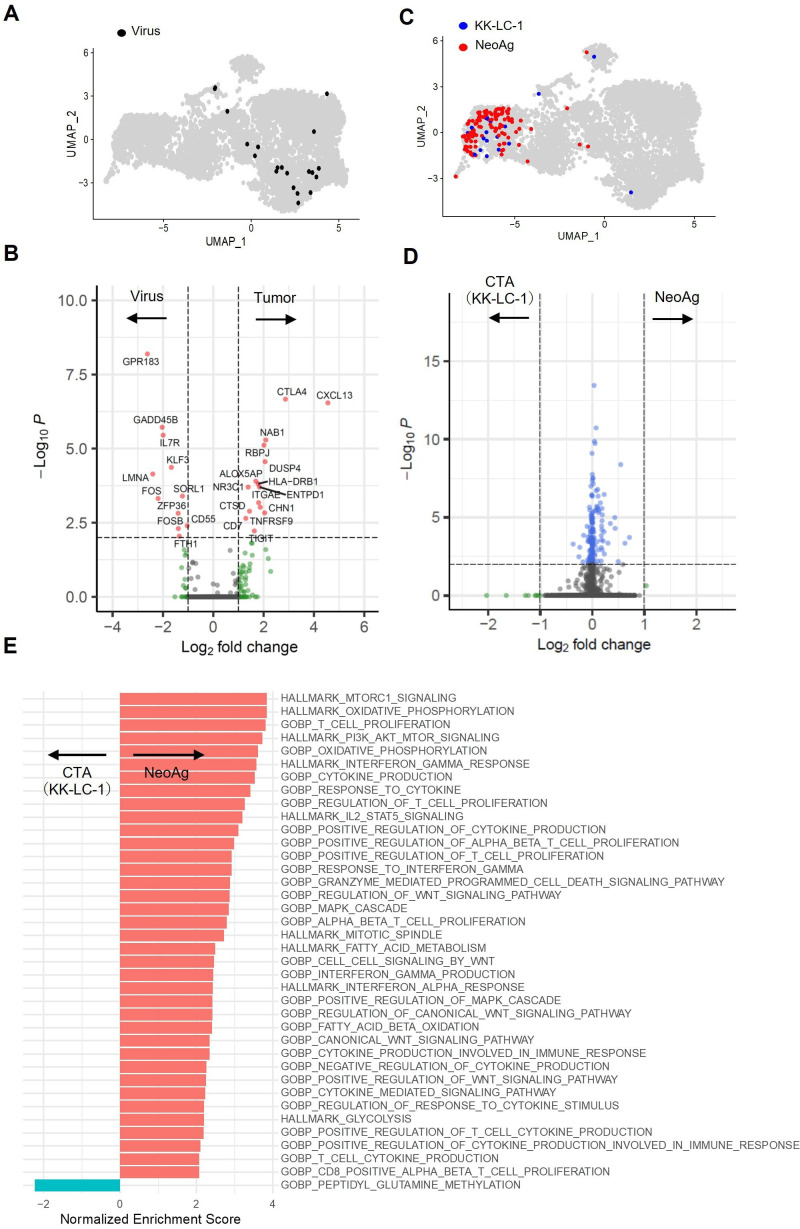
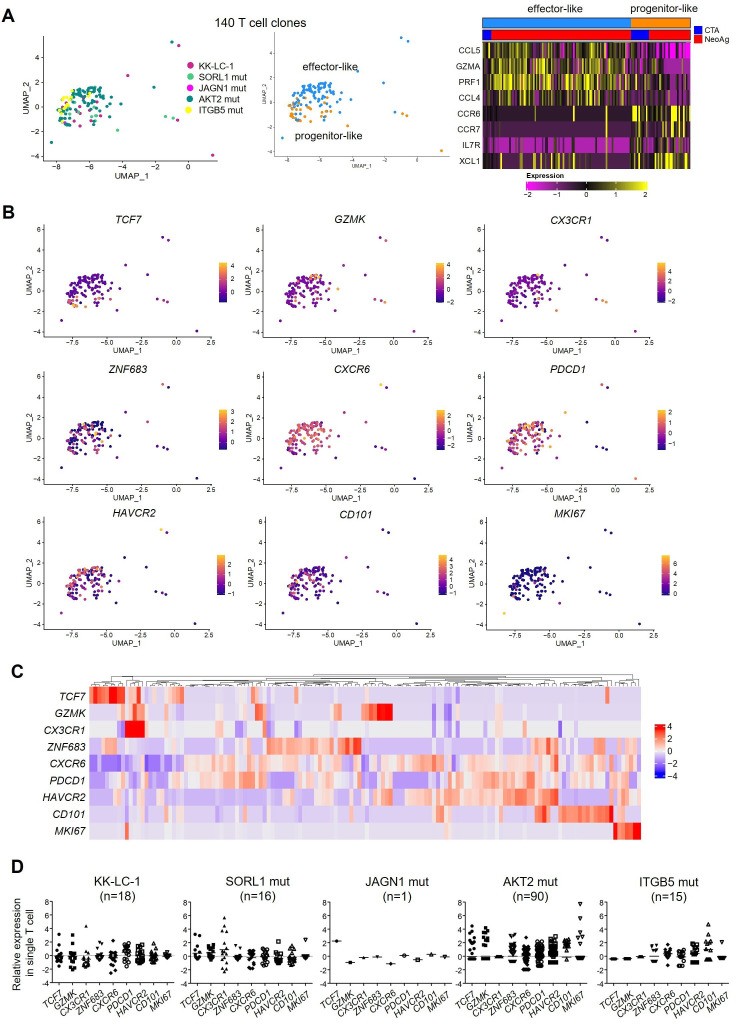
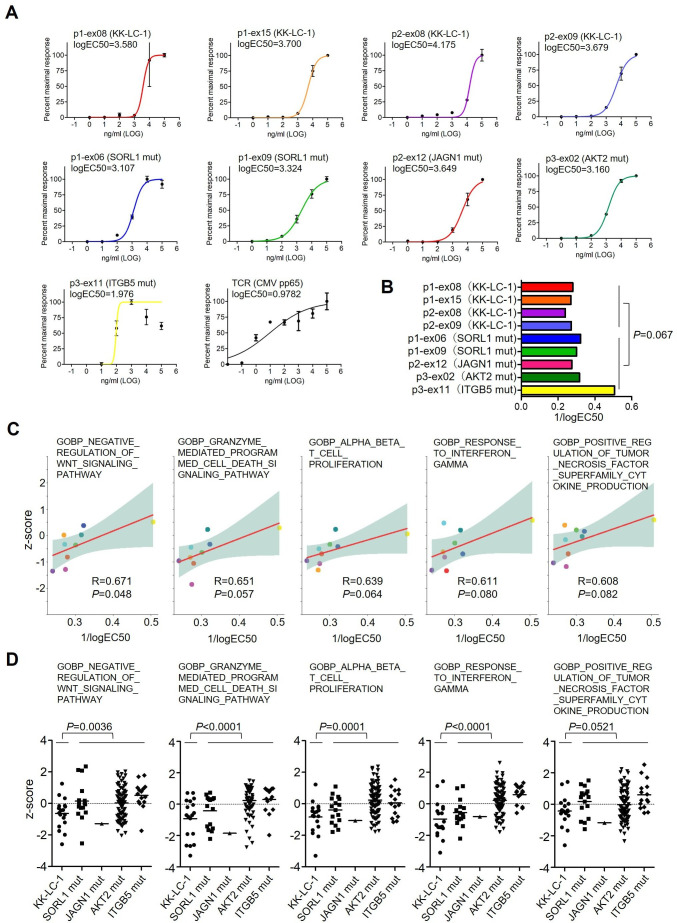
Results: A total of 6998 CD8+ T cells was analyzed, divided into 10 clusters according to their gene expression profile. An exhausted T-cell (exhausted T (Tex)) cluster characterized by the expression of ENTPD1 (CD39), TOX, PDCD1 (PD1), HAVCR2 (TIM3) and other genes, and by T-cell oligoclonality, was identified. The Tex TCR repertoire (Tex-TCRs) contained nine different TCR clonotypes recognizing five tumor antigens including a KK-LC-1 antigen and four neoantigens. By re-clustering the tumor antigen-specific T cells (n=140), it could be seen that the individual T-cell clonotypes were present on cells at different stages of differentiation and functional states even within the same Tex cluster. Stimulating these T cells with predicted cognate peptide indicated that TCR signal strength and subsequent T-cell proliferation and cytokine production was variable but always higher for neoantigens than KK-LC-1.

Conclusions: Our approach focusing on T cells with an exhausted phenotype among CD8+ TILs may facilitate the identification of tumor antigens and clarify the nature of the antigen-specific T cells to specify the promising immunotherapeutic targets in patients with NSCLC.

Keywords: Antigens, Neoplasm; CD8-Positive T-Lymphocytes; Lymphocytes, Tumor-Infiltrating; Non-Small Cell Lung Cancer.


Conflict of interest statement

Competing interests: This study was partly funded by NEC Corporation.

Figures

Figure 1
Figure 1
Phenotypic clustering of CD8+ TILs by single-cell RNA sequencing. (A) Overall scheme of this study. (B) The Uniform Manifold Approximation and Projection (UMAP) of the expression profiles of the 6998 single CD8+ T cells derived from the three surgical lung tumor tissues. CD8+ T cells are classified into 10 distinct transcriptional clusters. (C) UMAPs of CD8+ T cells in each patient. (D) Pie charts showing the proportions of CD8+ T cells in each cluster for all three samples and each patient separately. (E) Pseudotime trajectory analysis of 6998 CD8+ T cells. Each dot represents one single cell and each cell with a pseudotime score from dark blue to yellow, indicating early and terminal states, respectively. (F) The normalized average expression of phenotypic and functional signatures for CD8+ T cells subpopulations defined in B. (G) Violin plots quantifying relative transcriptional expression of genes (rows) with high differential expression among each cluster (columns). (H) Relative expression of the top five most differentially expressed genes in each cluster. NK, natural killer; scRNA-seq, single cell RNA sequencing; scCR-seq, single cell TCR sequencing; Tact, activated T; TCR, T-cell receptor; Tem, effector memory T; Tex, exhausted T; Tm, memory T; Tn, naive T; Tprol, proliferating T; Teff, effector like T; Tgd, γδ-like T; Tapop, apoptotic T; WES, whole exome sequencing.
Figure 2
Figure 2
TCR repertoire analysis in each CD8+ T-cell cluster. (A) The number of unique clonotypes (upper) and the fraction of T cells that express distinct complementarity-determining region 3β (number of clonotypes/number of clones) (lower) in each cluster in all patients (left) and in each patient (right). (B) Shannon Diversity Indexes in 10 clusters. (C) The rate of overlapping clonotypes among different clusters. Tact, activated T; TCR, T-cell receptor; Tem, effector memory T; Tex, exhausted T; Tm, memory T; Tn, naive T; Tprol, proliferating T; Teff, effector like T; Tgd, γδ-like T; Tapop, apoptotic T.
Figure 3
Figure 3
Identification of tumor antigens recognized by CD8+ T cells. (A) The specificity of 70 TCRs from all 10 clusters for 41 predicted neoantigen peptides and 14 KK-LC-1 peptides tested by screening patient 1. All TCR clonotypes with more than one clone in each cluster were selected for testing. TCR TAP fragment/luciferase-transduced Jurkat (TCR TAP/luc-Jurkat) cells were co-cultured with autologous B-cell antigen presenting cells and pooled antigenic peptides (5–8 peptides/pool). Activation of TCR signaling was assessed by luciferase reporter assay driven by the NFAT-response element. (B) Individual peptides in positive pools 6, 7 and 9 were subsequently tested separately by further luciferase reporter assay. (C) In patient 2, the top 10 TCRs in descending order of frequency plus 5 TCR with one clone from the Tex cluster were tested against 14 predicted neoantigen peptides and 26 KK-LC-1 peptides. (D) The individual peptides in the positive pools were subsequently tested separately. (E) In patient 3, the top 15 TCRs from the Tex cluster were tested against 30 predicted neoantigen peptides. (F) The individual peptides in the positive pools were subsequently tested separately. (G) All identified TCR clones (n=140) with the nine tumor-antigen specific TCRs in three patients were projected onto UMAPs. UMAP, Uniform Manifold Approximation and Projection; TAP, Transcriptionally Active Polymerase Chain Reaction; TCR, T-cell receptor; Tex, exhausted T; RLU, relative light unit.
Figure 4
Figure 4
Gene expression analysis of CD8+ T cells against neoantigens, CTA or viral antigens. (A) UMAPs of the distribution of virus antigen-specific TCRs from three cases. Data on complementarity-determining region 3β and VDJ from TCRs specific for common viruses (CMV, EBV and influenza A) were downloaded from VDJdb (vdjdb.cdr3.net, accessed 12/11/2020). A total of 19 TCRs specific for viruses (online supplemental table S7) were back projected onto UMAPs. (B) Analysis of genes differentially expressed between tumor antigen-specific and virus-specific T cells. (C) UMAPs of the distribution of KK-LC-1 and neoantigen specific TCRs from three cases. (D) Analysis of genes differentially expressed between KK-LC-1- and neoantigen-specific T cells. (E) Gene Set Enrichment Analysis of T cells specific for KK-LC-1 or neoantigens. CTA, cancer/testis antigens; UMAP, Uniform Manifold Approximation and Projection; TCR, T-cell receptor; CMV, cytomegalovirus; EBV, Epstein-Barr virus.
Figure 5
Figure 5
Differentiation and functional states of tumor antigen-specific CD8+ T cells. (A) Re-clustering of 140 antigen-specific T cells and UMAPs showing two different phenotypic clusters. The distribution of T-cell receptor against different tumor antigens (CTA or neoantigen) in each cluster is shown. (B) UMAPs of T-cell subset-defining genes. (C) Hierarchical clustering showing the log-normalized expression of T-cell subset-defining genes in individual T-cell clones (n=140). (D) The expression of T-cell subset-defining genes in each tumor antigen-specific T cell. CTA, cancer/testis antigens; UMAP, Uniform Manifold Approximation and Projection.
Figure 6
Figure 6
TCR signal strengths and their relation to T-cell differentiation and function. (A) Assessment of the functional avidity of nine Jurkat-TCR cells. The cells were co-cultured with autologous B-cell antigen presenting cells pulsed with different concentrations of antigenic peptides. Jurkat-TCR cells specific for CMV pp65 were used as a high affinity TCR T-cell control. (B) Summary of the 1/logEC50 values for nine tumor antigen-specific T cells. (C) Correlations between TCR signal strengths (1/logEC50) and the mean value of z-scores for each tumor antigen-specific TCR clonotype for GOBP gene signatures related to cell signaling, cytotoxicity, proliferation, response to cytokine and cytokine production. (D) The z-scores of each clone in GOBP gene sets in C plotted according to the tumor antigen-specificity. TCR, T-cell receptor; CMV, cytomegalovirus: GOBP, Gene Ontology Biological Process.

References

    1. Barta JA, Powell CA, Wisnivesky JP. Global epidemiology of lung cancer. Ann Glob Health 2019;85:8. 10.5334/aogh.2419 - DOI - PMC - PubMed
    1. Thai AA, Solomon BJ, Sequist LV, et al. Lung cancer. Lancet 2021;398:535–54. 10.1016/S0140-6736(21)00312-3 - DOI - PubMed
    1. Doroshow DB, Sanmamed MF, Hastings K, et al. Immunotherapy in non-small cell lung cancer: facts and hopes. Clin Cancer Res 2019;25:4592–602. 10.1158/1078-0432.CCR-18-1538 - DOI - PMC - PubMed
    1. Borghaei H, Paz-Ares L, Horn L, et al. Nivolumab versus Docetaxel in advanced Nonsquamous non-small-cell lung cancer. N Engl J Med 2015;373:1627–39. 10.1056/NEJMoa1507643 - DOI - PMC - PubMed
    1. Borghaei H, Paz-Ares L, Horn L, et al. Nivolumab versus Docetaxel in advanced squamous-cell non-small-cell lung cancer. N Engl J Med 2015;373:1627–39. 10.1056/NEJMoa1507643 - DOI - PMC - PubMed

Publication types

Substances