. 2023 Oct;10(28):e2301855.
doi: 10.1002/advs.202301855. Epub 2023 Aug 6.

IFI27 Integrates Succinate and Fatty Acid Oxidation to Promote Adipocyte Thermogenic Adaption

Affiliations

IFI27 Integrates Succinate and Fatty Acid Oxidation to Promote Adipocyte Thermogenic Adaption

Xuan Cui et al. Adv Sci (Weinh). 2023 Oct.

Abstract

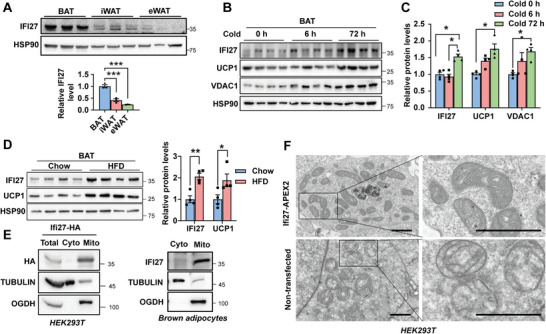
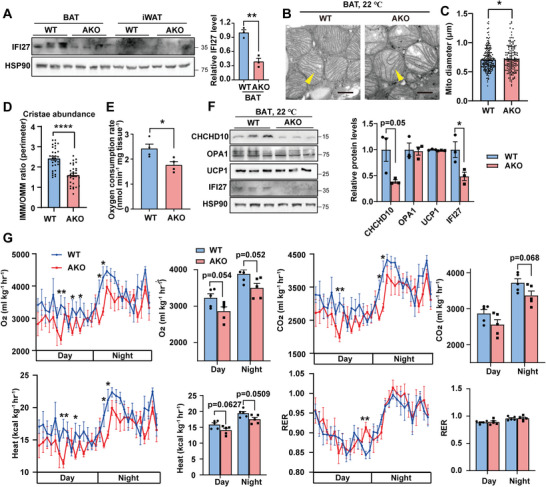
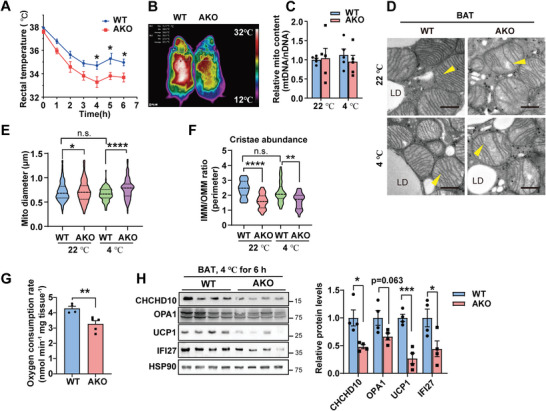
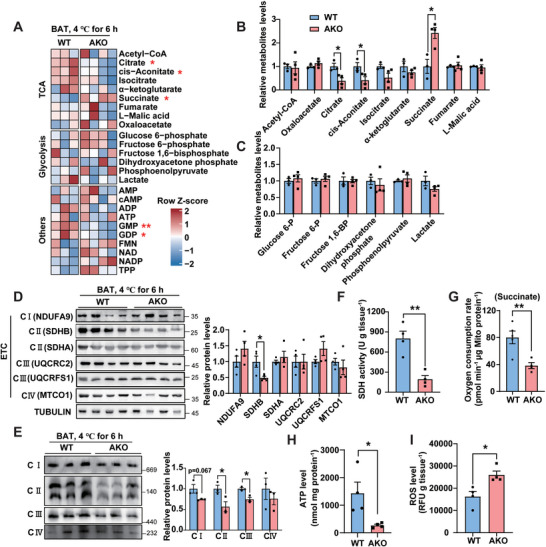
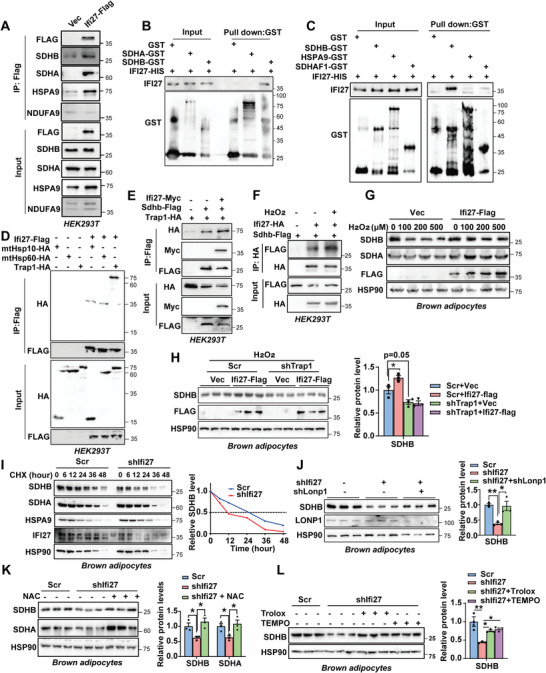
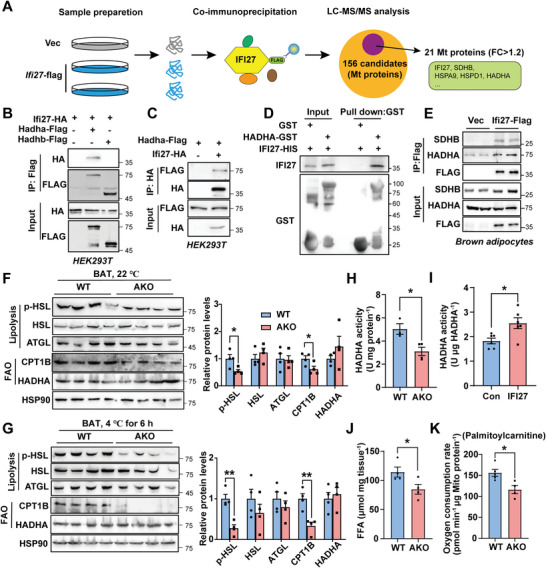
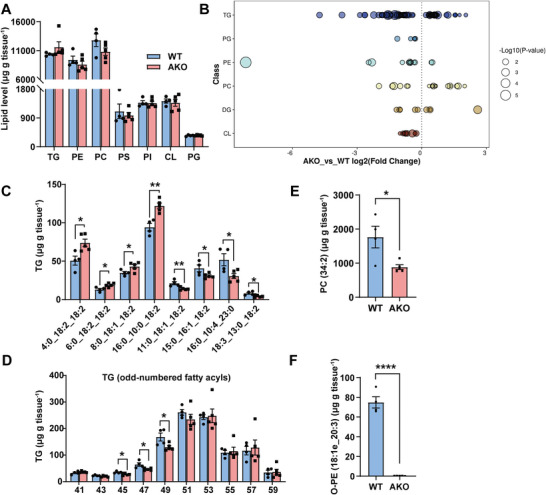
Mitochondria are the pivot organelles to control metabolism and energy homeostasis. The capacity of mitochondrial metabolic adaptions to cold stress is essential for adipocyte thermogenesis. How brown adipocytes keep mitochondrial fitness upon a challenge of cold-induced oxidative stress has not been well characterized. This manuscript shows that IFI27 plays an important role in cristae morphogenesis, keeping intact succinate dehydrogenase (SDH) function and active fatty acid oxidation to sustain thermogenesis in brown adipocytes. IFI27 protein interaction map identifies SDHB and HADHA as its binding partners. IFI27 physically links SDHB to chaperone TNF receptor associated protein 1 (TRAP1), which shields SDHB from oxidative damage-triggered degradation. Moreover, IFI27 increases hydroxyacyl-CoA dehydrogenase trifunctional multienzyme complex subunit alpha (HADHA) catalytic activity in β-oxidation pathway. The reduced SDH level and fatty acid oxidation in Ifi27-knockout brown fat results in impaired oxygen consumption and defective thermogenesis. Thus, IFI27 is a novel regulator of mitochondrial metabolism and thermogenesis.

Keywords: IFI27; brown adipocyte; metabolic adaption; mitochondria; thermogenesis.


Conflict of interest statement

The authors declare no conflict of interest.

Figures

Figure 1
Figure 1
IFI27 localizes to BAT mitochondrial matrix. A) Western blot analysis of IFI27 protein and its quantification (bottom) in brown and white adipose tissues of C57BL/6 mice. n = 3 each group. B) IFI27 level in BAT after cold challenge for indicated time. n = 4 each group. C) Quantification of protein levels in (B). n = 4 each group. D) Western blot analysis of indicated protein and their quantification in BATs of mice fed on a high fat diet (HFD) for 11 weeks. n = 4 each group. E) Western blot analysis of IFI27 in HEK293T (left) and brown adipocytes (right). A plasmid expressing Ifi27‐HA was transfected into HEK293T cells. Immortalized brown preadipocytes were differentiated into mature adipocytes. Mitochondria were separated from the cytosol fraction and subject to western blot with indicated antibodies. The experiment was repeated for three times. F) Transmission electron microscope (TEM) analysis of the localization of IFI27‐APEX2. The region inside the black box was enlarged for clearer view. Scale bar: 1 µm. For statistical analyses, one‐way ANOVA analysis of variance and Tukey's post hoc tests were performed in (A), two‐way ANOVA analysis of variance and Tukey's post hoc tests were performed in (C), and two‐tailed unpaired Student's t‐test was performed in (D). The data shown are mean ± SEM. *p < 0.05; **p < 0.01; *p < 0.001.
Figure 2
Figure 2
AKO mice possess remarkably decreased mitochondrial cristae. A) Western blot analysis of the IFI27 protein and its quantification in fat tissues of the WT and AKO mice. n = 3 each genotype. B) TEM illustrated mitochondrial structure in BAT of the WT and AKO mice. Yellow arrowheads indicate mitochondrial cristae. Scale bar: 500 nm. C,D) Mitochondrial diameter (C) and cristae abundance (D) in BAT of the WT and AKO mice. Diameter was determined by measuring 100 mitochondria in TEM images. Cristae abundance was shown as the perimeter ratio of inner to outer mitochondrial membranes (n = 30 each group). E) BAT oxygen consumption rate was measured by Clark‐type oxygen electrodes. n = 4 each genotype. F) Western blot analysis of the indicated proteins and their quantification in BAT of WT and AKO mice. n = 3 each genotype. G) Metabolic cage analyses for WT and AKO mice. Oxygen consumption, carbon dioxide production, heat production and respiratory exchange ratio (RER) were measured. n = 5 each genotype, 8‐week‐old male mice. For statistical analyses, two‐tailed unpaired Student's t‐test was performed. The data shown are mean ± SEM. *p < 0.05; **p < 0.01; ****p < 0.0001.
Figure 3
Figure 3
Ifi27 knockout mice are cold intolerant. A) Rectal temperature of the WT and AKO mice at 4 °C without food supply. n = 5 each genotype, 8‐week‐old male mice. B) Mice were subjected to 4 °C for 6 h without food supply. Dorsal skin temperature was measured by an infrared camera. C) BAT mitochondrial content was determined by measuring mitochondrial DNA level. Mice were kept at 22 or 4 °C for 6 h. n = 4–5 each genotype. D) TEM analysis of BAT mitochondrial structure for mice at 22 or 4 °C for 6 h. Yellow arrowheads indicated mitochondrial cristae. LD: lipid droplet. Scale bar: 500 nm. E,F) Quantification of mitochondrial diameter (E) and the cristae abundance (F) in TEM images. n = 100 mitochondria each group in (E), and n = 30 each group in (F). n.s: not significant. G,H) Mice were exposed to 4 °C for 6 h. BAT oxygen consumption rate (G) and western blot analysis of the indicated proteins and their quantification (H) were shown. n = 4–5 each genotype. For statistical analyses, two‐way ANOVA analysis of variance and Bonferroni's post hoc tests were performed in (A), and unpaired two‐tailed Student's t‐tests were performed in (E–H). The data shown are mean ± SEM. *p < 0.05; **p < 0.01; ****p < 0.0001.
Figure 4
Figure 4
IFI27 ablation elicits succinate accumulation in BAT due to a decrease in SDHB level. A) Heat map of metabolomics analysis in BAT. Mice were challenged at 4 °C for 6 h. n = 3–4 each genotype, 12‐week‐old female mice. B) The relative level of TCA metabolites in BAT measured by LC‐MS/MS assay. n = 3–4 each genotype. C) The relative level of glycolysis‐related metabolites in BAT measured by LC‐MS/MS assay. n = 3–4 each genotype. D) Western blot analysis of ETC‐related proteins and their quantification in BAT of mice after 6 h cold exposure. n = 4 each genotype. E) Mice were treated as in (A). BAT mitochondria were isolated and underwent blue native‐PAGE analysis. Right panel showed the quantification of respiratory complexes. n = 3 each genotype. F–I) Mice were treated as in (A). SDH activity (F), mitochondrial oxygen consumption rate with succinate as substrates (G), ATP (H) and ROS (I) levels were determined in BAT. n = 4–5 each genotype. For statistical analyses, unpaired two‐tailed Student's t‐tests were performed. The data shown are mean ± SEM. *p < 0.05; **p < 0.01.
Figure 5
Figure 5
IFI27 serves as an adaptor to link SDHB to TRAP1. A) Immunoprecipitation and western blot analysis of the indicated proteins in the HEK293T cells transfected with Ifi27Flag. B,C) GST pull‐down assays followed by western blot showed IFI27 interacted with SDHB directly. D,E) Plasmids as indicated were transfected into HEK293T cells. Immunoprecipitation was performed 48 h after transfection followed by western blot analysis. The experiment was repeated for three times. F) SDHB and IFI27 were ectopically expressed in HEK293T cells by plasmid transfection. Hydrogen peroxide (100 µm) treated cells for 6 h followed by immunoprecipitation with HA antibody. The experiment was repeated for three times. G) Immortalized brown preadipocytes expressing Ifi27‐Flag differentiated into mature adipocytes. Hydrogen peroxide treated adipocytes for 12 h followed by western blot analysis. H) Lentivirus expressing IFI27‐Flag or vector transduced Trap1 knockdown adipocytes on differentiation day 2 and day 4. Hydrogen peroxide (100 µm) treated cells for 12 h followed by western blot analysis on day 6. The right panel showed the SDHB protein quantification. n = 3 each group. I) Lentiviral shRNA against Ifi27 transduced preadipocytes followed by induction to mature adipocytes. Cycloheximide (CHX) treated the cells for indicated time and western blot analyzed the protein levels (left). Right, quantification of the SDHB level over time. The experiment was repeated for three times. J) Ifi27 knockdown preadipocytes differentiated to day 3. Then Lonp1 was knocked down by transducing lentivirus shRNAs. The SDHB and LONP1 levels were detected by western blot on day 6. Right, quantification of the SDHB level. n = 3 each group. K,L) Western blot analysis and the quantification of indicated proteins in Ifi27‐knockdown brown adipocytes. N‐acetyl‐L‐cysteine (NAC 2 mm) (K), Trolox (100 µm) or TEMPO (25 µm) (L) treated the cells during differentiation. n = 3 each group. For statistical analyses, one‐way ANOVA analysis of variance and Tukey's post hoc tests were performed in (H, J–L). The data shown are mean ± SEM. *p < 0.05; **p < 0.01.
Figure 6
Figure 6
IFI27 binding to HADHA enhances HADHA catalytic activities. A) Schematic of the IFI27 interaction discovery. B,C) Plasmids as indicated were transfected into HEK293T cells. Immunoprecipitation was performed 48 h after transfection followed by western blot analysis. D) GST pull‐down assays following by western blot showed IFI27 interacted with HADHA directly. E) Ifi27‐Flag lentivirus transduced brown preadipocytes followed by differentiation into adipocytes. Flag antibody was used for immunoprecipitation and western blot with indicated antibodies was performed. F,G) Western blot analysis detected levels of the indicated proteins in BAT of the WT and AKO mice at 22 (F) and 4 °C for 6h (G). The right panels showed the protein quantification. n = 4 each genotype. H) The dehydrogenase activity of HADHA in BAT of the WT and AKO mice at 4 °C. I) Purified GST‐HADHA dehydrogenase activity was measured in vitro in the presence or absence of IFI27 protein. J) Quantification of free fatty acids in BAT of the WT and AKO mice after 4 °C exposure for 6 h. n = 4 each genotype. K) Oxygen consumption rate of BAT mitochondria with palmitoylcarnitine and malate as substrates. The mitochondria were isolated from cold‐exposed mice BAT. n = 4–5 each genotype. For statistical analyses, unpaired two‐tailed Student's t‐tests were performed. The data shown are mean ± SEM. *p < 0.05; **p < 0.01.
Figure 7
Figure 7
The alteration in molecular species of lipids in the AKO mice BAT. A) Lipidomic analysis of BAT isolated from WT and AKO mice raised at 22 °C. The overall amount of triglycerides and phospholipids was quantified as µg g−1 tissue. WT n = 4, AKO n = 5. TG: triglyceride; PE: phosphatidylethanolamine; PC: phosphatidylcholine; PS: phosphatidylserine; PI: phosphatidylinositol; CL: cardiolipin; PG: phosphatidylglycerol. B) Log2 fold changes in lipid species (AKO versus WT mice, p < 0.05). DG: diglyceride. C) The content of the indicated triglyceride species in BAT of WT (n = 4) and AKO (n = 5) mice. D) The content of the major triglyceride species with odd‐numbered acyl chains. WT n = 4, AKO n = 5. E) The content of the individual PC (34:2) in BAT of WT (n = 4) and AKO (n = 5) mice. F) The content of the individual ether PE (18:1e_20:3) in BAT of WT (n = 4) and AKO (n = 5) mice. For statistical analyses, unpaired two‐tailed Student's t‐tests were performed. The data shown are mean ± SEM. *p < 0.05; **p < 0.01; ****p < 0.0001.

References

    1. Forner F., Kumar C., Luber C. A., Fromme T., Klingenspor M., Mann M., Cell Metab. 2009, 10, 324. - PubMed
    1. Chouchani E. T., Kajimura S., Nat. Metab. 2019, 1, 189. - PMC - PubMed
    1. Bennett C. F., Latorre‐Muro P., Puigserver P., Nat. Rev. Mol. Cell Biol. 2022, 23, 817. - PMC - PubMed
    1. Jin W., Jin W., Pan D., Biochem. Biophys. Res. Commun. 2018, 501, 273. - PubMed
    1. Parker N., Porter A. C., BMC Genomics 2004, 5, 8. - PMC - PubMed

Publication types

MeSH terms