. 2023 Oct;10(28):e2302130.
doi: 10.1002/advs.202302130. Epub 2023 Aug 6.

Palmitoyltransferase ZDHHC3 Aggravates Nonalcoholic Steatohepatitis by Targeting S-Palmitoylated IRHOM2

Affiliations

Palmitoyltransferase ZDHHC3 Aggravates Nonalcoholic Steatohepatitis by Targeting S-Palmitoylated IRHOM2

Minxuan Xu et al. Adv Sci (Weinh). 2023 Oct.

Erratum in

Abstract

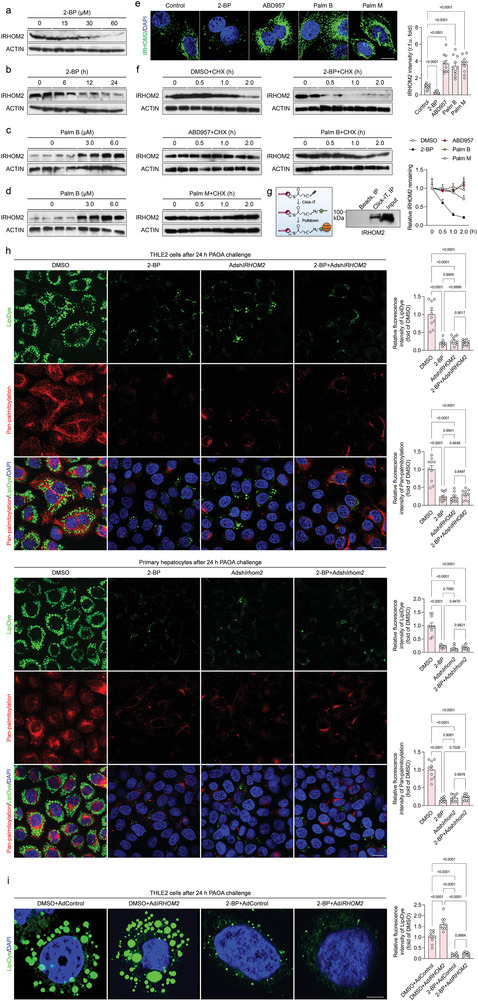
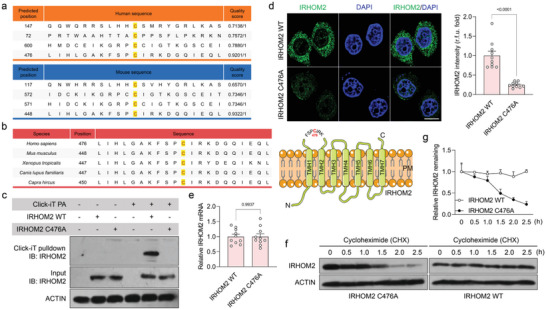
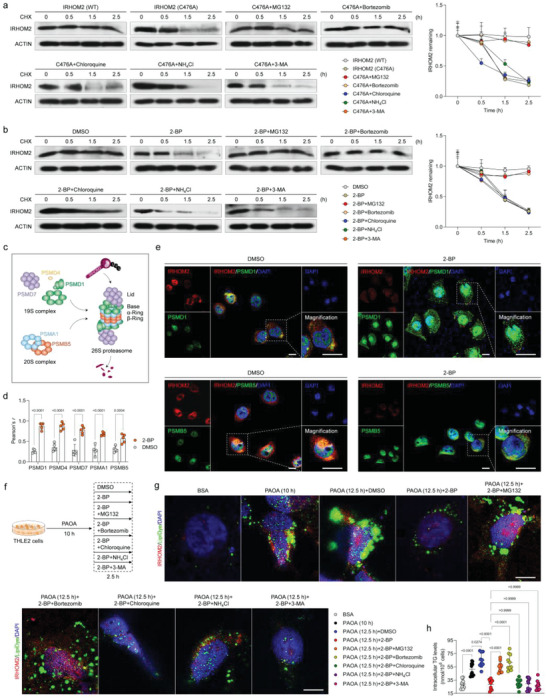
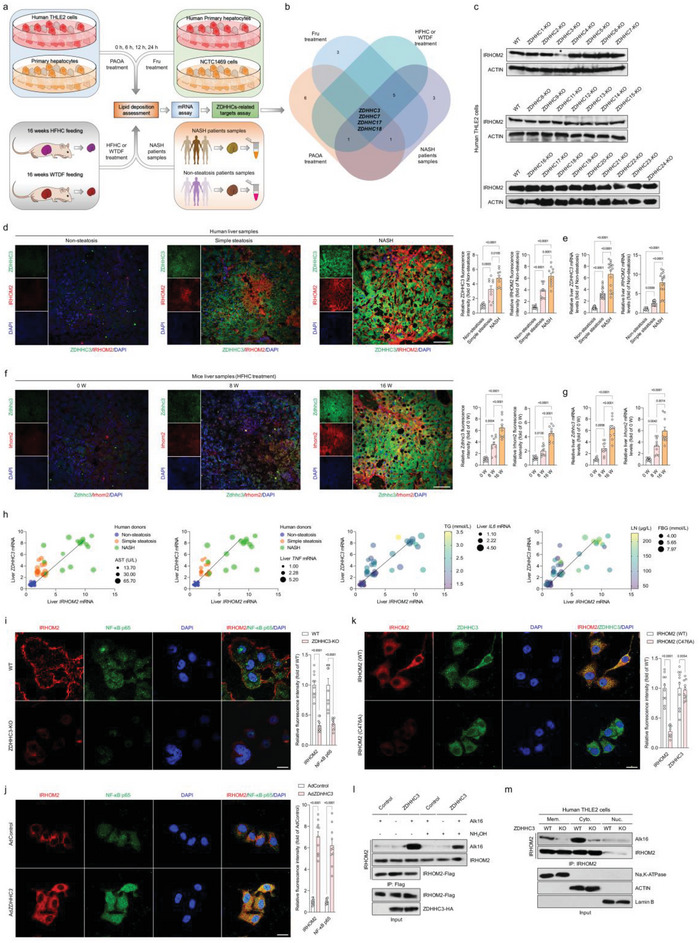
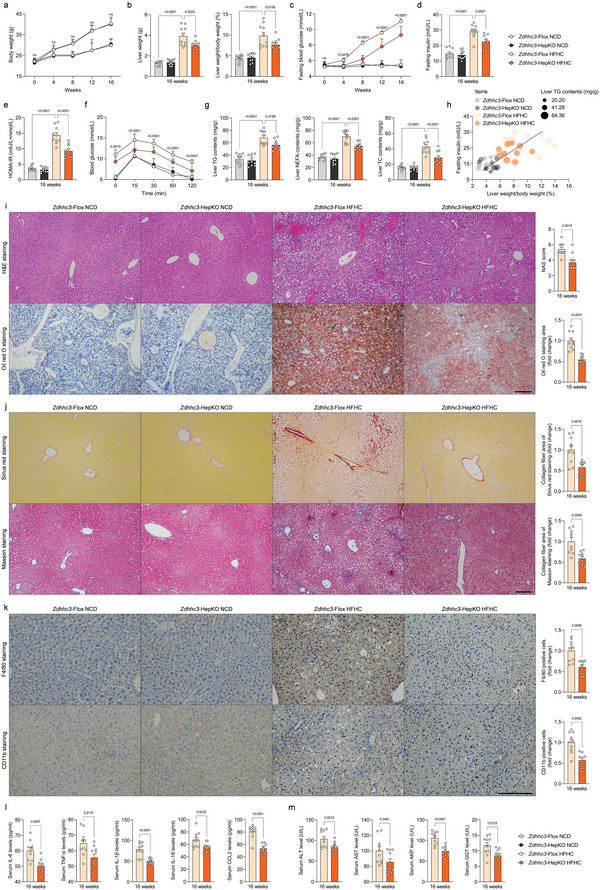
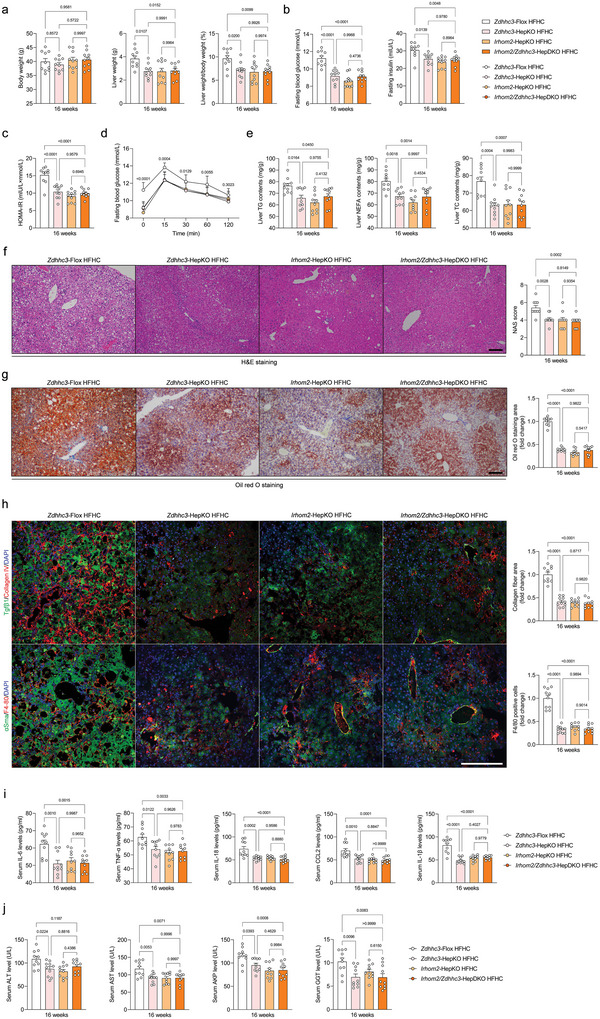
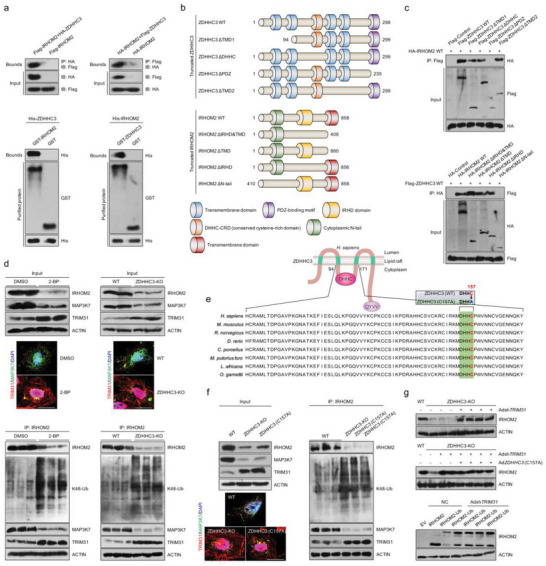
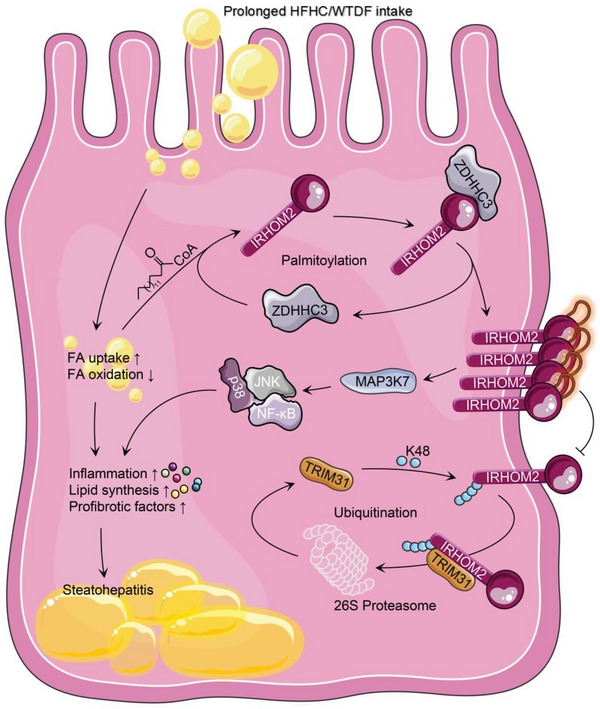
Underestimation of the complexity of pathogenesis in nonalcoholic steatohepatitis (NASH) significantly encumbers development of new drugs and targeted therapy strategies. Inactive rhomboid protein 2 (IRHOM2) has a multifunctional role in regulating inflammation, cell survival, and immunoreaction. Although cytokines and chemokines promote IRHOM2 trafficking or cooperate with partner factors by phosphorylation or ubiquitin ligases-mediated ubiquitination to perform physiological process, it remains unknown whether other regulators induce IRHOM2 activation via different mechanisms in NASH progression. Here the authors find that IRHOM2 is post-translationally S-palmitoylated at C476 in iRhom homology domain (IRHD), which facilitates its cytomembrane translocation and stabilization. Fatty-acids challenge can directly promote IRHOM2 trafficking by increasing its palmitoylation. Additionally, the authors identify Zinc finger DHHC-type palmitoyltransferase 3 (ZDHHC3) as a key acetyltransferase required for the IRHOM2 palmitoylation. Fatty-acids administration enhances IRHOM2 palmitoylation by increasing the direct association between ZDHHC3 and IRHOM2, which is catalyzed by the DHHC (C157) domain of ZDHHC3. Meanwhile, a metabolic stresses-triggered increase of ZDHHC3 maintains palmitoylated IRHOM2 accumulation by blocking its ubiquitination, consequently suppressing its ubiquitin-proteasome-related degradation mediated by tripartite motif containing 31 (TRIM31). High-levels of ZDHHC3 protein abundance positively correlate with the severity of NASH phenotype in patient samples. Hepatocyte-specific dysfunction of ZDHHC3 significantly inhibits palmitoylated IRHOM2 deposition, therefore suppressing the fatty-acids-mediated hepatosteatosis and inflammation in vitro, as well as NASH pathological phenotype induced by two different high-energy diets (HFHC & WTDF) in the in vivo rodent and rabbit model. Inversely, specific restoration of ZDHHC3 in hepatocytes markedly provides acceleration over the course of NASH development via increasing palmitoylation of IRHOM2 along with suppression of ubiquitin degradation. The current work uncovers that ZDHHC3-induced palmitoylation is a novel regulatory mechanism and signal that regulates IRHOM2 trafficking, which confers evidence associating the regulation of palmitoylation with NASH progression.

Keywords: Palmitoylation; hepatosteatosis; inactive rhomboid protein 2 (IRHOM2); nonalcoholic steatohepatitis (NASH); tripartite motif containing 31 (TRIM31); zinc finger DHHC-type palmitoyltransferase 3 (ZDHHC3).


Conflict of interest statement

The authors declare no conflict of interest.

Figures

Figure 1
Figure 1
Identification of palmitoylated‐modificated IRHOM2 in hepatocytes. a) Human hepatocyte THLE2 cells were incubated with a gradually increasing dose of 2‐bromopalmitate (2‐BP) for 24 h, and subjected to immunoblotting detection with IRHOM2 and ACTIN antibodies (n = 4 per group). b) THLE2 cells were treated with 60 µM 2‐BP for 0, 6, 12, and 24 h and then subjected to immunoblotting assay with IRHOM2 and ACTIN antibodies (n = 4 per group). c, d) THLE2 cells (c) and primary human hepatocyte, PHH (d) were incubated with 0, 3, or 6 µM palmostatin B (Palm B), an inhibitor of depalmitoylase enzymes, for 24 h, and subjected to immunoblotting analysis with IRHOM2 and ACTIN antibodies (n = 4 per group). e) THLE2 cells were treated with 60 µM 2‐BP, 1 µM ABD957, 6 µM Palm B, and 10 µM palmostatin M (Palm M) for 24 h, respectively. Left, the fixed sections were subjected to immunofluorescent staining with IRHOM2 (green) and DAPI (blue). Right, the bar graph shows IRHOM2 fluorescence intensity in the indicated group (n = 10 images per group; P < 0.05 versus Control). Scale bars, 10 µm. f) THLE2 cells were preincubated with DMSO, 2‐BP, ABD957, Palm B, or Palm M as a baseline, then treated with cycloheximide (CHX) in the time‐course frame, respectively. The collected cell lysates were subjected to immunoblotting detection with IRHOM2 and ACTIN antibodies. The right curve graph shows the relative IRHOM2 remaining ratio in the indicated time point (n = 4 per group). g) Sketch map of the Click‐iT assay used for IRHOM2 palmitoylation analysis. THLE2 cells were incubated with 120 µM Click‐iT palmitic acid‐Azides for 8 h, and corresponding collected lysates were subjected to Click‐iT detection in accordance with product instruction, followed by western blotting analysis with IRHOM2 antibody. The right western blotting bands show the IRHOM2 expression in the indicated group. h, Representative images of immunofluorescent staining showing the lipid droplets formation and deposition (LipiDye, green) and universal palmitoylation levels (red) in THLE2 cells (upper) and mouse primary hepatocytes (lower) after transfection with indicated vectors in response to PAOA treatment for 24 h (n = 10 images per group; P < 0.05 versus DMSO). Scale bars, 5 µm. i) Representative images of immunofluorescent staining showing the lipid droplets formation and accumulation (LipiDye, green) in AdIRHOM2‐ or 2‐BP‐treated THLE2 cells after 24 h PAOA challenge (n = 10 images per group; P < 0.05 versus DMSO). Scale bars, 10 µm. Data are expressed as mean ± SEM. The relevant experiments presented in this part were performed independently at least three times. Significance is determined by one‐way analysis of variance (ANOVA) followed by Dunnett's multiple comparisons test analysis (e, h, i). The P‐value < 0.05 was considered as significant difference.
Figure 2
Figure 2
Identification of the palmitoylation site on IRHOM2 at evolutionarily conserved cysteine residues. a) Predicted position of palmitoylation site on IRHOM2 in Homo sapiens (upper) and Mus musculus (lower) using GPS‐Palm software (MacOS_20 200 219) (The CUCKOO Workgroup, http://gpspalm.biocuckoo.cn/), and MDD‐Palm algorithm (http://csb.cse.yzu.edu.tw/MDDPalm/). b) Left, palmitoylation site of IRHOM2 with conserved cysteine residues in Homo sapiens, Mus musculus, Xenopus tropicalis, Canis lupus familiaris, and Capra hircus. Right, schematic diagram showing the IRHOM2 wild‐type (WT) structure of Homo sapiens and possible palmitoylation site. c) THLE2 cells with IRHOM2 WT or IRHOM2 C476A mutant overexpression were incubated with Click‐iT palmitic acid‐Azides for 8 h, and corresponding collected lysates were subjected to Click‐iT detection in accordance with product instruction. The palmitoylated proteins were placed onto the pull‐down detection by streptavidin‐sepharose bead conjugate, followed by western blotting analysis with IRHOM2 and ACTIN antibodies. The palmitoylation of IRHOM2 WT was observed in top gel, lane 5, but not for the IRHOM2 C476A in top gel, lane 6, or control groups. This experiment was repeated 3 times independently. d) THLE2 cells were overexpressed with IRHOM2 WT or IRHOM2 C476A mutant, respectively. Left, the fixed sections were subjected to immunofluorescent staining with IRHOM2 (green) and DAPI (blue). Right, the bar graph shows IRHOM2 fluorescence intensity in the indicated group (n = 10 images per group; P < 0.05 versus IRHOM2 WT). Scale bars, 10 µm. e) qPCR analysis showing the IRHOM2 mRNA levels in IRHOM2 WT or IRHOM2 C476A mutant (n = 10 per group; P < 0.05 versus IRHOM2 WT). f, g) THLE2 cells with IRHOM2 WT or IRHOM2 C476A mutant overexpression were incubated with CHX in a time‐course frame, respectively. The collected cell lysates were subjected to immunoblotting detection with IRHOM2 and ACTIN antibodies (f). The curve graph (g) shows the relative IRHOM2 remaining ratio in the indicated time point (n = 4 per group). Data are expressed as mean ± SEM. The relevant experiments presented in this part were performed independently at least three times. Significance determined by 2‐sided Student's t‐test (d, e). The P‐value < 0.05 was considered as significant difference.
Figure 3
Figure 3
Palmitoylated IRHOM2 increases its endogenous retention by restraining proteasome signals. a) The THLE2 cells were transfected with IRHOM2 or IRHOM2 C476A mutant overexpression, followed by detection of IRHOM2 degradation under time‐gradient CHX treatment, in the presence of proteasome inhibitor (MG132, bortezomib), lysosome inhibitor (chloroquine, NH4Cl) or autophagy inhibitor (3‐MA). The right curve graph showing the relative IRHOM2 remaining ratio in the indicated time point (n = 4 per group). b) Time‐gradient CHX treatment detection showing the effects of 2‐BP on IRHOM2 degradation in THLE2 cells with/without different inhibitors. The right curve graph showing the relative IRHOM2 remaining level in the indicated time point (n = 4 per group). c) Sketch map showing the structure of the 26S proteasome and corresponding representative markers PSMD1, PSMD4 and PSMD7 for 19S complex, and PSMA1 and PSMB5 for 20S complex. d) Statistical data of the colocalization of IRHOM2 and PSMD1, PSMD4, PSMD7, PSMA1 and PSMB5 in THLE2 cells incubated with DMSO or 2‐BP (n = 5 per group; P < 0.05 versus DMSO group). e) Representative immunofluorescence pictures showing the colocalization of ectopically expressed IRHOM2 and specific marker of the assembled proteasome, PSMD1& PSMB5 in THLE2 cells treated with DMSO or 2‐BP. Scale bars, 50 µm. The white arrow indicates colocalization. f) Experimental design outline showing indicated treatment of different inducers in THLE2 cells. g, h) Representative immunofluorescence pictures showing the IRHOM2 expression (red) and lipid droplets formation (green) coexpression (g) in response to different treatments in indicated groups (n = 10 per group; P < 0.05 versus BSA group). Scale bars, 10 µm. The right scatter diagram shows the intracellular triglyceride (TG) contents in indicated groups (h). Data are expressed as mean ± SEM. The relevant experiments presented in this part were performed independently at least three times. Significance is determined by a 2‐sided Student's t‐test (d) or one‐way analysis of variance (ANOVA) followed by Dunnett's multiple comparisons test analysis (h). The P‐value < 0.05 was considered as significant difference.
Figure 4
Figure 4
Hepatocyte IRHOM2 is palmitoylated by palmitoyltransferase ZDHHC3. a) Experimental design showing the protocol of identifying ZDHHCs‐related targets in response to a time‐course of 0.5 mM palmitic acid+1.0 mM oleic acid (PAOA) mixture, 5 mM fructose (Fru) in human THLE2 cells, mouse primary hepatocytes, human primary hepatocytes or 16‐weeks HFHC‐ or WTDF‐fed WT mice or in NASH patients samples. b) Venn diagram showing the Top 4 distinguishable expressed ZDHHC candidates in intersection of PAOA treatment group, HFHC‐/WTDF‐fed mice, Fru treatment group, and NASH patients samples. c) Representative western blotting bands showing the IRHOM2 expression changes in different ZDHHCs‐deleted THLE2 cells. The asterisk indicates the group with the most change among all the candidates (n = 4 per group). d, e) Representative immunofluorescence images of IRHOM2 and ZDHHC3 coexpression in lives of human donors with nonsteatosis phenotype, simple steatosis phenotype, and NASH phenotype with fluorescence intensity evaluation (d) (n = 10 samples per group; P < 0.05 versus nonsteatosis group), and corresponding liver IRHOM2 and ZDHHC3 mRNA expression profiles (e) (n = 10 samples for non‐steatosis phenotype; n = 17 samples for simple steatosis phenotype; n = 16 samples for NASH phenotype; P < 0.05 versus nonsteatosis group). Scale bars, 50 µm. f, g) Representative immunofluorescence images of Irhom2 and Zdhhc3 coexpression in lives of 0–16 weeks HFHC‐fed mice with fluorescence intensity evaluation (f) (n = 10 samples per group; P < 0.05 versus 0 week), and corresponding liver Irhom2 and Zdhhc3 mRNA expression profiles (g) (n = 10 samples; P < 0.05 versus 0 week). Scale bars, 50 µm. h) Pearson multiple correlation analysis for human subjects exhibiting the comprehensive correlation between liver IRHOM2, ZDHHC3 mRNA expression and indicated parameter indexes (n = 49 indices per parameter). i) Representative immunofluorescence images of IRHOM2 and NF‐κB p65 coexpression in THLE2 cells with WT phenotype and ZDHHC3‐KO phenotype and corresponding fluorescence density analysis (n = 10 samples per group; P < 0.05 versus WT group). Scale bars, 50 µm. j) THLE2 cells were transfected with adenovirus‐loading ZDHHC3 overexpression vector (AdZDHHC3), followed by immunofluorescence analysis using IRHOM2 and NF‐κB p65 antibodies. Cells with empty adenovirus (AdControl) transfection served as a control group (n = 10 samples per group; P < 0.05 versus AdControl). Scale bars, 50 µm. k) The THLE2 cells with IRHOM2 WT or IRHOM2 C476A mutant transfection were incubated with IRHOM2 and ZDHHC3 antibodies, and corresponding fixed sections were then subjected to immunofluorescence analysis (n = 10 samples per group; P < 0.05 versus AdControl). Scale bars, 50 µm. l) The THLE2 cells were transfected with IRHOM2‐Flag and ZDHHC3‐HA vectors. Palmitoylated IRHOM2 levels were exhibited using Alk16 labeling in the presence or absence of hydroxylamine (NH2OH) administration. m) The wild‐type THLE2 cells or ZDHHC3‐deficient THLE2 cells were transfected with IRHOM2‐Flag, followed by labelling with Alk16. Subcellular fraction was collected and IRHOM2 protein levels were modulated to confirm that there were equal amount of IRHOM2 in the wild type and knockout cell component for input. Palmitoylated IRHOM2 levels in cell membrane (Mem.), cell cytoplasm (Cyto.), and cell nucleus (Nuc.) components were observed by immunoblotting analysis. Data are expressed as mean ± SEM. The relevant experiments presented in this part were performed independently at least three times. Significance is determined by one‐way analysis of variance (ANOVA) followed by Dunnett's multiple comparisons test analysis (e, g) or 2‐sided Student's t‐test (i‐k). The P‐value < 0.05 was considered as significant difference.
Figure 5
Figure 5
Hepatocyte‐specific loss of Zdhhc3 protects against HFHC‐induced NASH pathogenesis. a‐g) Records for the body weight (a), liver weight and the ratio of liver weight/body weight (%) (LW/BW) (b), fasting blood glucose levels (c), fasting insulin levels (d), HOMA‐IR index (e), glucose tolerance test (GTT) (f) and liver TG, NEFA and TC contents (g) of the HFHC‐fed Zdhhc3‐Flox mice and Zdhhc3‐HepKO mice; NCD diet‐fed mice were treated as corresponding control (n = 10 mice per group; P < 0.05 versus Zdhhc3‐Flox HFHC group). h) Pearson analysis indicating the correlations between fasting insulin, ratio of liver weight/body weight (%), and liver TG contents in indicated groups (n = 10 per parameter; P < 0.001 for all of these correlations). i‐k) Representative pictures of H&E staining, oil red O staining, histological NAS score (i) changes, sirius red staining, masson staining (j), and F4/80 and CD11b positive cells expression (k) in indicated groups (magnification, 100× for H&E staining, oil red O staining, masson staining and sirius red staining; magnification, 200× for F4/80 and CD11b staining; n = 10 images per group; P < 0.05 versus Zdhhc3‐Flox HFHC group). l, Records for inflammation‐related cytokines profiles including IL‐6, TNF‐α, IL‐1β, IL‐18 and CCL2 in serum from HFHC‐fed HepKO or Flox mice (n = 10 mice per group; P < 0.05 versus Zdhhc3‐Flox HFHC group). m, Records for liver function‐related indicators including ALT, AST, AKP, and GGT in serum from HFHC‐fed HepKO or Flox mice (n = 10 mice per group; P < 0.05 versus Zdhhc3‐Flox HFHC group). Data are expressed as mean ± SEM. The relevant experiments presented in this part were performed independently at least three times. Significance is determined by two‐way analysis of variance (ANOVA) followed by multiple comparisons test analysis (a‐g) or 2‐sided Student's t‐test (i‐m). The P‐value < 0.05 was considered as significant difference.
Figure 6
Figure 6
IRHOM2 is required for ZDHHC3 function over the course of NASH pathogenesis. a‐d) Records for body weight, liver weight, and liver weight/body weight ratio (%) (a), fasting blood glucose levels, fasting insulin levels (b), HOMA‐IR index (c), and glucose tolerance test (GTT) analysis (d) of the Zdhhc3‐Flox mice, Zdhhc3‐HepKO mice, Irhom2‐HepKO mice, and Irhom2/Zdhhc3‐HepDKO mice after 16‐weeks HFHC diet challenge (n = 10 mice per group; P < 0.05 versus Zdhhc3‐Flox HFHC group). e) Liver lipid contents including TG, TC, and NEFA in the indicated group (n = 10 mice per group; P < 0.05 versus Zdhhc3‐Flox HFHC group). f,g) Representative pictures of H&E staining (f), Oil red O staining (g), and corresponding NAS score in an indicated group (magnification, 100×; n = 10 images per group for each staining). h) Representative pictures of immunofluorescence analysis of Tgfβ & Collagen IV, and αSma & F4/80 coexpression, respectively (n = 10 images per group; P < 0.05 versus Zdhhc3‐Flox HFHC group). Scale bars, 100 µm. i,j) Records for serum pro‐inflammatory cytokines IL‐6, TNF‐α, IL‐18, CCL2, and IL‐1β contents (i) and liver function indicators including serum ALT, AST, and AKP contents (j) in indicated groups (n = 10 mice per group; P < 0.05 versus Zdhhc3‐Flox HFHC group). Data are expressed as mean ± SEM. The relevant experiments presented in this part were performed independently at least three times. Significance is determined by one‐way analysis of variance (ANOVA) followed by Dunnett's multiple comparisons test analysis. The P‐value < 0.05 was considered as significant difference.
Figure 7
Figure 7
Palmitoylation‐stabilized IRHOM2 suppresses its ubiquitination and TRIM31‐triggered degradation. a) The THLE2 cells were transfected with indicated vectors for following coimmunoprecipitation (Co‐IP) assay. Co‐IP detection of the interaction of IRHOM2 with ZDHHC3 in THLE2 cells transfected with Flag‐IRHOM2 and HA‐ZDHHC3 or HA‐IRHOM2 and Flag‐ZDHHC3 plasmids. Immunoblotting probed with anti‐HA or anti‐Flag antibody (upper). Representative immunoblotting bands for GST precipitation showing ZDHHC3‐IRHOM2 binding by treating purified His‐ZDHHC3 with purified GST‐IRHOM2 or by treating His‐IRHOM2 with purified ZDHHC3‐GST in vitro (lower). Purified GST was regarded as a control. b,c) Schematic of human full‐length and truncated ZDHHC3 and IRHOM2 (b), and representative western blotting mapping assay indicating the interaction domains of ZDHHC3 and IRHOM2 (c). d) IP detection in THLE2 cells showing the effects of palmitoylation inhibitor 2‐BP challenge and ZDHHC3 deficiency on the binding between IRHOM2 and other interested proteins with known function, and representative immunofluorescence images of TRIM31 and MAP3K7 coexpression (upper), and K48‐linked ubiquitination of IRHOM2 (lower) (n = 5 images per group). Scale bars, 10 µm. e) ZDHHC3 structure showing the catalytic activity motif mutant (C157A) of DHHC domain in different species. f) IP detection in THLE2 cells showing the effects of ZDHHC3 knockout and ZDHHC3 with C157A mutant on the binding between IRHOM2 and IRHOM2 downstream signaling factors, i.e., MAP3K7 and TRIM31, and representative immunofluorescence images of TRIM31 and MAP3K7 coexpression (left), and K48‐linked ubiquitination of IRHOM2 (right) (n = 5 images per group). Scale bars, 10 µm. g) Immunoblotting assay showing the involvement of TRIM31 in depalmitoylation‐triggered proteasome degradation of IRHOM2 in ZDHHC3‐deleted THLE2 cells (upper) or ZDHHC3 (C157A)‐transfected THLE2 cells (middle) (n = 4 samples per group). THLE2 cells expressing IRHOM2 or IRHOM2‐Ub were transfected with AdshTRIM31, followed by a specific antibody for IRHOM2 used to detect the IRHOM2 or IRHOM2‐Ub expression. Negative control (NC) or empty vector (EV) were used as control. This experiment was repeated three times.
Figure 8
Figure 8
Palmitoylation maintains IRHOM2 by intercepting its ubiquitination and proteasome degradation. Working model of the regulation of palmitoylated IRHOM2 by palmitoyltransferase ZDHHC3 retards ubiquitin‐proteasome degradation of IRHOM2. Prolonged HFHC or WTDF intake dramatically increases circulating free fatty acid levels and palmitate (C16:0) to promote formation of palmitoylated IRHOM2. Elevated palmitoylation of IRHOM2 by ZDHHC3 facilitates its membrane localization and accumulation, and stabilization. Excessive IRHOM2 abundance significantly recruits its downstream signaling MAP3K7‐JNK‐NF‐κB p65 axis hyperactivation, thereby accelerating steatohepatitis progression in response to high‐energy diet challenge. In the meantime, palmitoylation‐stabilized IRHOM2 positively blocks its ubiquitination and TRIM31‐mediated proteasome degradation via decreasing ubiquitin of K48 linkage. Targeting palmitoylation using a pharmacological inhibitor (2‐BP) provides a potential therapeutic strategy to regain IRHOM2 ubiquitination and proteasome degradation.

References

    1. Quek J., Chan K. E., Wong Z. Y., Tan C., Tan B., Lim W. H., Tan Darren J. H., Tang Ansel S. P., Tay P., Xiao J., Yong J. N., Zeng R. W., Chew Nicholas W. S., Nah B., Kulkarni A., Siddiqui M. S., Dan Y. Y., Wong Vincent W.‐S., Sanyal A. J., Noureddin M., Muthiah M., Ng C. H., Lancet Gastroenterol Hepatol 2023, 8, 20. - PubMed
    1. Younossi Z. M., Golabi P., Paik J. M., Henry A., Van D. C., Henry L., Hepatology 2023, 77, 1335. - PMC - PubMed
    1. Eguchi Y., Wong G., Lee I.‐H., Akhtar O., Lopes R., Sumida Y., Hepatol. Res. 2021, 51, 19. - PubMed
    1. Anstee Q. M., Reeves H. L., Kotsiliti E., Govaere O., Heikenwalder M., Nat. Rev. Gastroenterol. Hepatol. 2019, 16, 411. - PubMed
    1. Cotter T. G., Rinellaa M., Gastroenterology 2020, 158, 1851. - PubMed

Publication types

Grants and funding

LinkOut - more resources