. 2023 Jul 19;2(1):kyad009.
doi: 10.1093/discim/kyad009. eCollection 2023.

Comparative phenotype of circulating versus tissue immune cells in human lung and blood compartments during health and disease

Affiliations

Comparative phenotype of circulating versus tissue immune cells in human lung and blood compartments during health and disease

Stefano A P Colombo et al. Discov Immunol. .

Abstract

The lung is a dynamic mucosal surface constantly exposed to a variety of immunological challenges including harmless environmental antigens, pollutants, and potentially invasive microorganisms. Dysregulation of the immune system at this crucial site is associated with a range of chronic inflammatory conditions including asthma and Chronic Pulmonary Obstructive Disease (COPD). However, due to its relative inaccessibility, our fundamental understanding of the human lung immune compartment is limited. To address this, we performed flow cytometric immune phenotyping of human lung tissue and matched blood samples that were isolated from 115 donors undergoing lung tissue resection. We provide detailed characterization of the lung mononuclear phagocyte and T cell compartments, demonstrating clear phenotypic differences between lung tissue cells and those in peripheral circulation. Additionally, we show that CD103 expression demarcates pulmonary T cells that have undergone recent TCR and IL-7R signalling. Unexpectedly, we discovered that the immune landscape from asthmatic or COPD donors was broadly comparable to controls. Our data provide a much-needed expansion of our understanding of the pulmonary immune compartment in both health and disease.

Keywords: COPD; T cells; asthma; dendritic cells; mucosal immunology.


Figures

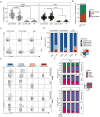
Graphical Abstract
Graphical Abstract
Figure 1:
Figure 1:
cDC2s are the dominant DC subset in the human lung. (a) Quantification of DC subsets in the human lung (n = 114) and peripheral blood (n = 69) given as the frequency of CD45+ cells. (b) Stacked bar plots representing DC subsets as a proportion of the total DC population in the blood and lung. (c) Representative contour plots showing the expression of CD206 on cDC2s in the blood and lung with (d) quantification given as percentage (%) of total cDC2s expressing CD206. (e) Quantification of monocyte subsets in the human lung and peripheral blood given as the frequency of CD45+ cells. (f) Stacked bar plots representing monocytes subsets as a proportion of the total monocyte population in the blood and lung. Box plots indicate median and interquartile range, whiskers represented the maximum/minimum value within 1.5× the upper/lower quartile limit. Dots indicate the values of individual donors. *P < 0.05; **** P < 0.0001. P values were calculated by unpaired Wilcoxon two-sample tests and adjusted for multiple comparisons using the Holm method.
Figure 2:
Figure 2:
Expression of maturation markers on DCs is increased in the lung relative to the blood. (a) Representative histograms showing the expression of CD40/CD86 on DC subsets in the lung (n = 114) and blood (n = 69). Iso indicates matched isotype negative control staining on pooled lung cells. (b) Quantification of CD40/CD86 expression on DC subsets given as the frequency of cells positive for each marker and the Log10 of the median fluorescent intensity (MFI). (c) Representative histograms of CD40/CD86 expression on CD206+ and CD206- cDC2s in the blood and lung. (d) Quantification of CD40/CD86 on CD206+ and CD206 cDC2s expressed as the frequency of cells positive for each marker and the Log10 of the median fluorescent intensity (MFI). Box plots indicate median and interquartile range, whiskers represented the maximum/minimum value within 1.5× the upper/lower quartile limit. Points beyond the whiskers indicate outliers. P values were calculated by unpaired Wilcoxon two-sample test and adjusted for multiple comparisons using the Holm method. *P < 0.05; ***P < 0.001; ****P < 0.0001.
Figure 3:
Figure 3:
Tissue compartment and expression of residency markers define T cell phenotype. (a) Quantification of T cell (SCC-AlowCD45+CD3+ cells) subsets in the human lung (n = 112) and peripheral blood (n = 68) given as the frequency of CD45+ cells. γδ T cells were identified as TCRγδ+, CD4+FOXP3 T cells were identified as TCRγδ-CD4+CD8FOXP3, CD4+FOXP3+ T cells were identified as TCRγδCD4+CD8FOXP3+, and CD8 T cells were identified as TCRγδCD4CD8+. Points represent individual donors. Box plots indicate median and interquartile range, whiskers represent the maximum/minimum value within 1.5× the upper/lower quartile limit. (b) Stacked bar plots representing the T cell subsets as a proportion of the total T cell population in the lung and blood. (c) Representative contour plots showing expression of putative residency markers (CD69 & CD103) in T cell subsets in the lung and blood with (d) quantification represented as stacked bar graphs. (e) Representative contour plots of CD45RA/CCR7 expression on blood and lung CD4+FOXP3 and CD8+ T cells residency marker subsets. CD45RA/CCR7 expression defined four T cell phenotypes: Naive (CD45RA+CCR7+), T-central memory (TCM, CD45RACCR7+), T-effector memory (TEM, CD45RACCR7), and T-effector re-expressing CD45RA (TEMRA, CD45RA+CCR7). (f) Quantification of the frequency of CD4+FOXP3 and CD8+ T cell phenotypes in residency marker subsets in the blood and lung. Representative contour plots are from five concatenated control donors. Stacked bars represent the mean frequency of a given population across the entire dataset. Error bars indicate the standard error of the mean. P values were calculated by unpaired Wilcoxon two-sample test and adjusted for multiple comparisons using the Holm method. ****P < 0.0001.
Figure 4:
Figure 4:
CD103 demarcates a TCR and IL-7R signalling experienced subset of CD4 and CD8 TEM cells in the human lung but not in peripheral blood. (a) Representative gating strategy for identification of CD4+FOXP3 and CD8+ TEM cells (CD45RA−-CCR7) from residency marker subsets with representative histograms showing CD28 and CD127 expression on these subsets in the lung (n = 112) and the blood (n = 68). Iso indicates matched isotype negative control staining on pooled lung cells. Plots are derived from five concatenated control donors. (b) Quantification of CD28/CD127 expression on CD4+FOXP3 and CD8+ TEM residency marker subsets given as percentage of cells expressing each marker. Box plots indicate median and interquartile range, whiskers represented the maximum/minimum value within 1.5× the upper/lower quartile limit. Points beyond the whiskers indicate statistical outliers. P values were calculated by unpaired Wilcoxon two-sample test and adjusted for multiple comparisons using the Holm method. *P < 0.05; **P < 0.01; ***P < 0.001; ****P < 0.0001.
Figure 5:
Figure 5:
Asthma and COPD are not associated with gross changes to the lung immune compartment. (a) Pie charts representing the proportion of donors with asthma donors: n = 17, median age = 72 year, age range = 55–83 year, 14 female or COPD (donors: n = 38, median age = 69 year, age range = 45–83 year, 23 female) and the gender ratio within groups. Donors were grouped as control if they were not identified to have asthma, COPD, or a history of other inflammatory disorders (donors: n = 60, median age = 71, age range = 28–86, 34 female). (b) Histogram representing the age distributions for control, asthmatic, and COPD donors. (c) Principle components analysis (PCA) plot of flow cytometry data. Points represent individual donors, shape and colour denote group. (d) Boxplots representing the frequency of immune cell subsets in peripheral blood and lung tissue separated by group. Quantification is given as the Log10 of the frequency of CD45+ cells. (e and f) Boxplots representing the frequency of (e) NK cells and (f) CD64+ cells in the lung tissue given as the frequency of CD45+ cells. Boxplots indicate the median and interquartile range, whiskers indicate the maximum/minimum value no greater/lesser than 1.5× the quartile limit. Points beyond the whiskers indicate statistical outliers. P values were calculated by unpaired Wilcoxon two-sample test and adjusted for multiple comparisons using the Holm method. *P < 0.05.

References

    1. Møller SH, Wang L, Ho PC.. Metabolic programming in dendritic cells tailors immune responses and homeostasis. Cell Mol Immunol 2022, 19, 370–83. doi:10.1038/s41423-021-00753-1. - DOI - PMC - PubMed
    1. Duan W, Croft M.. Control of regulatory T Cells and airway tolerance by lung macrophages and dendritic cells. Ann. Am. Thorac. Soc 2014, 11, S306–13. doi:10.1513/AnnalsATS.201401-028AW. - DOI - PMC - PubMed
    1. Farache J, Zigmond E, Shakhar G, Jung S.. Contributions of dendritic cells and macrophages to intestinal homeostasis and immune defense. Immunol Cell Biol 2013, 91, 232–9. doi:10.1038/icb.2012.79. - DOI - PubMed
    1. Gebhardt T, Palendira U, Tscharke DC, Bedoui S.. Tissue-resident memory T cells in tissue homeostasis, persistent infection, and cancer surveillance. Immunol Rev 2018, 283, 54–76. doi:10.1111/imr.12650. - DOI - PubMed
    1. Sharma A, Rudra D.. Emerging functions of regulatory T cells in tissue homeostasis. Front Immunol 2018, 9, 1–26. doi:10.3389/fimmu.2018.00883. - DOI - PMC - PubMed

LinkOut - more resources