

Stepping stones to extirpation: Puma patch occupancy thresholds in an urban-wildland matrix
- PMID: 37546565
- PMCID: PMC10401668
- DOI: 10.1002/ece3.10381
Stepping stones to extirpation: Puma patch occupancy thresholds in an urban-wildland matrix
Abstract
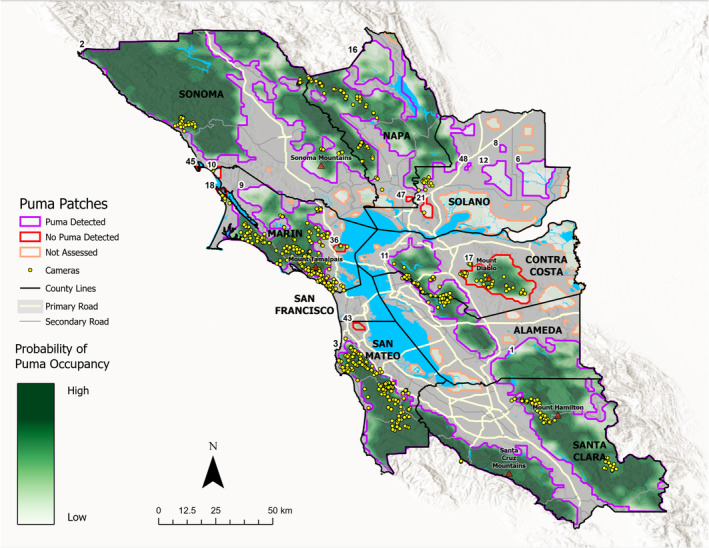
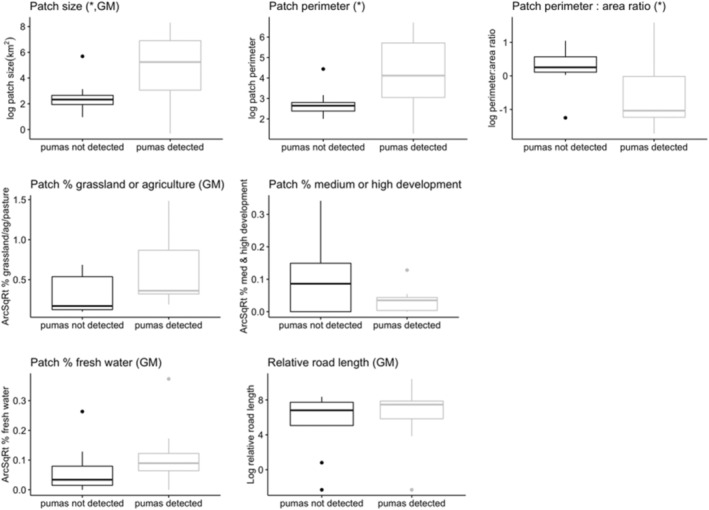
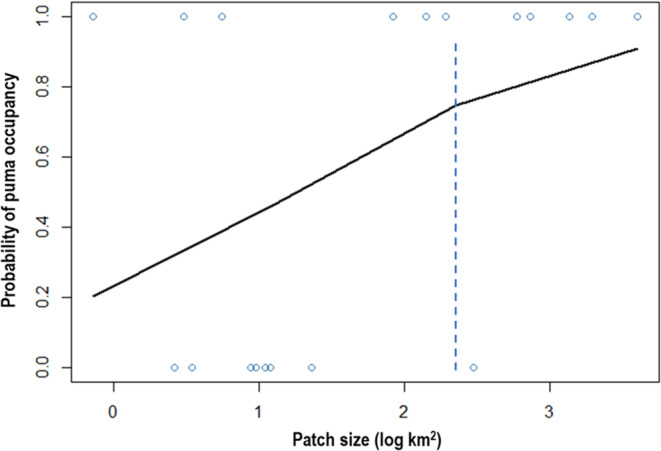
Habitat loss and fragmentation are the leading causes of species range contraction and extirpation, worldwide. Factors that predict sensitivity to fragmentation include high trophic level, large body size, and extensive spatial requirements. Pumas (Puma concolor) exemplify these qualities, making them particularly susceptible to fragmentation and subsequent reductions in demographic connectivity. The chaparral-dominated ecosystems surrounding the greater San Francisco Bay Area encompass over 10,000 km2 of suitable puma habitat, but inland waterways, croplands, urban land uses, and extensive transportation infrastructure have resulted in widespread habitat fragmentation. Pumas in this region now exist as a metapopulation marked by loss of genetic diversity, collisions with vehicles, and extensive human-puma conflict. Given these trends, we conducted a photo survey from 2017 to 2021 across 19 patches of predicted habitat and compiled a dataset of >6584 puma images. We used a logistic regression analytical framework to evaluate the hypothesis that puma patch occupancy would exhibit a threshold response explained by patch size, isolation, and habitat quality. Contrary to predictions, only variables related to patch size demonstrated any power to explain occupancy. On average, occupied patches were 18× larger than those where they were not detected (825 ± 1238 vs. 46 ± 101 km2). Although we observed pumas in patches as small as 1 km2, logistic regression models indicated a threshold occupancy probability between 300 and 400 km2, which is remarkably close to the mean male puma home range size in coastal California (~381 km2). Puma populations dependent on habitats below this value may be susceptible to inbreeding depression and human-wildlife conflict, and therefore vulnerable to extirpation. For species conservation, we suggest conflicts might be ameliorated by identifying the largest, isolated patches for public education campaigns with respect to management of domestic animals, and remaining connective parcels be identified, mapped, and prioritized for targeted mitigation.
Keywords: California; Puma concolor; connectivity; cougar; extirpation; fragmentation; occupancy; threshold; urban‐wildland interface.
© 2023 Felidae Conservation Fund. Ecology and Evolution published by John Wiley & Sons Ltd.
Conflict of interest statement
None.
Figures
References
-
- Allen, M. L. (2014). Ecology and behavior of pumas in northern California (Dissertation). Victoria University of Wellington, New Zealand.
-
- Bateman, P. W. , & Fleming, P. A. (2012). Big city life: Carnivores in urban environments. Journal of Zoology, 287, 1–23.
-
- Beier, P. (1993). Determining minimum habitat areas and habitat corridors for cougars. Conservation Biology, 7, 94–108.
-
- Beier, P. (1995). Dispersal of juvenile cougars in fragmented habitat. Journal of Wildlife Management, 59, 228–237.
-
- Beier, P. (1996). Metapopulation models, tenacious tracking, and cougar conservation. In McCullough D. R. (Ed.), Metapopulations and wildlife conservation (pp. 293–323). Island Press.
LinkOut - more resources
Full Text Sources
