[Preprint]. 2023 Jul 29:2023.07.28.550873.
doi: 10.1101/2023.07.28.550873.

Cross-site reproducibility of human cortical organoids reveals consistent cell type composition and architecture

Affiliations

Cross-site reproducibility of human cortical organoids reveals consistent cell type composition and architecture

Madison R Glass et al. bioRxiv. .

Update in

Abstract

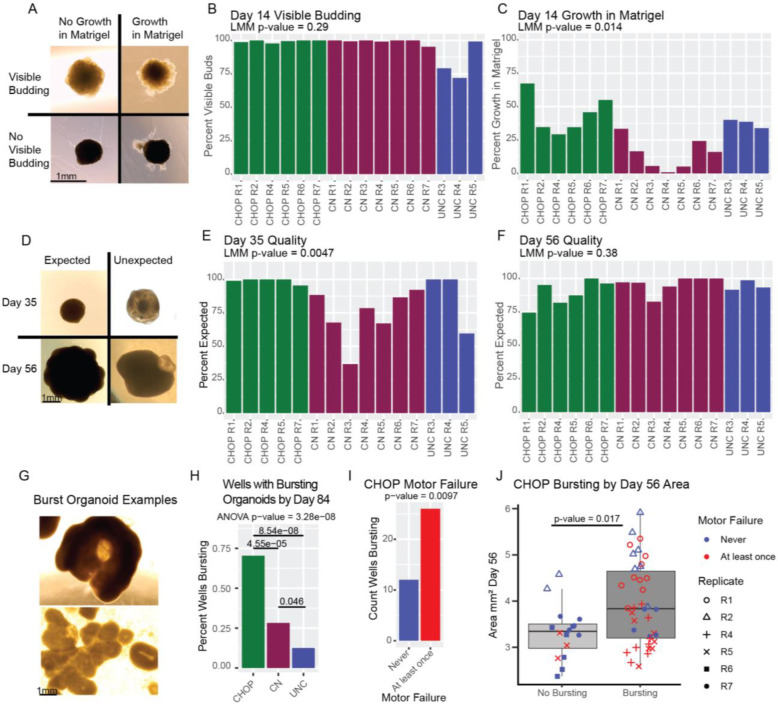
Background: Reproducibility of human cortical organoid (hCO) phenotypes remains a concern for modeling neurodevelopmental disorders. While guided hCO protocols reproducibly generate cortical cell types in multiple cell lines at one site, variability across sites using a harmonized protocol has not yet been evaluated. We present an hCO cross-site reproducibility study examining multiple phenotypes.

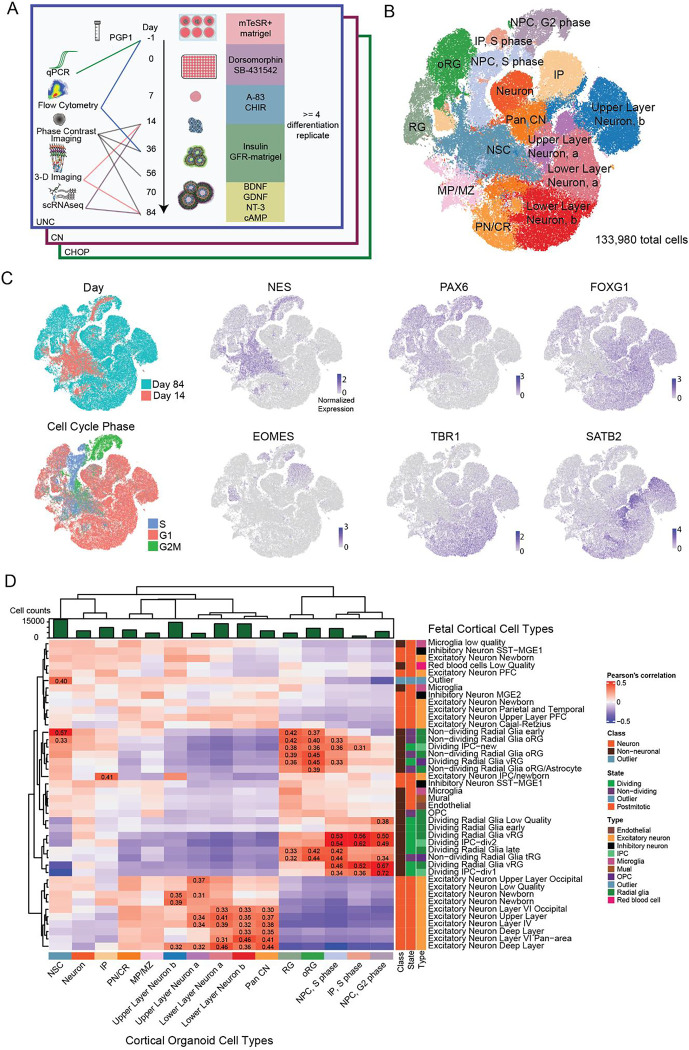
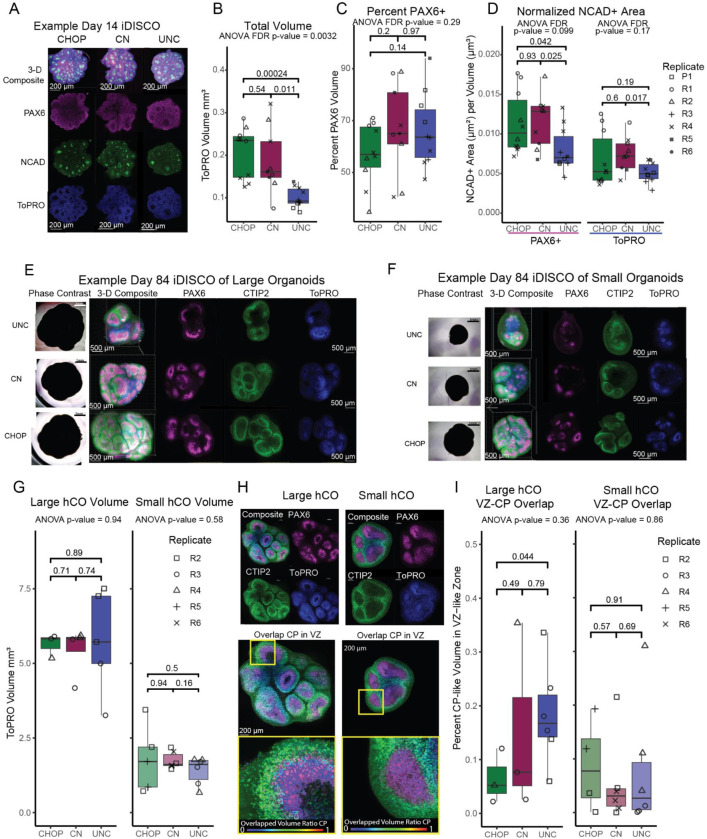
Methods: Three independent research groups generated hCOs from one induced pluripotent stem cell (iPSC) line using a harmonized miniaturized spinning bioreactor protocol. scRNA-seq, 3D fluorescent imaging, phase contrast imaging, qPCR, and flow cytometry were used to characterize the 3 month differentiations across sites.

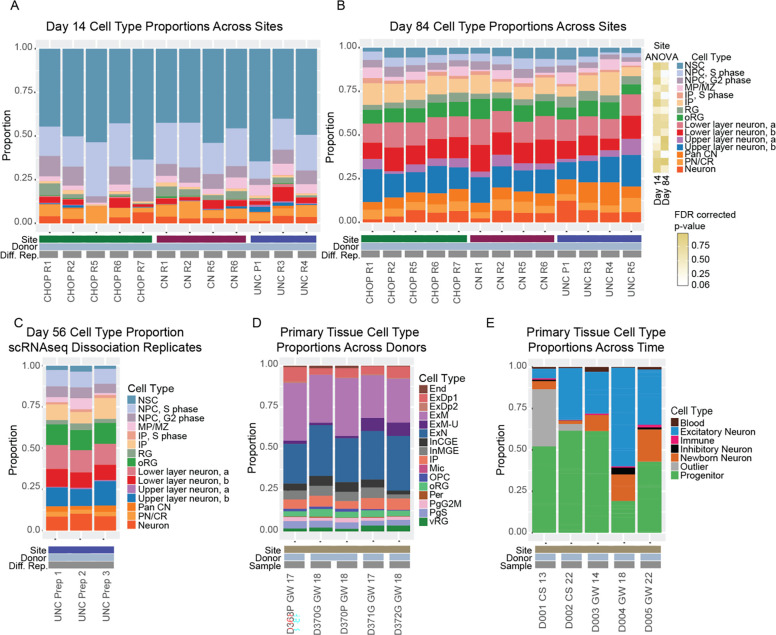
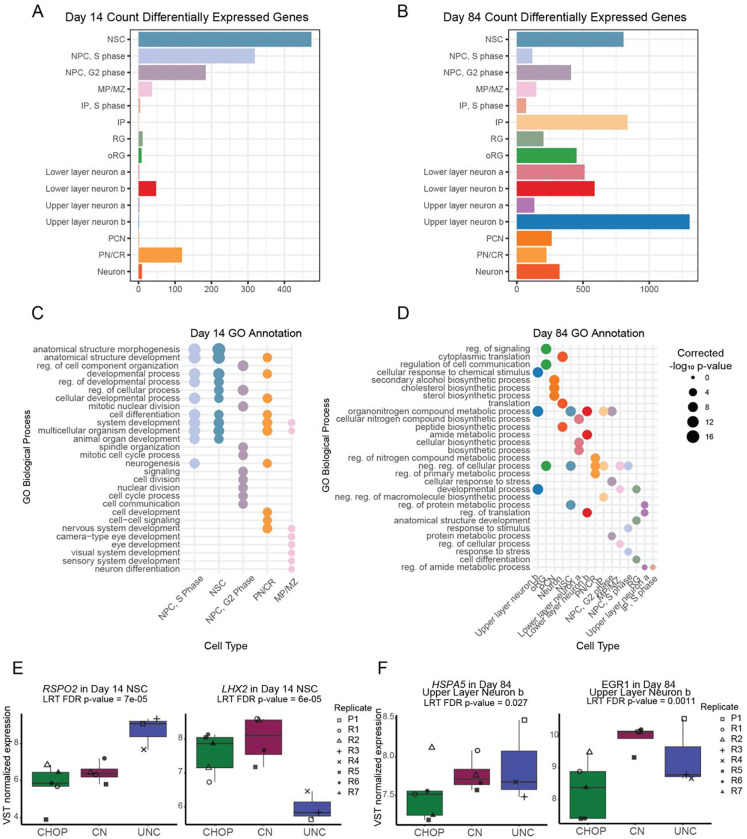
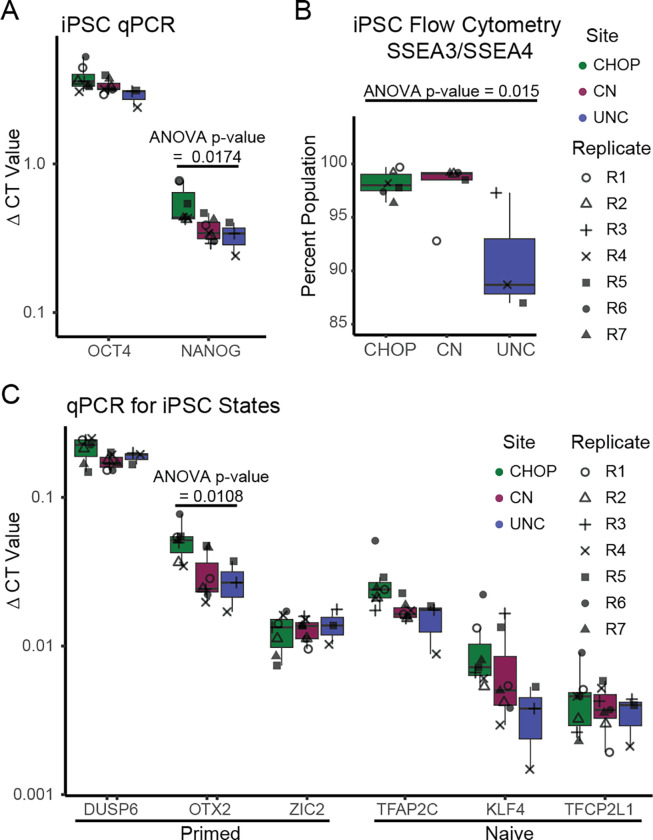
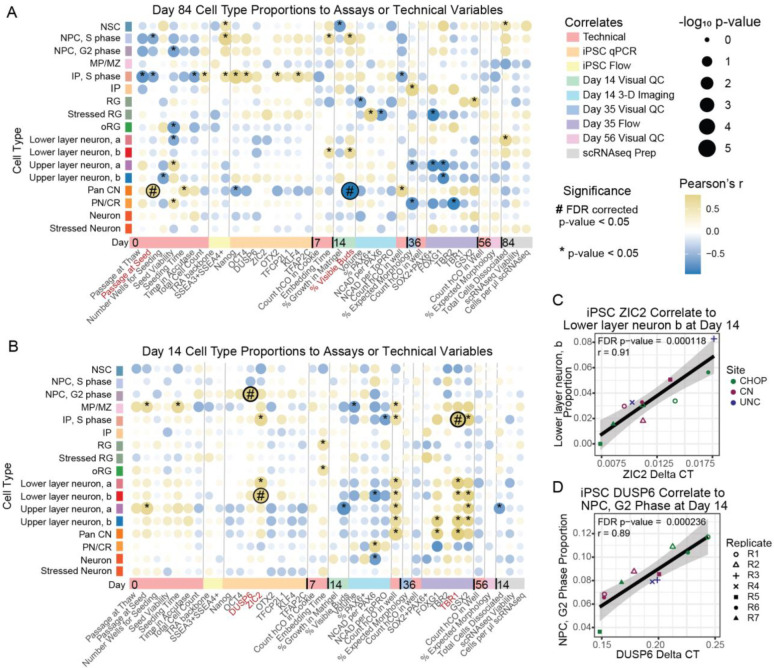
Results: In all sites, hCOs were mostly cortical progenitor and neuronal cell types in reproducible proportions with moderate to high fidelity to the in vivo brain that were consistently organized in cortical wall-like buds. Cross-site differences were detected in hCO size and morphology. Differential gene expression showed differences in metabolism and cellular stress across sites. Although iPSC culture conditions were consistent and iPSCs remained undifferentiated, primed stem cell marker expression prior to differentiation correlated with cell type proportions in hCOs.

Conclusions: We identified hCO phenotypes that are reproducible across sites using a harmonized differentiation protocol. Previously described limitations of hCO models were also reproduced including off-target differentiations, necrotic cores, and cellular stress. Improving our understanding of how stem cell states influence early hCO cell types may increase reliability of hCO differentiations. Cross-site reproducibility of hCO cell type proportions and organization lays the foundation for future collaborative prospective meta-analytic studies modeling neurodevelopmental disorders in hCOs.


Figures

Figure 1.
Figure 1.
Cell Type Characterizations from Day 14 and Day 84 Human Cortical Organoids. A) Experimental design showing critical steps for differentiation, collection timepoints, and assays. B) tSNE plot of detected cell types across all sites and time points. Abbreviations: NPC, G2: neural progenitor cells, G2-phase. IP, S: intermediate progenitor, S-phase. NPC, S: neural progenitor cell, S-phase. IP: non-dividing intermediate progenitor. oRG: outer radial glia. RG: radial glia. NSC: neuroepithelial stem cell. Neuron: unspecified neuron. Pan CN: pan-cortical neuron. ULN, a: Upper-layer cortical neuron, group a. ULN, b: Upper-layer cortical neuron, group b. LLN, a: Lower-layer cortical neuron, group a. LLN, b: Lower-layer cortical neuron group b. PN/CR: Pan neuron and Cajal–Retzius. MP/MZ: medial pallium and marginal zone. C) tSNE plots colored by differentiation day, inferred cell cycle phase, or gene expression of previously defined markers. D) Organoid cell type correlations to primary fetal telencephalic tissue (Bhaduri et al. 2020). Pearson’s correlation coefficients above 0.3 and surviving an FDR (BenjaminiHochberg) adjusted p value threshold of 0.05 are labeled.
Figure 2.
Figure 2.
Cell Type Proportions across Sites in Organoid and Primary Tissue Samples. Cell type proportions across the 3 sites at A) day 14 and B) day 84. Each differentiation replicate (Diff. Rep.) is a unique dissociation from a single organoid from an independent differentiation. C) Cell type proportions from 3 separate day 56 organoids harvested from the same differentiation replicate at UNC. D). Cell type proportion reported by (Polioudakis et al. 2019) from primary fetal tissue at similar developmental stages. End (Endothelial), ExDp1 (Excitatory deep layer 1), ExDp2 (Excitatory deep layer 1), ExM (Maturing excitatory), ExM-U (Maturing excitatory upper enriched), ExN (Migrating excitatory), InCGE (Interneuron Caudal Ganglionic Eminence), InMGE (Interneuron Medial Ganglionic Eminence), IP (Intermediate progenitors), Mic (Microglia), OPC (Oligodendrocyte progenitor cell), oRG (Outer radial glia), Per (Pericyte), PgG2M (Cycling progenitors(G2/M phase), PgS (Cycling progenitors (S phase)), vRG (Ventricular radial glia). E) Cell type proportions reported by (Bhaduri et al. 2020). Each sample is a unique primary tissue donor ordered from earlier to later developmental stages. CS (Carnegie Stage), GW (gestation week).
Figure 3.
Figure 3.
Differential Gene Expression across Sites. Counts of differentially expressed genes in pseudobulked cell types at A) day 14 and B) day 84. Significant gene ontology terms for biological processes associated with differentially expressed genes in cell types at C) day 14 and D) day 84. E) Gene expression differences in RSPO2 and LHX2 in day 14 neuroepithelial stem cells (NSC). F) Gene expression differences in HSPA5 and EGR1 in day 84 upper layer neuron, group b. Differences in gene expression across-site was determined by likelihood ratio tests (LRT). Abbreviations: regulation (reg), negative (neg).
Figure 4.
Figure 4.
Evaluation of Marker Expression at the Pluripotent Stage and Day 35 across Sites. A) qPCR from iPSCs directly before organoid differentiation for pluripotency. B) Flow cytometry for the pluripotency marker SSEA3/SSEA4. C) qPCR for markers of primed and naive cell state. p-values from one-way ANOVA across site differences are shown when nominally significant. No cross-site differences were detected when correcting for multiple comparisons.
Figure 5.
Figure 5.
Qualitative Assessments of Organoid Differentiations. A) Representative images of ranking embedded organoids at D14. B) Percent organoids with visible budding at day 14. C) Percent organoids with growth into the matrigel at day 14. D) Representative images of ranking organoids in the bioreactor at day 35 and day 56. E) Percent organoids with expected morphology at day 35. F) Percent organoids with expected morphology at day 56. Significance of cross site differences was evaluated with an ANOVA implemented in a linear mixed effect logistic regression model controlling for the non-independence of multiple organoids within the same differentiation batch using a random effect, and controlling for the ranker who evaluated the images with a fixed effect. G) Example images or burst organoids from CHOP at day 84. H) Percent of wells with burst organoids across sites. I) Count of wells with burst organoids by motor failure at CHOP. J) Organoid day 56 cross-sectional area and motor failure in CHOP burst organoids. Significance of motor failure and cross-sectional day 56 organoid area was evaluated in a linear mixed effect logistic regression model controlling for the other factor.
Figure 6.
Figure 6.
3D Structures in Organoids at Day 14 and Day 84. A) Example image of day 14 organoids from each site. All scale bars are 200 μm except for UNC. B) Total volume of day 14 organoids across sites. Quantification of neuroepithelial bud structure at day 14 as C) percent PAX6+ volume per organoid and D) total NCAD+ area normalized to PAX6+ volume and TOPRO+ volume. Examples images of E) largest organoids and F) smallest organoids from each site at day 84. All scale bars are 500 μm. G) Total volume of largest and smallest organoids across sites. H) Representative 3-D image of PAX6 and CTIP2 with annotated ventricular-zone-like-volumes (VZ-like) and annotated cortical-plate-like-volumes (CP). I) Quantification of volume overlapped between VZ-like and CP-like annotations. All scale bars are 200 μm.
Figure 7.
Figure 7.
Correlations to Cell Type Proportions. Pearson’s correlations of cell type proportions in scRNAseq data to assay results or technical variables at A) day 84 or B) day 14. C) Correlation between primed marker ZIC2 and lower layer neuron, b proportions at day 14. D) Correlation between primed marker DUSP6 and NPC, G2 phase in day 14 organoids.

References

    1. Ahmad Muhammad Khairi, Abdollah Nur Ainina, Shafie Nurul Husna, Yusof Narazah Mohd, and Razak Siti Razila Abdul. 2018. “Dual-Specificity Phosphatase 6 (DUSP6): A Review of Its Molecular Characteristics and Clinical Relevance in Cancer.” Cancer Biology & Medicine 15 (1): 14–28. - PMC - PubMed
    1. Alagappan Dhivyaa, Balan Murugabaskar, Jiang Yuhui, Cohen Rachel B., Kotenko Sergei V., and Levison Steven W.. 2013. “Egr-1 Is a Critical Regulator of EGF-Receptor-Mediated Expansion of Subventricular Zone Neural Stem Cells and Progenitors during Recovery from Hypoxia-Hypoglycemia.” ASN Neuro 5 (3): 183–93. - PMC - PubMed
    1. Albanese Alexandre, Swaney Justin M., Dae Hee Yun Nicholas B. Evans, Antonucci Jenna M., Velasco Silvia, Sohn Chang Ho, Arlotta Paola, Gehrke Lee, and Chung Kwanghun. 2020. “Multiscale 3D Phenotyping of Human Cerebral Organoids.” Scientific Reports 10 (1): 21487. - PMC - PubMed
    1. Baker Monya. 2016. “1,500 Scientists Lift the Lid on Reproducibility.” Nature Publishing Group; UK. May 25, 2016. 10.1038/533452a. - DOI - PubMed
    1. Bekpen Cemalettin, and Tautz Diethard. 2019. “Human Core Duplicon Gene Families: Game Changers or Game Players?” Briefings in Functional Genomics 18 (6): 402–11. - PMC - PubMed

Publication types