[Preprint]. 2023 Jul 27:2023.07.25.550582.
doi: 10.1101/2023.07.25.550582.

Systematic assessment of long-read RNA-seq methods for transcript identification and quantification

Francisco J Pardo-Palacios  1   2 Dingjie Wang  3   4   2 Fairlie Reese  5   6   2 Mark Diekhans  7   2 Sílvia Carbonell-Sala  8   2 Brian Williams  9   2 Jane E Loveland  10   2 Maite De María  11   12   2 Matthew S Adams  13   2 Gabriela Balderrama-Gutierrez  5   6   2 Amit K Behera  14   2 Jose M Gonzalez  10   2 Toby Hunt  10   2 Julien Lagarde  8   15   2 Cindy E Liang  13   2 Haoran Li  3   4   2 Marcus Jerryd Meade  16   2 David A Moraga Amador  17   2 Andrey D Prjibelski  18   19   2 Inanc Birol  20 Hamed Bostan  21 Ashley M Brooks  21 Muhammed Hasan Çelik  5   6 Ying Chen  22 Mei R M Du  23 Colette Felton  14 Jonathan Göke  22   24 Saber Hafezqorani  20 Ralf Herwig  25 Hideya Kawaji  26 Joseph Lee  22 Jian Liang Li  21 Matthias Lienhard  25 Alla Mikheenko  27 Dennis Mulligan  14 Ka Ming Nip  20 Mihaela Pertea  28   29 Matthew E Ritchie  23   30 Andre D Sim  22 Alison D Tang  14 Yuk Kei Wan  22   31 Changqing Wang  23 Brandon Y Wong  28   29 Chen Yang  20 If Barnes  10 Andrew Berry  10 Salvador Capella  32 Namrita Dhillon  14 Jose M Fernandez-Gonzalez  32 Luis Ferrández-Peral  1 Natàlia Garcia-Reyero  33 Stefan Goetz  34 Carles Hernández-Ferrer  32 Liudmyla Kondratova  35 Tianyuan Liu  36 Alessandra Martinez-Martin  1 Carlos Menor  34 Jorge Mestre-Tomás  1 Jonathan M Mudge  10 Nedka G Panayotova  17 Alejandro Paniagua  1 Dmitry Repchevsky  32 Eric Rouchka  37 Brandon Saint-John  14 Enrique Sapena  38 Leon Sheynkman  16 Melissa Laird Smith  37 Marie-Marthe Suner  10 Hazuki Takahashi  39 Ingrid Ashley Youngworth  40 Piero Carninci  39   41 Nancy D Denslow  11   42 Roderic Guigó  8   43 Margaret E Hunter  44 Hagen U Tilgner  45 Barbara J Wold  9 Christopher Vollmers  14 Adam Frankish  10 Kin Fai Au  3   4 Gloria M Sheynkman  16   46   47 Ali Mortazavi  5   6 Ana Conesa  1   48 Angela N Brooks  7   14
Affiliations

Systematic assessment of long-read RNA-seq methods for transcript identification and quantification

Francisco J Pardo-Palacios et al. bioRxiv. .

Update in

  • Systematic assessment of long-read RNA-seq methods for transcript identification and quantification.
    Pardo-Palacios FJ, Wang D, Reese F, Diekhans M, Carbonell-Sala S, Williams B, Loveland JE, De María M, Adams MS, Balderrama-Gutierrez G, Behera AK, Gonzalez Martinez JM, Hunt T, Lagarde J, Liang CE, Li H, Meade MJ, Moraga Amador DA, Prjibelski AD, Birol I, Bostan H, Brooks AM, Çelik MH, Chen Y, Du MRM, Felton C, Göke J, Hafezqorani S, Herwig R, Kawaji H, Lee J, Li JL, Lienhard M, Mikheenko A, Mulligan D, Nip KM, Pertea M, Ritchie ME, Sim AD, Tang AD, Wan YK, Wang C, Wong BY, Yang C, Barnes I, Berry AE, Capella-Gutierrez S, Cousineau A, Dhillon N, Fernandez-Gonzalez JM, Ferrández-Peral L, Garcia-Reyero N, Götz S, Hernández-Ferrer C, Kondratova L, Liu T, Martinez-Martin A, Menor C, Mestre-Tomás J, Mudge JM, Panayotova NG, Paniagua A, Repchevsky D, Ren X, Rouchka E, Saint-John B, Sapena E, Sheynkman L, Smith ML, Suner MM, Takahashi H, Youngworth IA, Carninci P, Denslow ND, Guigó R, Hunter ME, Maehr R, Shen Y, Tilgner HU, Wold BJ, Vollmers C, Frankish A, Au KF, Sheynkman GM, Mortazavi A, Conesa A, Brooks AN. Pardo-Palacios FJ, et al. Nat Methods. 2024 Jul;21(7):1349-1363. doi: 10.1038/s41592-024-02298-3. Epub 2024 Jun 7. Nat Methods. 2024. PMID: 38849569 Free PMC article.

Abstract

The Long-read RNA-Seq Genome Annotation Assessment Project (LRGASP) Consortium was formed to evaluate the effectiveness of long-read approaches for transcriptome analysis. The consortium generated over 427 million long-read sequences from cDNA and direct RNA datasets, encompassing human, mouse, and manatee species, using different protocols and sequencing platforms. These data were utilized by developers to address challenges in transcript isoform detection and quantification, as well as de novo transcript isoform identification. The study revealed that libraries with longer, more accurate sequences produce more accurate transcripts than those with increased read depth, whereas greater read depth improved quantification accuracy. In well-annotated genomes, tools based on reference sequences demonstrated the best performance. When aiming to detect rare and novel transcripts or when using reference-free approaches, incorporating additional orthogonal data and replicate samples are advised. This collaborative study offers a benchmark for current practices and provides direction for future method development in transcriptome analysis.


Conflict of interest statement

Competing Interests Design of the project was discussed with Oxford Nanopore Technologies (ONT), Pacific Biosciences, and Lexogen. ONT provided partial support for flow cells and reagents. S.C-S and A.N.B. have received reimbursement for travel, accommodation, and conference fees to speak at events organized by ONT. A.N.B. is a consultant for Remix Therapeutics, Inc.

Figures

Extended Data Fig. 1.
Read usage by analysis tool. a-c) The Percentage of Reads Used (PRU) is calculated as the fraction between the number of reads in transcript models provided in the submission of each pipelines and the number of available reads in the dataset. Values > 100 indicate the same read is assigned to more than one transcript model. Values < 100 indicate that not all available reads were used to predict transcript models. d) Distribution of the number of transcripts assigned to each long-read in the submitted reads2transcripts files. Values are aggregated for all submissions of the same tool.
Extended Data Fig. 2.
SQANTI3 evaluation of LRGASP submissions of the H1-mix dataset. Labels correspond to analysis tools and the color code indicates the combination of library preparation and sequencing platform. a) Number of gene and transcript detections. b) Number of Full Splice Match and Incomplete Splice Match transcripts. c) Number of Novel in Catalogue and Novel Not in Catalogue transcripts. d) Number of known and novel transcripts with full support at junctions and end positions. e) Percentage of transcripts with 5′end support. f) Percentage of transcripts with 3′end support. g) Percentage of canonical splice junctions (SJ) and short-reads support at SJ. Ba: Bambu, FM: Flames, FL: FLAIR, IQ: IsoQuant, IT: IsoTools, IB: Iso_IB, Ly: LyRic, Ma: Mandalorion, TL: TALON-LAPA, Sp: Spectra, ST: StringTie2.
Extended Data Fig. 3.
SQANTI3 evaluation of LRGASP submissions of the mouse ES dataset. Labels correspond to analysis tools and the color code indicates the combination of library preparation and sequencing platform. a) Number of gene and transcript detections. b) Number of Full Splice Match and Incomplete Splice Match transcripts. c) Number of Novel in Catalogue and Novel Not in Catalogue transcripts. d) Number of known and novel transcripts with full support at junctions and end positions. e) Percentage of transcripts with 5′end support. f) Percentage of transcripts with 3′end support. g) Percentage of canonical splice junctions (SJ) and short-reads support at SJ. Ba: Bambu, FM: Flames, FL: FLAIR, IQ: IsoQuant, IT: IsoTools, IB: Iso_IB, Ly: LyRic, Ma: Mandalorion, TL: TALON-LAPA, Sp: Spectra, ST: StringTie2.
Extended Data Fig. 4.
Relationship between sequencing depth and number of detected features. a−c) Transcripts, d−f) Genes.
Extended Data Fig. 5.
Relationship between read length and number of detected features. a−c) Transcripts, d−f) Genes.
Extended Data Fig. 6.
Relationship between read quality and number of detected features. a−c) Transcripts, d−f) Genes.
Extended Data Fig. 7.
Median Absolute Deviance of detected features by experimental factor. a−c) Transcripts, d−f) Genes.
Extended Data Fig. 8.
Number of detected transcripts and genes per analysis tool. a−c) Transcripts, d−f) Genes.
Extended Data Fig. 9.
Number of detected genes per Platform and Library Preparation. a−c) Platform, d−f) Library Preparation.
Extended Data Fig. 10.
Number of detected transcripts per Platform and Library Preparation. a−c) Platform, d−f) Library Preparation.
Extended Data Fig. 11.
Number of detected transcripts in cDNA and CapTrap libraries. a−c) cDNA, d−f) CapTrap.
Extended Data Fig. 12.
Number of detected transcripts in PacBio and Nanopore platforms. a−c) PacBio, d−f) Nanopore.
Extended Data Fig. 13.
Number of detected genes in cDNA and CapTrap libraries. a−c) cDNA, d−f) CapTrap.
Extended Data Fig. 14.
Number of detected genes in PacBio and Nanopore platforms. a−c) PacBio, d−f) Nanopore.
Extended Data Fig. 15.
Number of FSM and ISM by sequencing platform and library preparation. a−c) FSM, d−f) ISM.
Extended Data Fig. 16.
Number of NIC and NNC by sequencing platform and library preparation. a−c) NIC, d−f) NNC.
Extended Data Fig. 17.
Number of FSM transcripts by library preparation and analysis tool. a−c) cDNA. d−f) CapTrap.
Extended Data Fig. 18.
Number of FSM transcripts by sequencing platform and analysis tool. a−c) PacBio, d−f) Nanopore.
Extended Data Fig. 19.
Number of ISM transcripts by library preparation and analysis tool. a−c) cDNA. d−f) CapTrap.
Extended Data Fig. 20.
Number of ISM transcripts by sequencing platform and analysis tool. a−c) Intergenic. d−f) GenicGenomic.
Extended Data Fig. 21.
Number of Intergenic and GenicGenomic by sequencing platform and library preparation. a−c) Intergenic, d−f) GenicGenomic.
Extended Data Fig. 22.
Number of Fusion and Antisense by sequencing platform and library preparation. a−c) Fusion. d−f) Antisense.
Extended Data Fig. 23.
Percentage of transcript models (TM) with different ranges of sequence coverage by long reads. a) WTC11. c) H1−mix. c) Mouse ES. Ba: Bambu, FM: FLAMES, FL: FLAIR, IQ: IsoQuant, IT: IsoTools, IB: Iso_IB, Ly: LyRic, Ma: Mandalorion, TL: TALON−LAPA, Sp: Spectra, ST: StringTie2.
Extended Data Fig. 24.
Distribution of Biotypes across pipelines. a) WTC11, c) H1−mix, c) Mouse ES.
Extended Data Fig. 25.
Biotypes per pipeline. a) WTC11, c) H1−mix, c) Mouse ES.
Extended Data Fig. 26.
Number and SQANTI category distribution of Unique Intron Chain (UIC) consistently detected by an increasing number of submissions. a) H1−mix sample, b) Mouse ES sample.
Extended Data Fig. 27.
Pair-wise overlap in the detection of features between pipelines; WTC11 sample. Each value represents the feature intersection between column and row pipelines divided by the number of detections in the row pipeline. a) Genes, b) Splice junctions, c) Unique Intron Chains (UIC), c) Top UIC accounting for at least 50% of the gene expression.
Extended Data Fig. 28.
Pair-wise overlap in the detection of features between pipelines; H1-mix sample. Each value represents the feature intersection between column and row pipelines divided by the number of detections in the row pipeline. a) Genes, b) Splice junctions, c) Unique Intron Chains (UIC), c) Top UIC accounting for at least 50% of the gene expression.
Extended Data Fig. 29.
Pair-wise overlap in the detection of features between pipelines; ES mouse sample. Each value represents the feature intersection between column and row pipelines divided by the number of detections in the row pipeline. a) Genes, b) Splice junctions, c) Unique Intron Chains (UIC), c) Top UIC accounting for at least 50% of the gene expression.
Extended Data Fig. 30.
Number of UIC detected by a tool and shared with an increasing number of other tools, processing PacBio_cDNA data. a) WTC11, c) H1−mix, c) Mouse ES.
Extended Data Fig. 31.
Number of UIC detected by a tool and shared with an increasing number of other tools, processing PacBio_CapTrap data. a) WTC11, c) H1−mix, c) Mouse ES.
Extended Data Fig. 32.
Number of UIC detected by a tool and shared with an increasing number of other tools, processing PacBio_CapTrap data. a) WTC11, c) H1−mix, c) Mouse ES.
Extended Data Fig. 33.
Number of UIC detected by a tool and shared with an increasing number of other tools, processing ONT_CapTrap data. a) WTC11, c) H1−mix, c) Mouse ES.
Extended Data Fig. 34.
Number of UIC detected by a tool and shared with an increasing number of other tools, processing ONT_R2C2 data. a) WTC11, c) H1−mix, c) Mouse ES
Extended Data Fig. 35.
Number of UIC detected by a tool and shared with an increasing number of other tools, processing ONT_dRNA data. a) WTC11, c) H1−mix, c) Mouse ES
Extended Data Fig. 36.
Number of UIC consistently detected by a tool across samples. a) WTC11, c) H1−mix, c) Mouse ES
Extended Data Fig. 37.
Characterization of frequently detected UICs (FDU). a,c,e) Structural category distribution of FDU. The table indicates the fold enrichment of each structural category within the frequently detected transcripts respect to their global count. b,d,f) Tools identifying FDU. The graph shows the enrichment in the number FDU found by a tool with respect to their global number of reported transcripts. The table reports the total number of FDU detected by the tool.
Extended Data Fig. 38.
Properties of detected transcripts by library preparation. a,d,g) Length distribution. b,e,h) Exon number distribution. c,f,i) Counts per million
Extended Data Fig. 39.
Properties of detected transcripts by library preparation. a,d,g) Length distribution. b,e,h) Exon number distribution. c,f,i) Counts per million
Extended Data Fig. 40.
Properties of detected transcripts by experimental protocol. a,d,g) Length distribution. b,e,h) Exon number distribution. c,f,i) Counts per million
Extended Data Fig. 41.
Distribution of transcript length by analysis tool.
Extended Data Fig. 42a.
Positional coverage of SIRV transcript sequences by long reads in the cDNA_PacBio sample.
Extended Data Fig. 42b.
Positional coverage of SIRV transcript sequences by long reads in the CapTrap_PacBio sample.
Extended Data Fig. 42c.
Positional coverage of SIRV transcript sequences by long reads in the cDNA_ONT sample.
Extended Data Fig. 42d.
Positional coverage of SIRV transcript sequences by long reads in the CapTrap_ONT sample.
Extended Data Fig. 42e.
Positional coverage of SIRV transcript sequences by long reads in the R2C2_ONT sample.
Extended Data Fig. 42f.
Positional coverage of SIRV transcript sequences by long reads in the dRNA_ONT sample.
Extended Data Fig. 43.
Performance metrics on mouse simulated data. Sen_kn: sensitivity known transcripts, Sen_kn > 5TMP: sensitivity known transcripts with expression > 5 TPM, Pre_kn: precision known transcripts, Sen_no: sensitivity novel transcripts, Pre_no: precision novel transcripts, 1/Red: inverse of redundancy.
Extended Data Fig. 44.
Comparison of long−read transcript coverage between real and simulated datasets.
Extended Data Fig. 45.
Properties of GENCODE manually annotated loci for WTC11 sample.a) Distributon of gene expression. b) Distribution of SQANTI categories. c) Intersection of Unique Intron Chains (UIC) among experimental protocols.
Extended Data Fig. 46.
Properties of GENCODE manually annotated loci for mouse ES sample.a) Distributon of gene expression. b) Distribution of SQANTI categories. c) Intersection of Unique Intron Chains (UIC) among experimental protocols.
Extended Data Fig. 47.
Performance metrics of LRGASP pipelines evaluate against GENCODE manual annotation of mouse ES sample. Ba: Bambu, FM: Flames, FR: FLAIR, IQ: IsoQuant, IT: IsoTools, IB: Iso_IB, Ly: LyRic, Ma: Mandalorion, TL: TALON−LAPA, Sp: Spectra, ST: StringTie2.
Extended Data Fig. 48.
Detection of Unique Intron Chains (UIC) at GENCODE manual annotation loci. Ba: Bambu, FM: Flames, FL: FLAIR, IQ: IsoQuant, IT: IsoTools, IB: Iso_IB, Ly: LyRic, Ma: Mandalorion, TL: TALON−LAPA, Sp: Spectra, ST: StringTie2.
Extended Data Fig. 49.
Performance on GENCODE manually curated data. Curated transcripts selected to be present in at least two experimental datasets. Ba: Bambu, FM: Flames, FL: FLAIR, IQ: IsoQuant, IT: IsoTools, IB: Iso_IB, Ly: LyRic, Ma: Mandalorion, TL: TALON−LAPA, Sp: Spectra, ST: StringTie2.
Extended Data Fig. 50.
Performance on GENCODE manually curated data. The ground truth is the set of manually annotated transcripts with more than two reads. Ba: Bambu, FM: Flames, FL: FLAIR, IQ: IsoQuant, IT: IsoTools, IB: Iso_IB, Ly: LyRic, Ma: Mandalorion, TL: TALON−LAPA, Sp: Spectra, ST: StringTie2.
Extended Data Fig. 51.
Performance on GENCODE manually curated data by Library Preparation.
Extended Data Fig. 52.
Performance on GENCODE manually curated data by Platform.
Extended Data Fig. 53.
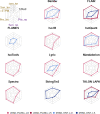
Radar plot of overall evaluation results of 8 quantification tools with 7 protocolsplatforms on 4 data scenarios: real data with multiple replicates, cell mixing experiment, SIRV-set4 data and simulation data. To display the evaluation results more effectively, we normalized all metrics to 0–1 range: 0 corresponds to the worst performance and 1 corresponds to the best performance.
Extended Data Fig. 54.
Extended Data Fig. 54.. Overall evaluation results of irreproducibility on real data with multiple replicates.
(a) The diagram illustrates the calculation of irreproducibility. By fitting the coefficient of variation (CV) versus average transcript abundance into a smooth curve, it can be shown that Method X has lower coefficient of variation and higher reproducibility. (b) The overall results of CV curves with different transcript abundances on four samples (H1-mix, WTC11, H1-hESC and H1-DE) with different protocols and platforms. Here, Bambu-merge represents the transcript quantification using Bambu with GENCODE plus LR-specific annotation. And Bambu-LR represents the transcript quantification using only LR-specific annotation.
Extended Data Fig. 55.
Extended Data Fig. 55.. Overall evaluation results of consistency on real data with multiple replicates.
(a) The diagram illustrates the calculation of consistency. By setting an expression threshold (i.e. 1 in this toy example), we can define which set of transcripts express (in blue) or not (in orange). This statistic is to measure the consistency of the expressed transcripts sets between replicates. (b) A toy example to show the consistency curves with different abundance threshold. Here, method X performs the better consistency of transcript abundance estimation across multiple replicates than method Y. (c) The detailed evaluation results of consistency curves with different abundance thresholds on four samples (H1-mix, WTC11, H1-hESC and H1-DE) with different protocols and platforms.
Extended Data Fig. 56.
Extended Data Fig. 56.. Resolution Entropy.
(a) The software output only a few certain discrete values has lower resolution entropy as it cannot capture the continuous and subtle difference of gene expressions. (b) The software with continuous output values has higher resolution entropy
Extended Data Fig. 57.
Extended Data Fig. 57.. Performance evaluation on cell mixing experiment.
(a) Schematic diagram of evaluation strategy using the cell mixing experiment. Here, H1-mix was initially provided for quantification which was a mix of H1-hESC cells and H1-DE cells at an undisclosed ratio. After the initial submission, the individual H1-hESC and H1-DE samples were released and participants submitted quantifications for each. (b) Scatter plot of expected abundance and observed abundance for 7 participanťs tools with different protocols and platforms.
Extended Data Fig. 58.
Extended Data Fig. 58.. Performance evaluation on SIRV-set4 data.
(a) Scatter plot of true abundance and estimated abundance on SIRV-set4 data with different protocols and platforms.
Extended Data Fig. 59.
Extended Data Fig. 59.. Performance evaluation on simulation data.
(a) The flow chart of simulation study. (b) Scatter plot of true abundance and estimated abundance on simulation data.
Extended Data Fig. 60.
Extended Data Fig. 60.. Impact of annotation accuracy on transcript quantification.
We assessed the performance of RSEM and LR-based tools (Bambu, FLAIR, FLAMES, IsoQuant, IsoTools, TALON, and NanoSim) with different annotations. The NRMSE metric was used to evaluate their performance on simulated data for human and mouse. For LR-based tools, the transcript quantification annotations were derived from sample-specific annotations identified by the participant using long-read RNA-seq data. As for RSEM, we present quantification results based on two annotations: a completely accurate annotation (i.e., the ground truth transcripts generated by the simulation data) and an inaccurate annotation (i.e., the common GENCODE reference annotation, which contains numerous false negative and false positive transcripts specific to the sample).
Extended Data Fig. 61.
Read length distributions in six protocols-platforms.
Extended Data Fig. 62.
Extended Data Fig. 62.. Description of K-value.
A measure of the complexity of exon-isoform structures for each gene. Supplementary figure SX1. Assembly of the manatee genome statistics. a) Nanopore reads were used to obtain a draft genome of the Floridian manatee applying Flye. The resulting assembly was polished with exisiting Illumina reads using Pilon. b) BUSCO completeness.
Extended Data Fig. 63.
Manatee genome assembly statistics. a Nanopore reads were used to obtain a draft genome of the Floridian manatee with Flye. The resulting assembly was polished with existing Illumina reads using Pilon. b BUSCO completeness.
Extended Data Fig.64.
Mapping rate of transcript detected by Challenge 3 submissions.
Extended Data Fig. 65.
SQANTI category classification of transcript models detected by the same tools in Challenge 1 and 3. Challenge 1 predictions used the reference annotation and Challenge 3 predictions did not. Ba = Bambu, IQ = StringTie2/IsoQuant.
Extended Data Fig. 66.
Coding potential of transcripts detected by Challenge 3 submissions.
Extended Fig. 67.
Extended Fig. 67.
SQANTI3 analysis of SIRV reads in manatee samples. a) SQANTI3 categories for reads mapping to SIRVs in cDNA−PacBio and cDNA−ONT replicates. b) Number of SIRV transcripts with at least one Reference Match (RM) read in cDNA−PacBio and cDNA−ONT replicates
Extended Data Fig. 68.
Fraction of validated transcripts as a function of the total numbers of long reads that were observed across the 21 library preparations (e.g., PacBio cDNA, ONT cDNA, PacBio CapTrap).
Extended Data Fig. 69.
The distribution of lengths corresponding to the target transcript isoform across the entire validation experiment (including GENCODE, Platform, and Consistency groups), broken down by their validation status.
Extended Data Fig. 70.
PCR validation results for manatee isoforms for seven target genes (data shown in Figure 5l) broken down by the platform (ONT or PacBio) underlying the pipelines that led to the identification of the isoform.
Extended Data Fig. 71.
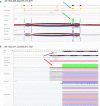
Validation of ALG6 U12 Intron with WTC11 Reads. In panel (a), a novel transcript model, NCC_39352 (blue arrow), appears to corroborate the exon within the ALG6 GENCODE annotation. The mapped amplicon in the control junction tracks provides evidence of the preceding intron. The green arrow indicates the ONT and PacBio read alignment coverage over the exon, but the junction tracks shows a lack of support for the splice junction at the exon's 5' end. In panel (b), GENCODE's annotation of a rare U12 GT-AT intron (purple arrow), which is unsupported by minimap2. Instead, minimap2 forces a GT-AG intron by reporting a six-base deletion in the reference genome (red arrow). As all pipelines relied on minimap2, correct annotation of this transcript was unattainable, illustrating the challenges difficult-to-align regions can pose to annotation with longread transcripts.
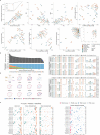
Fig. 1.
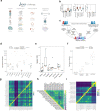
Fig. 1.. Overview of the Long-read RNA-seq Genome Annotation Assessment Project (LRGASP).
a, Data produced for LRGASP consists of multiple species, multiple sample types, multiple library protocols, and multiple sequencing platforms for comparison. b, Distribution of read lengths, identify Q score, and sequencing depth (per biological replicate) for the WTC11 sample. c, LRGASP as an open research community effort for benchmarking and evaluating long-read RNA-seq approaches. d, Number of isoforms reported by each tool on different data types for the human WTC11 sample for Challenge 1. e, Median TPM value reported by each tool on different data types for the human WTC11 sample for Challenge 2. f, Number of isoforms reported by each tool on different data types for the mouse ES data for Challenge 3. g, Pairwise relative overlap of unique junction chains (UJCs) reported by each submission. The UJCs reported by a submission is used as a reference set for each row. The fraction of overlap of UJCs from the column submission is shown as a heatmap. For example, a submission that has a small, subset of many other UJCs from other submissions will have a high fraction shown in the rows, but low fraction by column for that submission. Data only shown for WTC11 submissions. h, Spearman correlation of TPM values between submissions to Challenge 2. i, Pairwise relative overlap of UJCs reported by each submission. The UJCs reported by a submission is used as a reference set for each row. The fraction of overlap of UJCs from the column submission is shown as a heatmap.
Figure 2:
Figure 2:. Overview of evaluation for Challenge 1: transcript identification with a reference annotation.
a) Number of genes and transcripts per submission. Abundance of the main structural categories and support by external data. b) Agreement in transcript detection as a function the number of detecting pipelines. c) Performance based on for spliced-short and unspliced-long SIRVs. d) Performance based on simulated data. e) Performance for known and novel transcripts based on 50 manually-annotated genes by GENCODE. Ba: Bambu, FM: Flames, FR: FLAIR, IQ: IsoQuant, IT: IsoTools, IB: Iso_IB, Ly: LyRic, Ma: Mandalorion, TL: TALON-LAPA, Sp: Spectra, ST: StringTie2.
Fig. 3.
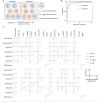
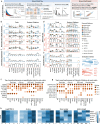
Fig. 3.. Overview of performance evaluation for Challenge 2: transcript isoform quantification.
(a) Cartoon diagrams are used to explain 9 evaluation metrics under the ground truth given or not given. (b) - (e) Overall evaluation results of 8 quantification tools and 7 protocols-platforms on real data with multiple replicates, cell mixing experiment, SIRV-set4 data and simulation data. (f) - (g) Top-4 overall performance on quantification tools and protocols-platforms for each metric. (h) Evaluation of quantification tools with respect to multiple transcript features, including the number of isoforms, number of exons, isoform length and a customized statistic K-value representing the complexity of exon-isoform structures. Here, we use the normalized MRD metric to evaluate performance on human cDNA-PacBio simulation data. Additionally, we show RSEM evaluation results with respect to transcript features based on human short-read simulation data as a control.
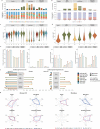
Figure 4.
Figure 4.. Evaluation of Challenge 3: transcript identification without a reference annotation.
a) Number of detected transcripts and distribution of SQANTI structural categories, Mouse ES sample. b) Number of detected transcripts and distribution of transcripts per loci, Manatee sample. c) Length distribution of Mouse ES transcripts predictions. d) Length distribution of Manatee transcripts predictions. e) Support by orthogonal data. f) BUSCO metrics. g) Performance metrics based on SIRVs. Sen: Sensitivity, PDR: Positive Detection Rate, Pre: Precision, nrPred: non-redundant Precision, FDR: False Discovery Rate, 1/Red: Inverse of Redundancy.
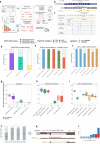
Figure 5.
Figure 5.. Experimental validation of known and novel isoforms.
a) Schematic for the experimental validation pipeline. b) Example of a consistently detected NIC isoform (detected in over half of all LRGASP pipeline submissions) which was successfully validated by targeted PCR. The primer set amplifies a novel event of exon skipping (NIC). Only transcripts above ~5 CPM and and part of the GENCODE Basic annotation are shown. c) Example of a successfully validated novel terminal exon, with ONT amplicon reads shown in the IGV track (PacBio produce similar results). d) Recovery rates for GENCODE annotated isoforms that are reference-matched (known), novel, and rejected. e) Recovery rates for consistently versus rarely detected isoforms, for known and novel isoforms. f) Recovery rates between isoforms that are more frequently identified in ONT versus PacBio pipelines. g-i) Relationship between estimated transcript abundances (calculated as the sum of reads across all WTC11 sequencing samples) and validation success for GENCODE (g), consistent versus rare (h), and platform-preferential (i) isoforms. j) Fraction of validated transcripts as a function of the number of WTC11 samples in which supportive reads were observed. k) Example of two de novo isoforms in Manatee validated through isoform-specific PCR amplification, blue corresponds to supported transcripts and red to unsupported transcripts. l) PCR validation results for manatee isoforms for seven target genes.

References

    1. Au K. F. et al. Characterization of the human ESC transcriptome by hybrid sequencing. Proc. Natl. Acad. Sci. U. S. A. 110, E4821–30 (2013). - PMC - PubMed
    1. Sharon D., Tilgner H., Grubert F. & Snyder M. A single-molecule long-read survey of the human transcriptome. Nat. Biotechnol. 31, 1009–1014 (2013). - PMC - PubMed
    1. Weirather J. L. et al. Comprehensive comparison of Pacific Biosciences and Oxford Nanopore Technologies and their applications to transcriptome analysis. F1000Res. 6, 100 (2017). - PMC - PubMed
    1. Garalde D. R. et al. Highly parallel direct RNA sequencing on an array of nanopores. Nat. Methods 15, 201–206 (2018). - PubMed
    1. Byrne A., Cole C., Volden R. & Vollmers C. Realizing the potential of full-length transcriptome sequencing. Philos. Trans. R. Soc. Lond. B Biol. Sci. 374, 20190097 (2019). - PMC - PubMed

Publication types