[Preprint]. 2023 Jul 28:2023.07.25.550554.
doi: 10.1101/2023.07.25.550554.

Dopaminoceptive D1 and D2 neurons in ventral hippocampus arbitrate approach and avoidance in anxiety

Affiliations

Dopaminoceptive D1 and D2 neurons in ventral hippocampus arbitrate approach and avoidance in anxiety

Arthur Godino et al. bioRxiv. .

Update in

Abstract

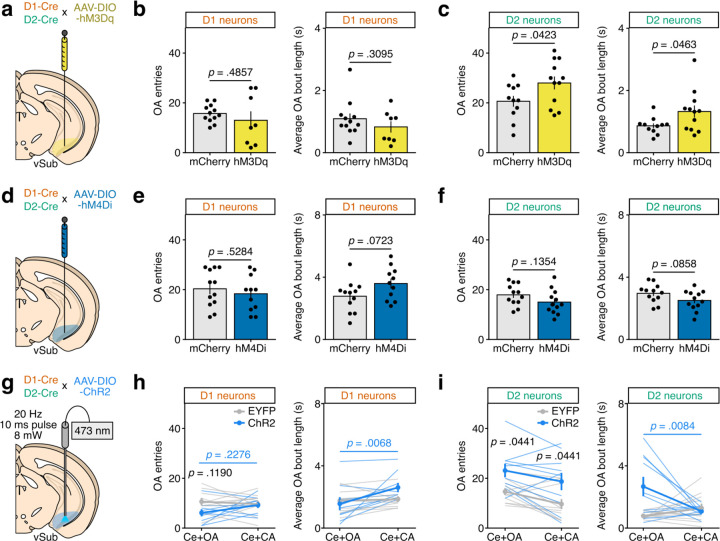
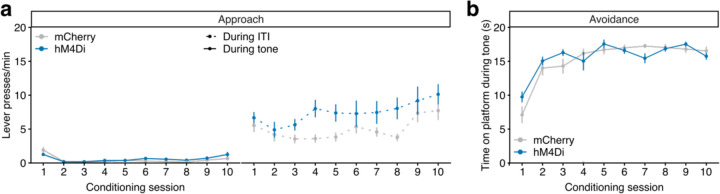
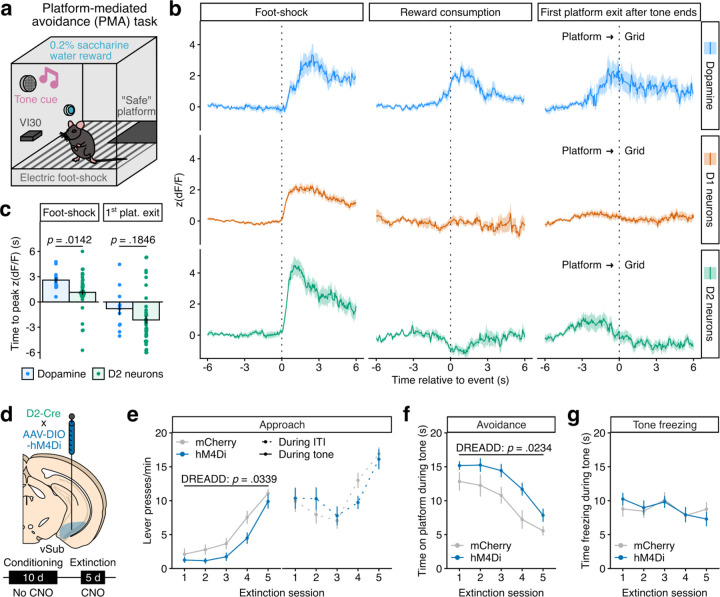
The hippocampus 1-7, as well as dopamine circuits 8-11, coordinate decision-making in anxiety-eliciting situations. Yet, little is known about how dopamine modulates hippocampal representations of emotionally-salient stimuli to inform appropriate resolution of approach versus avoidance conflicts. We here study dopaminoceptive neurons in mouse ventral hippocampus (vHipp), molecularly distinguished by their expression of dopamine D1 or D2 receptors. We show that these neurons are transcriptionally distinct and topographically organized across vHipp subfields and cell types. In the ventral subiculum where they are enriched, both D1 and D2 neurons are recruited during anxiogenic exploration, yet with distinct profiles related to investigation and behavioral selection. In turn, they mediate opposite approach/avoidance responses, and are differentially modulated by dopaminergic transmission in that region. Together, these results suggest that vHipp dopamine dynamics gate exploratory behaviors under contextual uncertainty, implicating dopaminoception in the complex computation engaged in vHipp to govern emotional states.


Conflict of interest statement

Ethics declarations Competing interests The authors declare no competing interests.

Figures

Extended Data Fig. 1:
Extended Data Fig. 1:. Fluorescence-Activated Nuclei Sorting (FANS) of D1 and D2 vHipp cells.
a, Representative FANS gating strategy from a D1-Cre x fl/fleGFP::L10a male sample. b, Summary of FAN-sorting hierarchical gating strategy. c, Percent of GFP-positive nuclei for all D1-Cre and D2-Cre x fl/fleGFP::L10a sorted samples.
Extended Data Fig. 2:
Extended Data Fig. 2:. Sample integration and cell-type annotation of snRNAseq clusters.
a, Proportion of all nuclei in individual clusters. b, Sample integration highlighting intermingled contribution of nuclei originating in each sample to clusters. c, D1-sorted or D2-sorted origin of individual nuclei, quantified in Fig. 2c. d, Expression of published marker genes for different cell types across clusters. Note the absence of cluster enriching for marker genes of DG granule cells and CA3 pyramidal neurons. Full lists of cluster marker genes available in Supplementary Information Table 1.
Extended Data Fig. 3:
Extended Data Fig. 3:. Viral targeting of vSub.
a, Representative image of AAV-DIO-EYFP expression in the vSub of a D1-Cre male mouse. Dotted line depicts placement of an optogenetic fiber optic. b, Representative image of AAV-DIO-EYFP expression in the vSub of a D2-Cre male mouse. Animals with significant somatic expression in neighboring entorhinal cortex (<10%) were removed from analysis. Scale bars 500 µm.
Extended Data Fig. 4:
Extended Data Fig. 4:. Additional analyses of calcium imaging of vHipp D1 and D2 neuronal activity during EPM testing.
a, Average GCaMP6s signal in D1-Cre (left) and D2-Cre (right) mice during exits from the open arm (OA, blue) or closed arm as a control (CA, red). Only traces when the mouse did a complete open/closed arm to center (Ce) to closed arm are used for averaging. b, Average GCaMP6s signal in D1-Cre (red) and D2-Cre (green) mice around head-dips outside the EPM apparatus event with unclear outcome. Boxplot represents the median time ± inter-quartile range of the times of maximal acceleration (max. acc.) after each head-dip, indicating movement initiation. c, Quantification of maximum (peak) GCaMP6s signal before (pre) or after (post) each head-dip event (statistics in Fig. 3). d, Quantification of GCaMP6s signal change slope after head-dip events. LMM-ANOVA: cell type F1,23.29 = 1.29 p = 0.2679, outcome F2,380.68 = 6.90 p = 0.0011, cell type x outcome F2,380.68 = 28.50 p < 0.0001; followed by FDR-adjusted post-hoc tests. e, Quantification of the time delay between the time of maximal GCaMP6s signal change (max. slope) and the time of movement initiation (max. acc.). LMM-summary: intercept ≠ 0 t67.07 = −3.68 p = 0.0005, and LMM-ANOVA: cell type F1,23.10 = 0.0053 p = 0.9427, outcome F2,383.84 = 0.19 p = 0.8241, cell type x outcome F2,383.84 = 0.46 p = 0.6310; followed by individual LMM-summary for intercept ≠ 0 for each cell type x outcome combination and FDR adjustment of p-values. f, Classification of unclear-outcome head-dips using a SVM trained on manually-annotated avoid/explore D1 and D2 time-series. Both average GCaMP6s signal (top) and heatmaps of individual time-series (bottom) are represented for both D1 and D2 signals, split by SVM outcome prediction. Data represented as mean ± sem.
Extended Data Fig. 5:
Extended Data Fig. 5:. Effects of CNO itself on EPM behavior.
Wild-type male mice were injected i.p. with CNO (3 mg/kg, n = 10) or vehicle (n = 10) 15 min before EPM testing. a, Quantification of open arm exploration time. Welch’s t-test: t14.65 = −0.061 p = 0.9523. b, Quantification of the total number of open arm entries (left; Welch’s t-test: t17.99 = −0.53 p = 0.6045) and of the average time of each open arm exploration bout (right; Welch’s t-test: t17.26 = −0.057 p = 0.9548).
Extended Data Fig. 6:
Extended Data Fig. 6:. Additional analyses of chemogenetic and optogenetic manipulation of vHipp D1 and D2 neurons during EPM testing.
a, Experimental schematic. Male D1-Cre and D2-Cre mice were injected in vSub with an AAV-DIO-hM3Dq (n = 8 D1, n = 12 D2) or a control AAV-DIO-mCherry (n = 12 D1, n = 11 D2). CNO (3 mg/kg) was administered i.p. to all animals 15 min before testing. b, Quantification of the total number of open arm entries (left; Welch’s t-test: t8.16 = 0.73 p = 0.4857) and of the average time of each open arm exploration bout (right; Welch’s t-test: t16.42 = 1.05 p = 0.3095) for D1-Cre mice. c, Quantification of the total number of open arm entries (left; Welch’s t-test: t20.68 = −2.16 p = 0.0423) and of the average time of each open arm exploration bout (right; Welch’s t-test: t14.63 = −2.18 p = 0.0463) for D2-Cre mice. d, Experimental schematic. Male D1-Cre and D2-Cre mice were injected in vSub with an AAV-DIO-hM4Di (n = 11 D1, n = 12 D2) or a control AAV-DIO-mCherry (n = 12 D1, n = 12 D2). CNO (3 mg/kg) was administered i.p. to all animals 15 min before testing. e, Quantification of the total number of open arm entries (left; Welch’s t-test: t20.94 = 0.64 p = 0.5284) and of the average time of each open arm exploration bout (right; Welch’s t-test: t20.60 = −1.89 p = 0.0723) for D1-Cre mice. f, Quantification of the total number of open arm entries (left; Welch’s t-test: t21.68 = 1.55 p = 0.1354) and of the average time of each open arm exploration bout (right; Welch’s t-test: t21.93 = 1.80 p = 0.0858) for D2-Cre mice. g, Experimental schematic. Male D1-Cre and D2-Cre mice were injected in vSub with an AAV-DIO-ChR2 (n = 9 D1, n = 10 D2) or a control AAV-DIO-EYFP (n = 10 D1, n = 11 D2). Optogenetic stimulation (473 nm laser, 8 mW, 20 Hz, 10 ms pulses) was delivered when the animal was either in the center or open arm (Ce+OA) or in the center and closed arm (Ce+CA) in a within-subject design. h, Quantification of the total number of open arm entries (left; LMM-ANOVA: stimulation zone F1,17 = 0.67 p = 0.4232, virus F1,17 = 2.63 p = 0.1234, stimulation zone x virus F1,17 = 2.55 p = 0.1284; followed by FDR-adjusted post-hoc tests) and of the average time of each open arm exploration bout (right; LMM-ANOVA: stimulation zone F1,17 = 8.88 p = 0.0084, virus F1,17 = 0.58 p = 0.4580, stimulation zone x virus F1,17 = 5.8529 p = 0.0271; followed by FDR-adjusted post-hoc tests) for D1-Cre mice. i, Quantification of the total number of open arm entries (left; LMM-ANOVA: stimulation zone F1,19 = 8.70 p = 0.0082, virus F1,19 = 7.94 p = 0.0110, stimulation zone x virus F1,19 = 0.036 p = 0.8526; followed by FDR-adjusted post-hoc tests) and of the average time of each open arm exploration bout (right; LMM-ANOVA: stimulation zone F1,19 = 2.62 p = 0.1221, virus F1,19 = 6.1645 p = 0.0225, stimulation zone x virus F1,19 = 9.55 p = 0.0060; followed by FDR-adjusted post-hoc tests) for D2-Cre mice. Data represented as mean ± sem.
Extended Data Fig. 7:
Extended Data Fig. 7:. Chemogenetic manipulation of vHipp D1 and D2 neurons during anxiety-related testing.
a, Experimental schematic. Male D1-Cre and D2-Cre mice were injected in vSub with an AAV-DIO-hM3Dq (n = 11 D1, n = 12 D2) or a control AAV-DIO-mCherry (n = 11 D1, n = 11 D2), and another cohort was injected with either an AAV-DIO-hM4Di (n = 11 D1, n = 12 D2) or a control AAV-DIO-mCherry (n = 11 D1, n = 12 D2). CNO (3 mg/kg) was administered i.p. to all animals 15 min before testing in an open-field test (OFT) for the first cohort and for novelty-suppressed feeding (NSF) for the second. b, Quantification of total locomotor activity in OFT for D1-Cre (left; Welch’s t-test: t13.25 = −2.52 p = 0.0253) and D2-Cre (right; Welch’s t-test: t20.99 = 0.08 p = 0.9374) mice. c, Quantification of time spent in the center of an OFT for D1-Cre (left; Welch’s t-test: t18.84 = 2.6052 p = 0.0175) and D2-Cre (right; Welch’s t-test: t19.62 = −0.63 p = 0.5379) mice. d, Quantification of the latency to the first feeding bout during NSF testing for D1-Cre (left; Welch’s t-test: t18.31 = 0.51 p = 0.6171) and D2-Cre (right; Welch’s t-test: t21.82 = −2.32 p = 0.0303) mice. Data represented as mean ± sem.
Extended Data Fig. 8:
Extended Data Fig. 8:. In vivo dopamine sensing in vSub – other sensors and sensor comparisons.
a, Experimental schematic. Male mice were injected in vSub with an AAV-dLight-1.1 (n = 15, Fig. 5), an AAV-GRABDA-1h (n = 15), an AAV-RdLight-1 (n = 6) or with a control AAV-GFP (n = 8, Fig. 5) and implanted with optical fibers before recording during EPM testing. b, Representative traces during EPM exploration for a GRABDA-1h (top) and RdLight-1 (bottom) animal. c, Spatially averaged fluorescence signal in the EPM for all GRABDA-1h (top-left) and all RdLight-1 (bottom-right) mice. d, Average GRABDA-1h (top) and RdLight-1 (bottom) signal during entries to (left) and exits from (right) the open arm (OA, blue) or closed arm as a control (CA, red). Only traces when the mouse did a complete closed arm to center (Ce) to open/closed arm are used for averaging. e, Average area under the curve (AUC) by EPM compartment for GRABDA-1h (left) and RdLight-1 (right) mice. LMM-ANOVA: compartment F2,80 = 49.82 p < 0.0001, sensor F3,40 = 1.70 p = 0.1822, compartment x sensor F6,80 = 5.1529 p = 0.0002; followed by FDR-adjusted post-hoc tests. f, Average control GFP signal during entries to (left) and exits from (right) the OA (blue) or CA as a control (red). g, Quantification of in vivo dynamic range for all three dopamine sensors used in this study, calculated as the difference between maximum and minimum z(dF/F) reached during recording for each animal. LMM-ANOVA: sensor F2 = 3.51 p = 0.0414; followed by FDR-adjusted post-hoc tests. Data represented as mean ± sem.
Extended Data Fig. 9:
Extended Data Fig. 9:. vSub dopamine, D1 and D2 correlates of approach and avoidance in the PMA task.
a, Quantification of peri-event photometry signal changes shown in Fig. 6, measured as the maximum (peak) z(dF/F) value reached within successive 1.5 s-long time-bins. All were analyzed with LMM-ANOVA for the time-bin factor and followed by FDR-adjusted post-hoc tests. All pairwise comparisons were computed but only the ones significant versus the first 1.5 s time-bin are represented for clarity (~ p < 0.1, * p < 0.05, ** p < 0.01, *** p < 0.001). Foot-shock, DA: F7,80.86 = 19.69 p < 0.0001. Foot-shock, D1: F7,548.52 = 66.88 p < 0.0001. Foot-shock, D2: F7,302.07 = 46.81 p < 0.0001. Reward, DA: F7,133 = 12.29 p < 0.0001. Reward, D1: F7,70 = 0.67 p = 0.7005. Reward, D2: F7,70 = 3.09 p = 0.0068. First platform exit, DA: F7,70 = 3.57 p = 0.0024. First platform exit, D1: F7,311.15 = 0.91 p = 0.4989. First platform exit, D2: F7,262.51 = 9.9281 p < 0.0001. b, Correlation between RdLight-1 and D2-GCaMP6s signals in one D2-Cre mouse injected in vSub with both an AAV-DIO-GCaMP6s and an AAV-RdLight-1 and recorded with dual color photometry, around foot-shocks (left; Pearson’s r = −0.23 p < 0.0001), reward consumption (middle; Pearson’s r = −0.40 p < 0.0001) and first platform exit after tone end (right; Pearson’s r = −0.37, p < 0.0001). For bar graphs, data represented as mean ± sem, with shaded lines representing individual events. For correlation graphs, regression lines are shown with their 95% confidence intervals.
Extended Data Fig. 10:
Extended Data Fig. 10:. Chemogenetic manipulation of vSub D2 neurons in the PMA task – acquisition behaviors.
Male D2-Cre mice were injected in vSub with an AAV-DIO-hM4Di (n = 9) or a control AAV-DIO-mCherry (n = 11). a, Approach behavior during conditioning sessions, measured as the lever pressing rate in responses per minute during tone presentation (left; LMM-ANOVA: session F9,162 = 10.30 p < 0.0001, DREADD F1,18 = 1.03 p = 0.3227, session x DREADD F9,162 = 1.54 p = 0.1373) or during inter-tone intervals (ITI; right; LMM-ANOVA: session F9,162 = 5.50 p < 0.0001, DREADD F1,18 = 4.12 p = 0.0575, session x DREADD F9,162 = 1.11 p = 0.3589). b, Avoidance behavior during conditioning sessions, measured as the time spent on the platform during the 20 s tone. LMM-ANOVA: session F9,162 = 26.31 p < 0.0001, DREADD F1,18 = 0.44 p = 0.5170, session x DREADD F9,162 = 1.91 p = 0.05385. Data represented as mean ± sem.
Fig. 1:
Fig. 1:. Topography of vHipp D1 and D2 cells.
Representative confocal images of the vHipp of a D1-Cre (a) and D2-Cre (b) x fl/fleGFP::L10a male mouse. D1 cells are GFP-positive, shown here in pseudo-red color for clarity. Scale bars 500 µm. Abbreviations: AP antero-posterior from Bregma, DG dentate gyrus, mo molecular layer, gc granule cell layer, hil hilus, slm stratum lacunosum moleculare, sr stratum radiatum, py pyramidal cell layer, so stratum oriens.
Fig. 2:
Fig. 2:. Transcriptional phenotypes of vHipp D1 and D2 cells.
a, Workflow for snRNAseq of vHipp from male D1-Cre and D2-Cre x fl/fleGFP::L10a (n = 4/genotype). b, Clustering and UMAP reduction across all samples (n = 11,452 D1 and n = 18,158 D2 nuclei) followed by cluster-cell type annotation. c, Proportion of nuclei originating from FANS-isolated D1 and D2 samples per cluster, normalized to total D1 and D2 nuclei counts. d, Expression of Drd1, Drd2, Drd3, Drd4 and Drd5 dopamine receptor genes across D1 and D2 nuclei. e, Expression of dopamine receptor Drd1 and Drd2 genes in individual nuclei. Nuclei are considered as co-expressing D1 and D2 receptors (yellow) either if both Drd1 and Drd2 are detected, if Drd1 is detected in a D2-sorted nucleus or if Drd2 is detected in a D1-sorted nucleus. Insert shows the repartition of the small (<0.5%) population of D1-D2 co-expressing nuclei across clusters. f, Number of differentially expressed genes (DEGs, >20% expression change and FDR-adjusted p < 0.05) between D1 and D2 nuclei per individual cell type clusters. g, Union heatmaps and hierarchical clustering of D1 versus D2 DEGs in different vHipp cell types. DEG clusters/patterns A and C contain genes respectively enriched in D1 and D2 nuclei across cell types (pan-GABAergic or pan-glutamatergic nuclei). h, Expression across D1 and D2 nuclei of neurotransmitter and neuromodulator receptor genes selected from either D1-enriched (Htr1f, Gabrg3) or D2-enriched (Grm7, Grm8, Grin2a) pan-GABAergic and pan-glutamatergic DEG patterns. Abbreviations: INs interneurons, PNs pyramidal neurons, LQPNs low sequencing quality pyramidal neurons, CCK cholecystokinin, NPY neuropeptide Y, PV parvalbumin, SST somatostatin, O-Bi oriens – bistratified, O-LM stratum oriens / stratum lacunosum moleculare, R-LM stratum radiatum / stratum radiatum border, DG dentate gyrus, MGE medial ganglionic eminence-derived, CGE central ganglionic eminence-derived, NGF neurogliaform.
Fig. 3:
Fig. 3:. Calcium imaging of vSub D1 and D2 neuronal activity during EPM testing.
a, Experimental schematic. Male D1-Cre (n = 11) and D2-Cre (n = 10) mice were injected with an AAV-DIO-GCaMP6s in vSub and implanted with optical fibers before recording in an EPM task. b, Representative GCaMP6s signal during EPM exploration from a D1-Cre (top) and D2-Cre (bottom) mouse. c, Spatially averaged GCaMP6s signal in the EPM for all D1-Cre (top-left) and all D2-Cre (bottom-right) mice. d, Average GCaMP6s signal in D1-Cre (left) or D2-Cre (right) mice during entries in the open arm (OA, blue) or closed arm as a control (CA, red). Only traces when the mouse did a complete closed arm to center (Ce) to open/closed arm are used for averaging. e, Average area under the curve (AUC) signal quantification by EPM compartment for D1-Cre (left) and D2-Cre (right) mice. LMM-ANOVA: compartment F2,38 = 255.19 p < 0.0001, cell type F1,19 = 0.10 p = 0.7533, compartment x cell type F2,38 = 2.72 p = 0.0785; followed by FDR-adjusted post-hoc tests. f, Average GCaMP6s signal in D1-Cre (red) or D2-Cre (green) mice around head-dips outside the EPM apparatus event, manually annotated based on outcome mouse behavior: aborted exploration and avoidance (left, red) or continued investigation and exploration (right, blue). Events with unclear outcome are included in analysis but shown in Extended Data Fig. 4. Boxplots represent the median time ± inter-quartile range of the times of maximal acceleration (max. acc.) after each head-dip, indicating movement initiation. g, Quantification of maximum (peak) GCaMP6s signal before (pre) or after (post) each head-dip event. LMM-ANOVA: cell type F1,22.22 = 0.27 p = 0.6069, outcome F2,375.77 = 7.06 p = 0.0010, pre-post F1,385 = 84.64 p < 0.0001, cell type x outcome F2,375.77 = 16.74 p < 0.0001, cell type x pre-post F1,385 = 0.17 p = 0.6775, outcome x pre-post F2,385 = 11.69 p < 0.0001, cell type x outcome x pre-post F2,385 = 34.37 p < 0.0001; followed by FDR-adjusted post-hoc tests. h, Unsupervised hierarchical clustering of GCaMP6s head-dip time-series for D1 (left, n = 190) and D2 (right, n = 138) neurons, pictured as signal intensity heatmaps, split into patterns A (transient activation), B (robust, sustained activation) and C (inhibition). Pie charts depict the relative proportion of avoid(av)/explore(ex) behavioral outcomes in each pattern, for each cell type, along with FDR-adjusted p-values corresponding to standardized Pearson’s residuals after χ2 tests (D1 neurons: χ2 = 6.68, df = 2, p = 0.0355; D2 neurons: χ2 = 45.608, df = 2, p < 0.0001). Dotted line indicates theoretical proportions. i, Conceptual schematic for supervised binary linear classification of D1 and D2 time-series using support vector machines (SVM) with 5-fold cross validation (CV). For each iteration, the whole dataset was randomly split into training (75%) and testing (25%) sets. j, SVM classifier accuracy for D1 and D2 time-series. Welch’s t-tests: D1 versus D2 t16.16 = −8.52 p < 0.0001; D1 versus chance (50%) t9 = 2.71 p = 0.0242; D2 versus chance (50%) t9 = 12.33 p < 0.0001; followed by FDR adjustment. Data represented as mean ± sem.
Fig. 4:
Fig. 4:. Chemogenetic and optogenetic manipulation of vSub D1 and D2 neurons during EPM testing.
a, Experimental schematic. Male D1-Cre and D2-Cre mice were injected in vSub with an AAV-DIO-hM3Dq (n = 8 D1, n = 12 D2) or a control AAV-DIO-mCherry (n = 12 D1, n = 11 D2). CNO (3 mg/kg) was administered i.p. to all animals 15 min before testing. b, Representative examples of EPM exploration from D1-Cre mice (left) and quantification of open arm (OA) exploration time (right). Welch’s t-test: t14.86 = 2.1775 p = 0.0460. c, Representative examples of EPM exploration from D2-Cre mice (left) and quantification of open arm exploration time (right). Welch’s t-test: t16.65 = −2.8063 p = 0.0123. d, Experimental schematic. Male D1-Cre and D2-Cre mice were injected in vSub with an AAV-DIO-hM4Di (n = 11 D1, n = 12 D2) or a control AAV-DIO-mCherry (n = 12 D1, n = 12 D2). CNO (3 mg/kg) was administered i.p. to all animals 15 min before testing. e, Representative examples of EPM exploration from D1-Cre mice (left) and quantification of open arm exploration time (right). Welch’s t-test: t16.97 = −0.967 p = 0.3471. f, Representative examples of EPM exploration from D2-Cre mice (left) and quantification of open arm exploration time (right). Welch’s t-test: t21.43 = 2.5307 p = 0.0193. g, Experimental schematic. Male D1-Cre and D2-Cre mice were injected in vSub with an AAV-DIO-ChR2 (n = 9 D1, n = 10 D2) or a control AAV-DIO-EYFP (n = 10 D1, n = 11 D2). Optogenetic stimulation (473 nm laser, 8 mW, 20 Hz, 10 ms pulses) was delivered when the animal was either in the center or open arm (Ce+OA) or in the center and closed arm (Ce+CA) in a within-subject design. h, Representative examples of EPM exploration from D1-Cre mice (left) and quantification of open arm exploration time (right). LMM-ANOVA: stimulation zone F1,17 = 6.21 p = 0.0233, virus F1,17 = 0.26 p = 0.6145, stimulation zone x virus F1,17 = 6.72 p = 0.0190; followed by FDR-adjusted post-hoc tests. i, Representative examples of EPM exploration from D2-Cre mice (left) and quantification of open arm exploration time (right). LMM-ANOVA: stimulation zone F1,19 = 9.34 p = 0.0065, virus F1,19 = 8.96 p = 0.0075, stimulation zone x virus F1,19 = 7.68 p = 0.0121; followed by FDR-adjusted post-hoc tests. Data represented as mean ± sem.
Fig. 5:
Fig. 5:. In vivo dopamine sensing and ex vivo dopamine pharmacology in vSub.
a, Experimental schematic. Male mice were injected in vSub with an AAV-dLight-1.1 (n = 15), an AAV-GRABDA-1h (n = 15, Extended Data Fig. 8), an AAV-RdLight-1 (n = 6, Extended Data Fig. 8) or with a control AAV-GFP (n = 8) and implanted with optical fibers before recording during EPM testing. b, Representative traces during EPM exploration for a dLight-1.1 (top) and control GFP (bottom) animal. c, Spatially averaged fluorescence signal in the EPM for all dLight-1.1 (top-left) and all GFP (bottom-right) mice. d, Average dLight-1.1 signal during entries to (left) and exits from (right) the open arm (OA, blue) or closed arm as a control (CA, red). Only traces when the mouse did a complete closed arm to center (Ce) to open/closed arm are used for averaging. e, Average area under the curve (AUC) by EPM compartment for dLight-1.1 (left) and GFP (right) mice. LMM-ANOVA: compartment F2,80 = 49.82 p < 0.0001, sensor F3,40 = 1.70 p = 0.1822, compartment x sensor F6,80 = 5.1529 p = 0.0002; followed by FDR-adjusted post-hoc tests. f, Experimental schematic for slice electrophysiological recordings from vCA1/vSub D1 or D2 pyramidal neurons identified in D1-Cre or D2-Cre x fl/fleGFP::L10a male mice. g, Representative traces of resting membrane potential before, during and after bath application of dopamine (DA, 10 µM) or of the D1 agonist SKF81297 (SKF, 50 µM) onto D1 neurons (top), or of dopamine (DA, 10 µM) or of the D2 agonist quinpirole (Quin, 10 µM) onto D2 neurons (bottom). h, Quantification of resting membrane potential changes between baseline (BL), drug application and after wash (W). LMM-ANOVA: cell type F1,5.8 = 0.90 p = 0.3805, agonist F1,18.7 = 0.40 p = 0.5366, application period F2,37.0 = 17.73 p < 0.0001, cell type x agonist F1,18.7 = 0.51 p = 0.4851, cell type x application period F2,37.0 = 16.39 p < 0.0001, agonist x application period F2,37.0 = 0.23 p = 0.7972, cell type x agonist x application period F2,37.0 = 0.02 p = 0.9821; followed by FDR-adjusted post-hoc tests. Data represented as mean ± sem.
Fig. 6:
Fig. 6:. vSub dopamine, D1 and D2 correlates of approach and avoidance in the PMA task.
a, Experimental schematic of the PMA task (see Methods for detailed description). b, Fiber photometry recordings in male mice injected in vSub with an AAV-RdLight-1 (top, n = 2), or D1-Cre (middle, n = 13) and D2-Cre (bottom, n = 8) mice injected with an AAV-DIO-GCaMP6s and implanted with optical fibers before recording in the PMA task. Average signal traces are centered around the onset of the electric foot-shock, when the mouse is on the grid (left), the entry into the reward magazine for reward consumption (middle) or the exit from the platform towards the grid, the first time after the tone and shock end if the mouse was on the platform (right). Quantification and statistics in Extended Data Fig. 9. c, Times of peak photometry RdLight-1 and D2-GCaMP6s signals after foot-shock (left, LMM-ANOVA: sensor F1 = 6.41 p = 0.0142) and first platform exit (right, LMM-ANOVA: sensor F1 = 1.81 p = 0.1846). d, Experimental schematic. Male D2-Cre mice were injected in vSub with an AAV-DIO-hM4Di (n = 9) or a control AAV-DIO-mCherry (n = 11). PMA training was run for 10 days without CNO treatment, then CNO (3 mg/kg) was administered i.p. to all animals 15 min before testing under extinction conditions (no shock) for 5 days. e, Approach behavior (lever presses) during extinction sessions, both during tone presentation (left; LMM-ANOVA: session F4,72 = 64.75 p < 0.0001, DREADD F1,18 = 5.27 p = 0.0339, session x DREADD F4,72 = 0.83 p = 0.5099) and inter-trial intervals (ITI, right; LMM-ANOVA: session F4,72 = 22.15 p < 0.0001, DREADD F1,18 = 0.006 p = 0.9379, session x DREADD F4,72 = 2.03 p = 0.0994). f, Avoidance behavior (time on platform) during extinction sessions (LMM-ANOVA: session F4,72 = 26.69, p < 0.0001, DREADD F1,18 = 6.13 p = 0.0234, session x DREADD F4,72 = 0.57 p = 0.6858). g, Freezing upon tone presentation during extinction sessions (LMM-ANOVA: session F4,72 = 4.25 p = 0.0038, DREADD F1,18 = 0.003 p = 0.9570, session x DREADD F4,72 = 1.45 p = 0.2278). Data represented as mean ± sem.

References

    1. Gray J. A. Précis of The neuropsychology of anxiety: An enquiry into the functions of the septo-hippocampal system. Behav. Brain Sci. 5, 469–484 (1982).
    1. Gray J. A. The psychology of fear and stress. (Cambridge ; New York: : Cambridge University Press, 1987).
    1. Moser M. B. & Moser E. I. Functional differentiation in the hippocampus. Hippocampus 8, 608–619 (1998). - PubMed
    1. Fanselow M. S. & Dong H.-W. Are the Dorsal and Ventral Hippocampus Functionally Distinct Structures? Neuron 65, 7–19 (2010). - PMC - PubMed
    1. Strange B. A., Witter M. P., Lein E. S. & Moser E. I. Functional organization of the hippocampal longitudinal axis. Nat. Rev. Neurosci. 15, 655–669 (2014). - PubMed

Publication types