[Preprint]. 2024 Sep 9:2023.07.23.550157.
doi: 10.1101/2023.07.23.550157.

Tracing the evolution of single-cell cancer 3D genomes: an atlas for cancer gene discovery

Affiliations

Tracing the evolution of single-cell cancer 3D genomes: an atlas for cancer gene discovery

Miao Liu et al. bioRxiv. .

Update in

Abstract

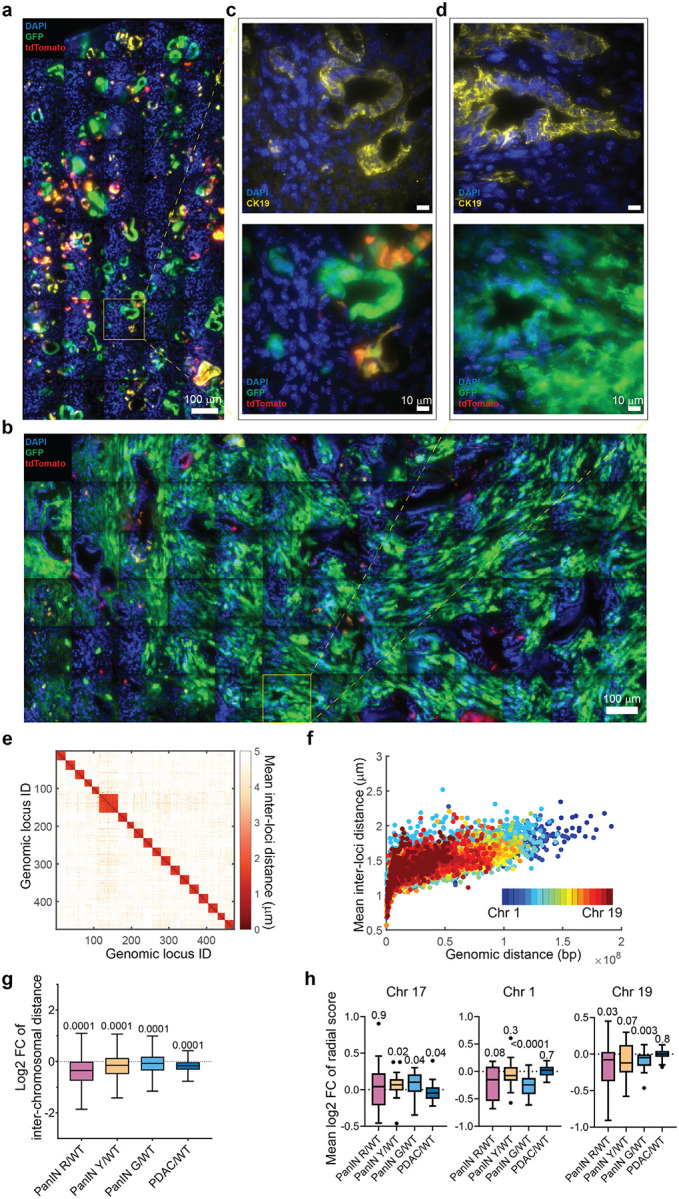
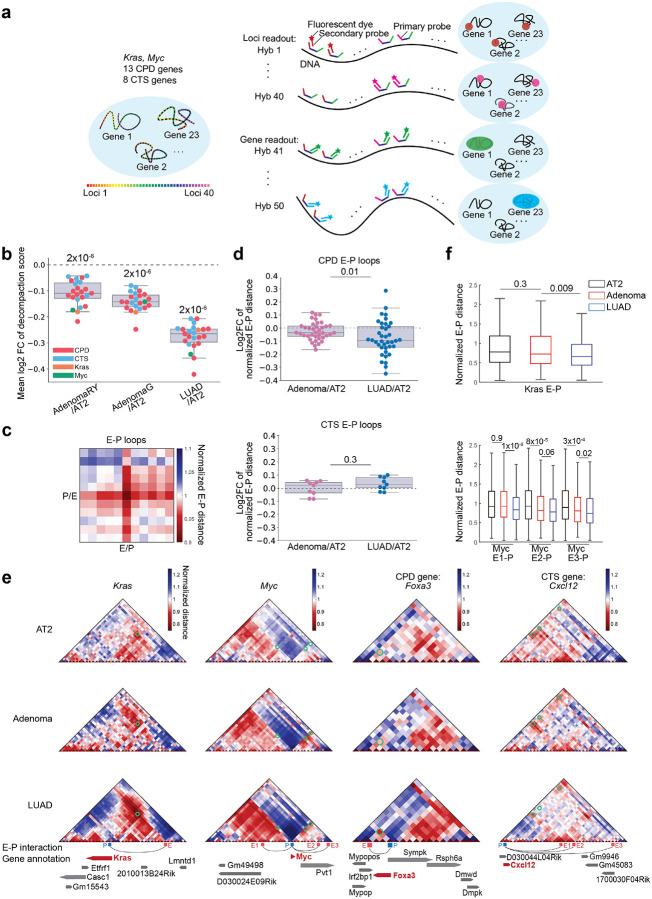
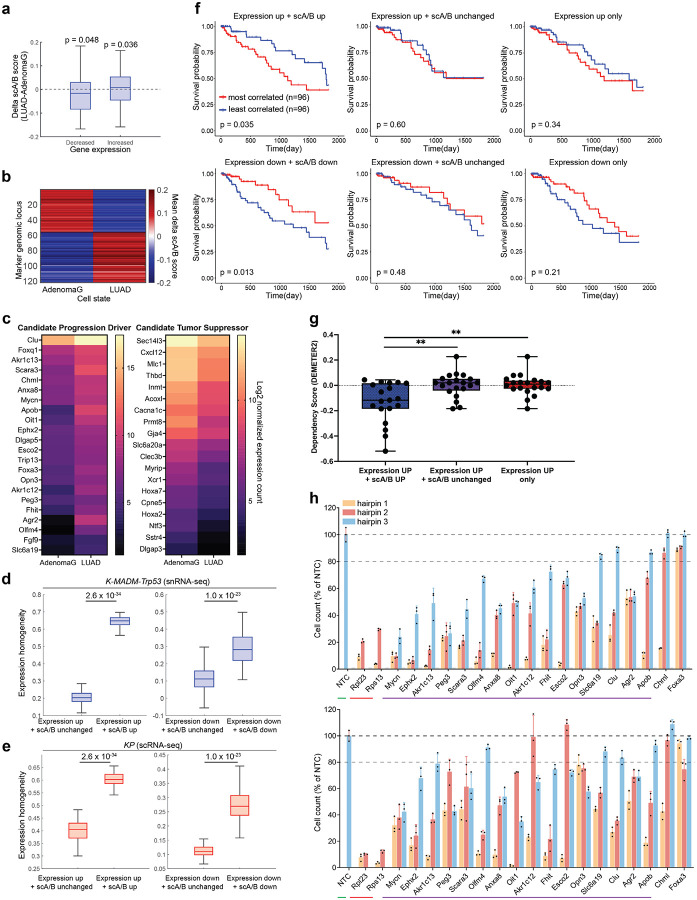
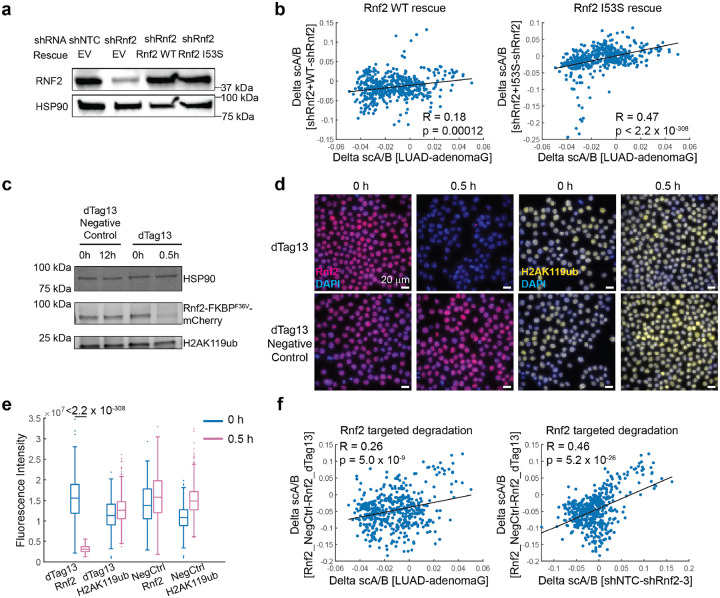
Although three-dimensional (3D) genome structures are altered in cancer cells, little is known about how these changes evolve and diversify during cancer progression. Leveraging genome-wide chromatin tracing to visualize 3D genome folding directly in tissues, we generated 3D genome cancer atlases of murine lung and pancreatic adenocarcinoma. Our data reveal stereotypical, non-monotonic, and stage-specific alterations in 3D genome folding heterogeneity, compaction, and compartmentalization as cancers progress from normal to preinvasive and ultimately to invasive tumors, discovering a potential structural bottleneck in early tumor progression. Remarkably, 3D genome architectures distinguish histologic cancer states in single cells, despite considerable cell-to-cell heterogeneity. Gene-level analyses of evolutionary changes in 3D genome compartmentalization not only showed compartment-associated genes are more homogeneously regulated, but also elucidated prognostic and dependency genes in lung adenocarcinoma and a previously unappreciated role for polycomb-group protein Rnf2 in 3D genome regulation. Our results demonstrate the utility of mapping the single-cell cancer 3D genome in tissues and illuminate its potential to identify new diagnostic, prognostic, and therapeutic biomarkers in cancer.


Conflict of interest statement

S.W., M.L., M.D.M., S.J., and S.S.A. are inventors on a patent applied for by Yale University related to this work. M.D.M. received research funding from a Genentech supported AACR grant and an honorarium from Nested Therapeutics. The remaining authors declare no competing interests.

Figures

Extended Data Fig. 1.
Extended Data Fig. 1.. Genome-scale chromatin tracing visualizes 3D genome organization in vivo.
a, Pearson correlation coefficients of mean inter-loci distances between WT datasets. b, Mean inter-loci distances of WT dataset 3 versus mean inter-loci distances of WT dataset 2. The red line is a fitted linear regression line. The black line is the y = x line. c, Mean inter-loci spatial distance versus genomic distance for all pairs of genomic loci on each autosome in AT2 cells. Different pseudo-colors represent different autosomes. n = 6,039 intra-chromosomal inter-loci pairs in b-d. n = 4,806 WT AT2 cells in c-d. d, Power-law scaling of all 19 mouse autosomes (Chr 1–19) in WT mouse lung. e, Power-law scaling of Chr 19 in E14.5 mouse fetal liver. Data were re-analyzed from Liu et al. Nat. Commun. (2020). f, Power-law scaling of all 20 mouse chromosomes (Chr 1–19, Chr X) in the mouse brain inhibitory neurons expressing Vip. Data were re-analyzed from Takei et al. Science. (2021). g, Schematic illustration of the experimental procedure. The schematic is created with BioRender.com. h, Whole-section fluorescence images of wild-type (WT) mouse lung and K-MADM-Trp53 mouse lungs containing adenomas or LUAD. For panels d-f, lines are fitted power-law functions, and S is the scaling factor.
Extended Data Fig. 2.
Extended Data Fig. 2.. Changes of cancer state-specific 3D genome features comparing each cancer state to the AT2 state.
a, Mean log2 fold change of heterogeneity scores of each chromosome, comparing each cancer state to WT AT2 cell state. * indicates FDR < 0.05, two-sided Wilcoxon signed-rank test. b, Demixing scores (standard deviation of normalized mean inter-loci distances) of the active X chromosomes (Xa, n = 95) and inactive X chromosomes (Xi, n = 95) in human IMR90 cells show a reduction (increased intermixing) in Xi, as previously described using other analyses. p value from two-sided Levene’s test is shown. c, Mean log2 fold change of decompaction scores of each chromosome, comparing each cancer state to WT AT2 cell state. * indicates FDR < 0.05, two-sided Wilcoxon signed-rank test. d, Log2 fold change of the demixing score of each chromosome, comparing each cancer state to WT AT2 cell state. * indicates FDR < 0.05, two-sided Levene’s test. e-h, Log2 fold changes of mean inter-loci distances for adenoma red (AdenomaR) (e), adenoma yellow (AdenomaY) (f), adenoma green (AdenomaG) (g), and LUAD (h) relative to AT2 cells. Yellow lines highlight the boundaries of chromosomes. i, Mean log2 fold change of radial scores of each chromosome, comparing each cancer state to the AT2 cell state. * indicates FDR < 0.05, two-sided Wilcoxon signed-rank test. j, Nuclear convex hull volume of WT AT2, AdenomaR, AdenomaY, AdenomaG, and LUAD cells. p values of two-sided Wilcoxon rank-sum tests are shown. The horizontal lines of each box from top to bottom represent the 75th percentile, median, and 25th percentile. Whiskers extend to the non-outlier maximum and non-outlier minimum. Outliers are defined as values at least 1.5 times interquartile range away from the top or bottom of the box. Cell numbers in (a, c-j) are the same as in Figure 2.
Extended Data Fig. 3.
Extended Data Fig. 3.. Cancer state-independent 3D genome features during lung cancer progression.
a-c, Normalized trans-chromosomal proximity frequency between genomic loci in AT2 (a), adenoma (b), and LUAD (c) cells. The proximity frequency between each pair of trans-chromosomal genomic regions were normalized to the mean proximity frequency of all loci pairs of the two corresponding chromosomes. A cutoff distance of 800-nm was used for defining proximity. The genomic regions were re-ordered so that A compartment loci were grouped separately from B compartment loci. d-f, Distribution of normalized trans-chromosomal proximity frequencies of pairs of A loci (A-A), pairs of B loci (B-B) and pairs of A and B loci (A-B) in AT2 (d), adenoma (e) and LUAD (f) cells. g-i, Normalized trans-chromosomal proximity frequencies of A-A, B-B and A-B loci pairs in AT2 (g), adenoma (h) and LUAD (i) cells. The horizontal lines of each box from top to bottom represent the 75th percentile, the median and the 25th percentile. Whiskers extend to the non-outlier maximum and non-outlier minimum. Outliers are defined as values at least 1.5 times interquartile range away from the top or bottom of the box. p values from two-sided Wilcoxon rank-sum test are shown. j-l, The proximity frequency between each pair of cis-chromosomal genomic regions as a function of their genomic distances in AT2 (j), adenoma (k), and LUAD (l) cells. m, Radial scores versus A-B compartment scores of genomic loci in the five cell states. The lines are fitted linear regression lines. Correlation coefficients (R) and p values are shown. Cell numbers for all panels are the same as in Figure 2.
Extended Data Fig. 4.
Extended Data Fig. 4.. Genome-wide chromatin tracing of pancreatic adenocarcinoma progression.
a-b, Whole-section fluorescence images of a K-MADM-Trp53 pancreas with PanINs (a) and PDAC (b). c-d, (Upper panels) Immunofluorescence staining of the duct cell marker CK19 and DAPI staining in a field of view in a-b. (Lower panels) Fluorescent protein imaging of GFP and tdTomato and DAPI staining in a field of view in a-b. The images are maximum-intensity z-projections from 10-μm z-stacks. e, Matrix of mean inter-loci distances between all genomic loci in normal duct cells. n = 1,529 cells. f, Mean inter-loci spatial distance versus genomic distance for all pairs of genomic loci on each autosome in duct cells. Different pseudo-colors represent different autosomes. n = 6,039 intra-chromosomal inter-loci pairs. n = 1,529 cells. g, Log2 fold change of mean inter-chromosomal distances, comparing each cancer state to normal duct cells. n = 1529, 123, 189, 361, 475 for normal duct, PanIN R, PanIN Y, PanIN G, and PDAC cells. Cell numbers of each cell state are identical in g and h. h, Distribution of the mean log2 fold change of radial scores of Chr17, Chr1, and Chr19, comparing each cancer state to normal duct cells.
Extended Data Fig. 5.
Extended Data Fig. 5.. Subsampling analysis of chromatin folding changes during lung cancer progression.
a-c, Distributions of the (mean) log2 fold change of heterogeneity (COV of inter-loci distance), decompaction (mean inter-loci distance), and demixing scores of each autosome (n = 19) in a randomly subsampled population of 100 cells per cell state, comparing each cancer state to AT2 state. d, Distribution of the log2 fold change of inter-chromosomal distances in a randomly subsampled population of 100 cells per cell state, comparing each cancer state to AT2 state. e, Distribution of the log2 fold change of polarization indices of A and B compartments of each autosome (n = 19) in a randomly subsampled population of 100 cells per cell state, comparing each cancer state to AT2 state. f, Distribution of the mean log2 fold change of radial scores of Chr 16, Chr 5, and Chr18 in a randomly subsampled population of 100 cells per cell state, comparing each cancer state to AT2 state. p values of two-sided Wilcoxon signed-rank test (a-f) are displayed. In a-f, the horizontal lines of each box from top to bottom represent the 75th percentile, median, and 25th percentile. Whiskers extend to the non-outlier maximum and non-outlier minimum. Outliers are defined as values at least 1.5 times interquartile range away from the top or bottom of the box.
Extended Data Fig. 6.
Extended Data Fig. 6.. Exome and RNA sequencing analyses of lung tumors from K-MADM-Trp53 mice.
a, Heatmap of mean copy number variants (CNVs) of each autosome across AdenomaG and LUAD samples (n = 6 tumors per group). Classification of AdenomaG and LUAD is based on parallel gene expression analysis by RNA-seq on the same tumors (e). b, Distribution of copy numbers of each autosome in AdenomaG and LUAD tumors relative to paired normal. Each dot represents a single tumor. Black lines represent the median values. c, Frequency of non-synonymous single nucleotide variants (SNVs) per megabase (Mb) with variant allele fraction (VAF) > 5% in AdenomaG and LUAD tumors. d, Representative large GFP+ (green) tumor dissected under fluorescence microscopy for whole exome and RNA sequencing analyses. Scale bar = 2.5 mm. e-f, Unsupervised hierarchical clustering of all expressed genes (e) segregates dissected green tumors into two clusters (n = 6 tumors per cluster) defining AdenomaG and LUAD cells based on the expression of previously described markers of histologic progression (f), including loss of AT2/AT1 genes (Stfpc, Lyz2, and Hopx) and acquisition of genes associated with gastric differentiation, epithelial-to-mesenchymal transition (EMT), and metastasis (Clu, Hnf4a, Gkn1, Hmga2, Cldn2). Row normalized expression counts are shown in heatmap. The horizontal lines in each violin in (f) represent the 75th percentile, median, and 25th percentile. p values of two-sided Wilcoxon rank-sum test are displayed. g, Gene set enrichment analysis using the MSigDB Hallmarks (H1) shows the top 3 enriched gene sets for upregulated (red, log2 fold change > 2 and FDR < 0.05) and downregulated (blue, log2 fold change < −1 and FDR < 0.05) genes in LUAD compared to AdenomaG. Log10 (1/p value) is plotted (one-sided hypergeometric test). EMT = epithelial-to-mesenchymal transition. h, Schematic illustration of the snRNA-seq pipeline in K-MADM-Trp53 lung tumors. The schematic is created with BioRender.com. i-j, UMAP plot of single-cell gene expression profiles in K-MADM-Trp53 lung tumors (n = 6,300 cells). Different cell type clusters identified by unsupervised clustering were labeled with different colors (i) based on gene set enrichment patterns of adenoma (n = 1,631) and LUAD (n = 4,669)-specific genes (j).
Extended Data Fig. 7.
Extended Data Fig. 7.. Fine-scale tracing of candidate drivers and suppressors of cancer progression.
a, Schematic illustration of high-resolution chromatin tracing targeting the cis regulatory regions of 23 genes, including CPD, CTS, Kras, and Myc. b, Distribution of the mean log2 fold change of decompaction (mean inter-loci distance) scores of each target gene, comparing each cancer state to AT2 state. n = 960, 460, 368, 5723 for normal AT2, Adenoma RY, Adenoma G, and LUAD cells. Cell numbers in each cell state are identical in b-f. c, Pileup heatmap of normalized E-P distances centered around each E-P loop. E-P loops of CPD genes are called in LUAD cells. E-P loops of CTS genes are called in AT2 plus adenoma cells. d, Distribution of the log2 fold change of the normalized distances between promoter and putative enhancers of CPD and CTS genes, comparing each cancer state to AT2 cells. e, Normalized inter-loci distance matrices of the target genomic regions surrounding the Kras, Myc, Foxa3 (CPD), and Cxcl12 (CTS) genes in AT2, adenoma, and LUAD cell states. The green circles designate putative enhancer-promoter contacts. Putative enhancer and gene annotation tracks are aligned to the target regions. f, Distribution of the normalized distances between promoter and putative enhancers of the Kras and Myc genes.
Extended Data Fig. 8.
Extended Data Fig. 8.. 3D genome organization in cancer cells is largely independent of spatial proximity to immune cells.
a-c, Mean log2 fold change of heterogeneity (a), decompaction (b), and demixing (c) scores of each chromosome, comparing AT2/cancer cells near (less than 10 μm) versus far (more than 10 μm) from CD45+ immune cells. The p values (a, b) or FDR (c) with significance (< 0.05) from two-sided Wilcoxon signed-rank test (a, b) or two-sided Levene’s test (c) are displayed. d, Distribution of polarization indices of A-B compartments in AT2/cancer cells near or far from immune cells. Two-sided Wilcoxon rank-sum test yielded no significant p values (p < 0.05). e, t-SNE plots of single-cell 3D chromatin conformations in AT2, adenoma, and LUAD cells show no distinct clusters based on spatial proximity to immune cells. In (a, b, d), the horizontal lines of each box from top to bottom represent the 75th percentile, median, and 25th percentile. Whiskers extend to the non-outlier maximum and non-outlier minimum. Outliers are defined as values at least 1.5 times interquartile range away from the top or bottom of the box.
Extended Data Fig. 9.
Extended Data Fig. 9.. Schematic illustration of the experimental approach and major findings.
In this work, we generated single-cell 3D genome atlases during lung and pancreatic cancer progression. Our data revealed stereotypical, stage-specific and conserved alterations in 3D genome folding as cancers progress from normal to preinvasive to invasive tumors, elucidating a potential structural bottleneck during early cancer progression. We developed “Trace2State” and “Trace2Biomarker” pipelines and revealed the utility of 3D genome mapping in discovering prognostic and predictive biomarkers. We further developed a “Trace2Regulator” pipeline and identified a ubiquitin ligase-independent role for Rnf2 in 3D genome regulation.
Fig. 1.
Fig. 1.. A genome-scale chromatin tracing strategy to visualize cancer 3D genomes.
a, Schematic illustration of the experimental procedure. b, (Left panel) Raw FISH foci in bit 28 in a WT AT2 cell. (Right panels) Zoom-in images of raw FISH foci showing the decoding procedure and reconstructed genomic loci for 5 loci (shown as dots with 5 pseudo-colors each appearing twice). c, (Left panel) Reconstructed chromatin traces superimposed with DAPI staining. The traces are 2D projections of x, y coordinates. The DAPI image is a maximum-intensity z-projection from a 10-μm z-stack. (Right panel) The 3D positions of all decoded genomic loci in a single-cell nucleus. Different pseudo-colors represent different autosomes. d, Matrix of mean inter-loci distances between all genomic loci in AT2 cells. n = 4,806 AT2 cells. e, (Upper panels) Immunofluorescence staining of cell-type markers, DAPI staining, and fluorescent protein imaging of lung tissue from a WT mouse, a K-MADM-Trp53 mouse with adenomas, and a K-MADM-Trp53 mouse with LUAD. (Lower panels) Representative cells of each state. The images are maximum-intensity z-projections from 10-μm z-stacks.
Fig. 2.
Fig. 2.. Systematic changes of 3D genome conformations during lung and pancreatic cancer progression.
a, Coefficient of variation (COV) of inter-loci distances (upper panels) and mean inter-loci distances (lower panels) of mouse Chr13 in WT AT2 (n = 4,806), Trp53+/+ adenoma (AdenomaR, n = 791), Trp53+/− adenoma (AdenomaY, n = 1,603), Trp53−/− adenoma (AdenomaG, n = 1,941), and Trp53−/− LUAD (n = 17,711) cells. Cell numbers of each cell state are identical in a-g. b-e, Distributions of the (mean) log2 fold change of heterogeneity (COV of inter-loci distance), decompaction (mean inter-loci distance), demixing scores, and polarization indices of each autosome (n = 19), comparing each cancer state to AT2 state. f, Distribution of the log2 fold change of inter-chromosomal distances, comparing each cancer state to AT2 state. g, Distribution of the mean log2 fold change of radial scores of Chr13, Chr7, and Chr19, comparing each cancer state to AT2 state. h-j, Distributions of the (mean) log2 fold change of heterogeneity (COV of inter-loci distance), decompaction (mean inter-loci distance), and demixing scores of each autosome (n = 19), comparing each pancreatic cancer state to normal duct cells. n = 1529, 123, 189, 361, 475 for normal duct, PanIN R, PanIN Y, PanIN G, and PDAC cells. Cell numbers of each cell state are identical in h-j. p values of two-sided Wilcoxon signed-rank test (b-j) are displayed. In b-j, the horizontal lines of each box from top to bottom represent the 75th percentile, median, and 25th percentile. Whiskers extend to the non-outlier maximum and non-outlier minimum. Outliers are defined as values at least 1.5 times interquartile range away from the top or bottom of the box.
Fig. 3.
Fig. 3.. The single-cell 3D genome distinguishes and encodes cancer progression states.
a, Cartoon illustration of scA/B score calculation (left panels). t-SNE, UMAP and PaCMAP plots of single-cell 3D genome conformations (right panels). n = 3410, 157, 689, 878, and 8834 for WT AT2, AdenomaR, AdenomaG, AdenomaY, and LUAD cells, respectively. Cell numbers of each cell state are identical in a-c, g and h. b, Confusion matrix of supervised machine learning in mouse lung cells. The number in each matrix element represents the precision in each predicted state. c, Receiver operating characteristic (ROC) curves of the machine learning model in mouse lung cells. The area under curve (AUC) values are shown. d, PCA plot of single-cell 3D genome conformations. n = 1103, 191, and 268 for normal duct, PanIN, and PDAC cells, respectively. Cell numbers of each cell state are identical in d-f. e, Confusion matrix of supervised machine learning in mouse pancreas cells. The number in each matrix element represents the precision in each predicted state. f, Receiver operating characteristic (ROC) curves of the machine learning model in mouse pancreas cells. The area under curve (AUC) values are shown. g, PCA plot of single-cell 3D genome conformations of adenoma and LUAD cells (left). Leiden clustering separates Adenoma-like and LUAD-like clusters (right). h, Percentages of cells with adenoma-like or LUAD-like 3D genome conformations in g, in each of the AdenomaR/Y, AdenomaG, and LUAD states. The adenoma-like or LUAD-like conformation state for each cell is assigned based on a Leiden clustering approach (upper) or the majority state of its five nearest neighbors (lower) in the left panel of g. p values from two-sided Fisher’s exact test are shown.
Fig. 4.
Fig. 4.. The single-cell 3D genome nominates prognostic genes and genetic dependencies.
a, scA/B score changes of genes with decreased (n = 94 genes) or increased (n = 120 genes) expression levels from AdenomaG to LUAD cells. p values of one-sided Wilcoxon signed-rank tests are shown. b, Mean scA/B score changes in marker genomic loci between AdenomaG and LUAD cells. c, Heatmap of candidate progression driver (CPD) and candidate tumor suppressor (CTS) gene expression (log2 normalized expression counts) comparing AdenomaG and LUAD tumors derived from K-MADM-Trp53 mice. d-e, Gene expression homogeneity of LUAD cells in the K-MADM-Trp53 (single nucleus) (d) and KP (single cell) (e) model comparing CPDs (Expression up + scA/B up) or CTSs (Expression down + scA/B down) with up/down regulated genes in regions with unchanged scA/B scores. Gene expression homogeneity is quantified with a correlation homogeneity score method. The horizontal lines of each box represent the 75th percentile, median, and 25th percentile. Whiskers extend to the non-outlier maximum and non-outlier minimum. Outliers are defined as values away from the top or bottom of the box by more than 1.5 times interquartile range. f, Kaplan-Meier survival curves comparing TCGA LUAD patients with gene expression profiles most or least correlated with CPDs (Expression up + scA/B up), CTSs (Expression down + scA/B down), and the corresponding controls (Expression up + scA/B unchanged or Expression down + scA/B unchanged; Expression up only or Expression down only). Top row: 21 genes are included in each panel. Bottom row: 19 genes are included in each panel. In the control groups, the genes are the ones with the highest expression fold change among all genes fitting the criteria. All analyses were performed with a top vs. bottom 20% (quintiles; n = 96 tumors per group). p values of two-sided log-rank test are shown. g, Dependency scores (using the DEMETER2 algorithm) of LUAD cell lines (n = 57) comparing CPDs (Expression up + scA/B up) and corresponding controls (Expression up + scA/B unchanged or Expression up only). n = 19–20 genes per group with available data in RNAi screens in the Cancer Dependency Map. Lower (more negative) score = more dependent. **p < 0.01, Wilcoxon rank-sum test. The horizontal lines of each box represent the 75th percentile, median, and 25th percentile. Whiskers extend to the maximum and minimum. h, Cell viability (mean ± SD, normalized to the mean of non-targeting control (NTC), n = 3 replicates per hairpin, 3 hairpins per gene) of arrayed RNAi screen targeting CPD genes in the KP (upper panel) and SA6082inf (lower panel) LUAD cell lines. NTC (green underline), positive controls (red underline), and CPD genes with significant phenotypes (at least two out of three hairpins with less than 80% of NTC cell count, purple underline) in both cell lines are indicated.
Fig. 5.
Fig. 5.. Rnf2 partially regulates 3D genome organization changes during the adenoma-to-LUAD transition.
a, Western blot analysis of Rnf2 protein levels following Rnf2 knockdown with three independent hairpins in the KP cell line. Control cells were constructed with a non-targeting control shRNA sequence (shNTC). HSP90 is loading control. b, Cell viability (mean ± SD, normalized to mean of shNTC) following knockdown with three Rnf2 shRNAs, n = 3 replicates per hairpin. p values from two-sided two-sample t-tests are shown. c, scA/B score changes from shRnf2 to shNTC versus those from AdenomaG to LUAD show a significant positive correlation, n = 473 target genomic regions. Black lines are fitted regression lines. Spearman correlation coefficients and p values are shown. d, Rnf2 peak densities in A (n = 209 regions) and B (n = 264 regions) compartments in shNTC. The horizontal lines of each box from top to bottom represent the 75th percentile, median, and 25th percentile. Whiskers extend to the non-outlier maximum and non-outlier minimum. Outliers are defined as values at least 1.5 times interquartile range away from the top or bottom of the box. p value of two-sided Wilcoxon rank-sum test is shown. e, CUT&RUN read density heatmaps of Rnf2, H3K4me3, H3K27me3, RNA polymerase II with phosphorylated S5 modification, H2AK119ub, and BMI1 in shNTC KP cells. Rnf2 peak regions [−5k, +5k] of all target genomic regions are shown and are categorized as active (H3K4me3+, H3K27me3−), bivalent (H3K4me3+, H3K27me3+), repressed (H3K4me3−, H3K27me3+), or other (H3K4me3−, H3K27me3−) based on chromatin marks. f, scA/B score changes from shRnf2 to shNTC versus those from AdenomaG to LUAD show a stronger or similarly positive correlation using target genomic regions with only active Rnf2 peaks, n = 113 target genomic regions.
Fig. 6.
Fig. 6.. Rnf2 regulates 3D genome organization via a ubiquitin ligase-independent activity.
a, Western blot analysis of Rnf2 protein levels following rescue of shRNA knockdown (shRnf2–3) with stable transduction of Rnf2 WT, ubiquitin-ligase dead Rnf2 I53S mutant, or empty vector (EV) control. HSP90 is loading control. b, scA/B score changes from shRnf2–3 to shRnf2–3+WT Rnf2 (left) and to shRnf2–3+I53S Rnf2 (right) versus those from AdenomaG to LUAD show a stronger positive correlation with expression of a catalytically dead mutant of Rnf2, n = 473 target genomic regions. Black lines are fitted regression lines. Spearman correlation coefficients and p values are shown. c, Western blot of Rnf2 and H2AK119ub in KP LUAD cells with Rnf2-dTAG after treatment with the dTAG-13 ligand or negative control ligand (a diastereomer of dTAG-13) at the designated times (0, 0.5, or 12 hours). d, Immunofluorescence images of Rnf2 and H2AK119ub in KP LUAD cells with Rnf2-dTAG after treatment with dTAG-13 ligand or negative control at designated times. e, Quantification of the immunofluorescence intensities in d. The horizontal lines of each box from top to bottom represent the 75th percentile, median, and 25th percentile. Whiskers extend to the non-outlier maximum and non-outlier minimum. Outliers are defined as values at least 1.5 times interquartile range away from the top or bottom of the box. p value from two-sided Wilcoxon rank sum test is shown. f, scA/B score changes from Rnf2-degraded cells (dTAG-13) to Rnf2 non-degraded cells (dTAG-13 negative control) versus those from AdenomaG to LUAD and those from shRnf2 to shNTC, with n = 473 target genomic regions. Black lines are fitted regression lines. Spearman correlation coefficients and p values are shown.

References

    1. Zink D., Fischer A. H. & Nickerson J. A. Nuclear structure in cancer cells. Nat. Rev. Cancer 4, 677–687 (2004). - PubMed
    1. Krijger P. H. L. & de Laat W. Regulation of disease-associated gene expression in the 3D genome. Nat. Rev. Mol. Cell Biol. 17, 771–782 (2016). - PubMed
    1. Zheng H. & Xie W. The role of 3D genome organization in development and cell differentiation. Nat. Rev. Mol. Cell Biol. 20, 535–550 (2019). - PubMed
    1. Yu M. & Ren B. The Three-Dimensional Organization of Mammalian Genomes. Annu. Rev. Cell Dev. Biol. 33, 265–289 (2017). - PMC - PubMed
    1. Bickmore W. A. & van Steensel B. Genome Architecture: Domain Organization of Interphase Chromosomes. Cell 152, 1270–1284 (2013). - PubMed

Publication types