[Preprint]. 2023 Jul 28:2023.07.27.550836.
doi: 10.1101/2023.07.27.550836.

ChromaFold predicts the 3D contact map from single-cell chromatin accessibility

Affiliations

ChromaFold predicts the 3D contact map from single-cell chromatin accessibility

Vianne R Gao et al. bioRxiv. .

Update in

  • ChromaFold predicts the 3D contact map from single-cell chromatin accessibility.
    Gao VR, Yang R, Das A, Luo R, Luo H, McNally DR, Karagiannidis I, Rivas MA, Wang ZM, Barisic D, Karbalayghareh A, Wong W, Zhan YA, Chin CR, Noble WS, Bilmes JA, Apostolou E, Kharas MG, Béguelin W, Viny AD, Huangfu D, Rudensky AY, Melnick AM, Leslie CS. Gao VR, et al. Nat Commun. 2024 Nov 1;15(1):9432. doi: 10.1038/s41467-024-53628-0. Nat Commun. 2024. PMID: 39487131 Free PMC article.

Abstract

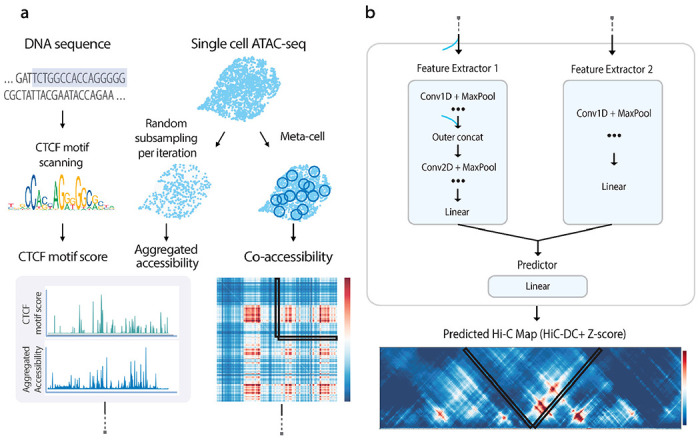
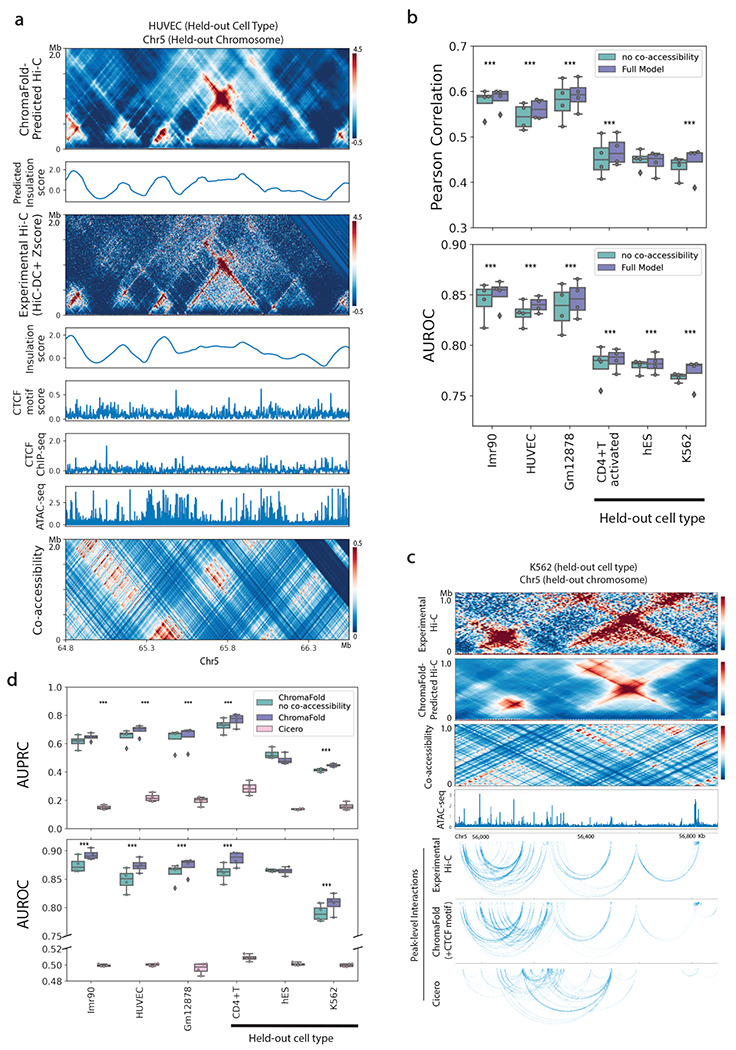
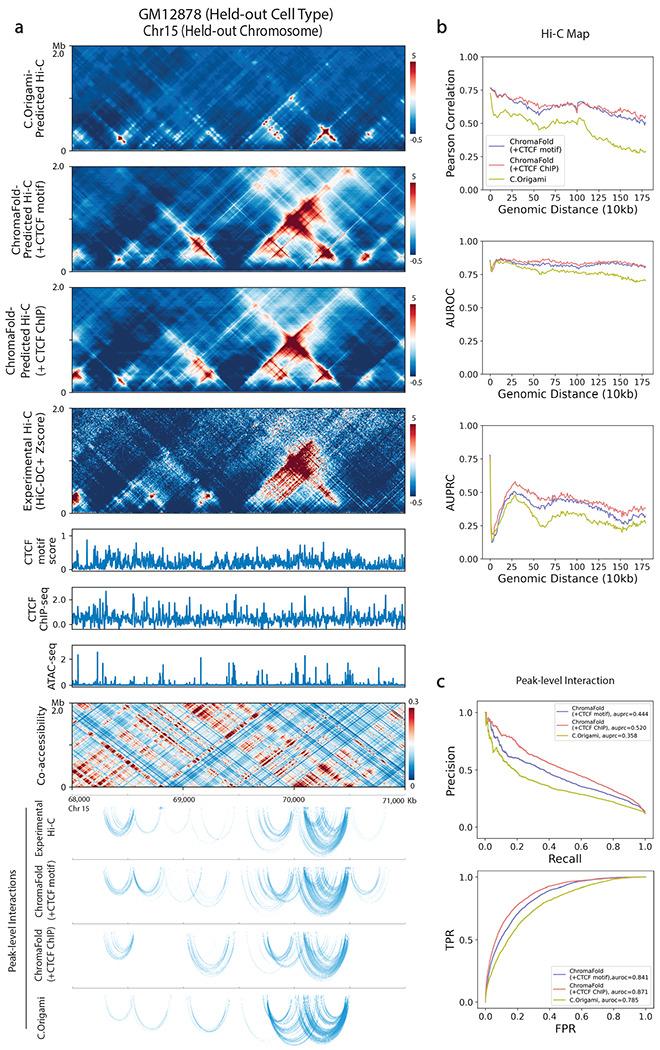
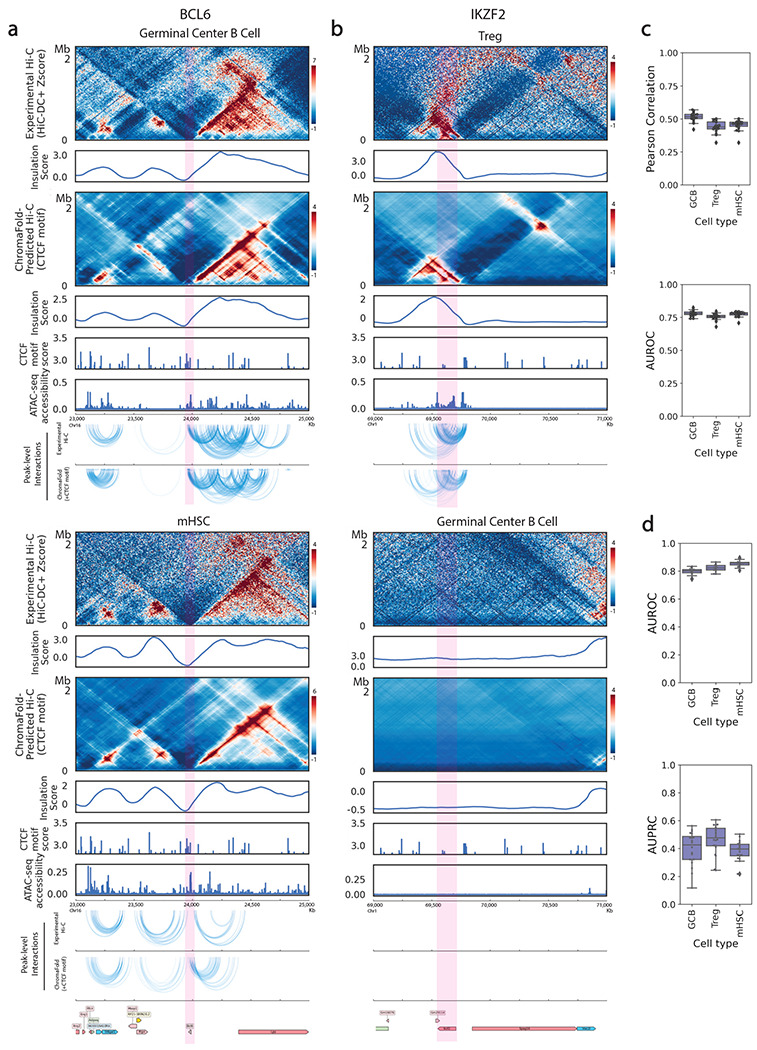
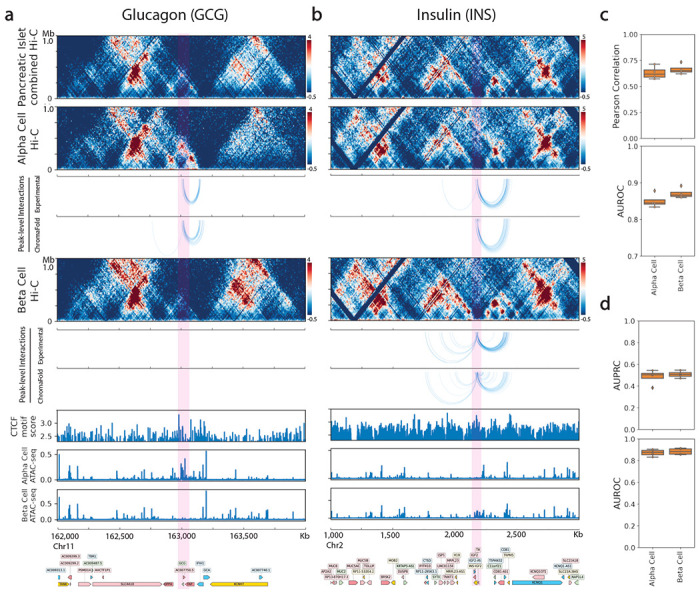
The identification of cell-type-specific 3D chromatin interactions between regulatory elements can help to decipher gene regulation and to interpret the function of disease-associated non-coding variants. However, current chromosome conformation capture (3C) technologies are unable to resolve interactions at this resolution when only small numbers of cells are available as input. We therefore present ChromaFold, a deep learning model that predicts 3D contact maps and regulatory interactions from single-cell ATAC sequencing (scATAC-seq) data alone. ChromaFold uses pseudobulk chromatin accessibility, co-accessibility profiles across metacells, and predicted CTCF motif tracks as input features and employs a lightweight architecture to enable training on standard GPUs. Once trained on paired scATAC-seq and Hi-C data in human cell lines and tissues, ChromaFold can accurately predict both the 3D contact map and peak-level interactions across diverse human and mouse test cell types. In benchmarking against a recent deep learning method that uses bulk ATAC-seq, DNA sequence, and CTCF ChIP-seq to make cell-type-specific predictions, ChromaFold yields superior prediction performance when including CTCF ChIP-seq data as an input and comparable performance without. Finally, fine-tuning ChromaFold on paired scATAC-seq and Hi-C in a complex tissue enables deconvolution of chromatin interactions across cell subpopulations. ChromaFold thus achieves state-of-the-art prediction of 3D contact maps and regulatory interactions using scATAC-seq alone as input data, enabling accurate inference of cell-type-specific interactions in settings where 3C-based assays are infeasible.


Conflict of interest statement

C.S.L. is an SAB member and co-inventor of IP with Episteme Prognostics, unrelated to the current study. M.G.K. is a SAB member of 858 Therapeutics and received honorarium from Kumquat, AstraZeneca and Consultancy with Transition Bio. A.D.V is an SAB member of Arima Genomics. A.Y.R. is an SAB member and has equity in Sonoma Biotherapeutics, Santa Ana Bio, RAPT Therapeutics and Vedanta Biosciences. He is an SEB member of Amgen and BioInvent and is a co-inventor or has IP licensed to Takeda that is unrelated to the content of the present study. A.M. has research funding from Janssen, Epizyme and Daiichi Sankyo. A.M. has consulted for Exo Therapeutics, Treeline Biosciences, Astra Zeneca. The remaining authors declare no competing interests.

Figures

Figure 1.
Figure 1.. ChromaFold predicts the 3D contact map from scATAC-seq alone.
ChromaFold is a deep learning model that enables prediction of 3D contact maps solely from scATAC-seq data, using pseudobulk chromatin accessibility and co-accessibility from scATAC-seq as well as predicted CTCF motif tracks as input features. a. Schematic of the ChromaFold input data processing framework. b. ChromaFold model architecture. The model consists of two feature extractors: feature extractor 1 for the aggregated accessibility and CTCF motif score tracks, and feature extractor 2 for the co-accessibility extracted from a V-stripe region. The feature extractors produce a latent representation of the 4Mb genomic region. The Z-score predictor then takes this latent representation and predicts the chromatin interactions between the center genomic tile and its neighboring bins within a 2Mb distance, annotated by the V-shaped black box. Each genomic tile is 10Kb in length.
Figure 2.
Figure 2.. Co-accessibility information improves contact map prediction in new cell types.
a. Visualization of real vs. ChromaFold-predicted Hi-C contact map, insulation scores, epigenetic tracks, and co-accessibility on held-out chromosome 5 in HUVEC. b. Quantitative evaluation of Hi-C map prediction performance by ChromaFold, with and without the co-accessibility input, across training and held-out human cell types/tissues. Box plots show (top) the averaged distance-stratified Pearson correlation between the experimental and predicted contact map and (bottom) the averaged distance-stratified AUROC of significant interactions (top 10% in Z-score), per held-out chromosome. Paired t-test is performed on the distance-stratified person correlation across test chromosomes (P-value: *: <0.05, **: < 0.01, ***: < 0.001). c. Visualization of ChromaFold-predicted Hi-C contact map and significant peak-level interactions and Cicero-predicted peak-level interactions in held-out cell type K562 on held-out chromosome 5. d. Quantitative evaluation of significant peak-level prediction performance by ChromaFold and Cicero. Box plots show the AUPRC (top) and AUROC (bottom) of significant peak-level interaction prediction per held-out chromosome. Statistical test is the same as above. The paired t-test P-value for both ChromaFold models vs. Cicero are < 0.0001.
Figure 3.
Figure 3.. ChromaFold achieves state-of-the-art performance for predicting significant Hi-C interactions in new cell types.
C.Origami and ChromaFold were trained using the same training/test chromosomes on IMR-90 to predict contact maps normalized by HiC-DC+ Z-score. a. Visualization of C.Origami and ChromaFold-predicted Hi-C contact maps and peak-level interactions in held-out cell type GM12878. b. Line plots show distance stratified (top) Pearson correlation between the experimental and predicted contact map, (middle) AUROC and (bottom) AUPRC of significant interactions (top 10% in Z-score) for ChromaFold and C.Origami on held-out chromosome 15. c. Line plots show (top) PR curves and (bottom) ROC curves for peak-level interaction prediction on held-out chromosome 15.
Figure 4.
Figure 4.. ChromaFold accurately generalizes across cell types and species.
a, b. Comparison of experimental vs. ChromaFold-predicted Hi-C contact map and peak-level interactions at different loci in the mouse genome across different murine cell types: the Bcl6 gene locus in mouse germinal center B cells (a, top) and in mHSC (a, bottom) and the Ikzf2 gene locus in regulatory T cells (b, top) and germinal center B cells (b, bottom). c. Box plots show (top) the averaged distance-stratified Pearson correlation and AUROC of significant interactions (bottom; top 10% in Z-score), per held-out chromosome across mouse cell types. d. Box plots show the AUPRC (top) and AUROC (bottom) of significant peak-level interaction prediction per held-out chromosome across mouse cell types.
Figure 5.
Figure 5.. ChromaFold enables deconvolution of Hi-C interactions in pancreatic islet cells.
a, b. Visualization of peak-level interactions derived from experimental Hi-C data and ChromaFold-predicted Hi-C map in alpha cells and beta cells near the TSS of (a) glucagon (GCG) and (b) insulin (INS). c. Box plots show (top) the averaged distance-stratified Pearson correlation and AUROC of significant interactions (top 10% in Z-score), per held-out chromosome in alpha and beta cells. d. Box plots show the AUPRC (top) and AUROC (bottom) of significant peak-level interaction prediction per held-out chromosome in alpha and beta cells.

References

    1. Van Berkum N. L. et al. Hi-C: a method to study the three-dimensional architecture of genomes. JoVE (Journal of Visualized Experiments) e1869 (2010). - PMC - PubMed
    1. Mumbach M. R. et al. HiChIP: efficient and sensitive analysis of protein-directed genome architecture. Nature methods 13, 919–922 (2016). - PMC - PubMed
    1. Fullwood M. J. et al. An oestrogen-receptor-α-bound human chromatin interactome. Nature 462, 58–64 (2009). - PMC - PubMed
    1. Lieberman-Aiden E. et al. Comprehensive mapping of long-range interactions reveals folding principles of the human genome. science 326, 289–293 (2009). - PMC - PubMed
    1. Krijger P. H. L. & De Laat W. Regulation of disease-associated gene expression in the 3D genome. Nature reviews Molecular cell biology 17, 771–782 (2016). - PubMed

Publication types