[Preprint]. 2023 Jul 28:2023.07.24.550373.
doi: 10.1101/2023.07.24.550373.

Signaling specificity and kinetics of the human metabotropic glutamate receptors

Affiliations

Signaling specificity and kinetics of the human metabotropic glutamate receptors

Tyler W McCullock et al. bioRxiv. .

Update in

Abstract

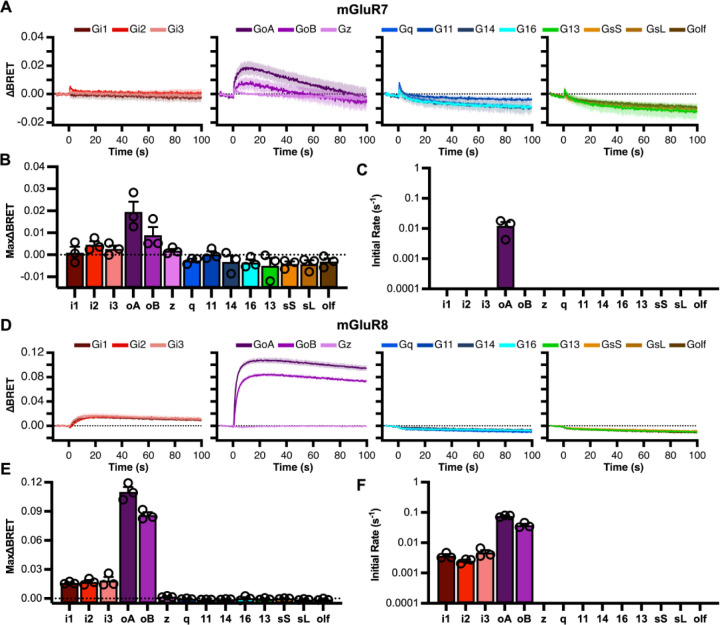
Metabotropic glutamate receptors (mGluRs) are obligate dimer G protein coupled receptors that can all function as homodimers. Here, each mGluR homodimer was examined for its G protein coupling profile using a BRET based assay that detects the interaction between a split YFP-tagged Gβ1γ2 and a Nanoluc tagged free Gβγ sensor, MAS-GRK3-ct-NLuc with 14 specific Ga proteins heterologously expressed, representing each family. Canonically, the group II and III mGluRs (2&3, and 4, 6, 7&8, respectively) are thought to couple to Gi/o exclusively. In addition, the group I mGluRs (1&5) are known to couple to the Gq/11 family, and generally thought to also couple to the PTX-sensitive Gi/o family; some reports have suggested Gs coupling is possible as cAMP elevations have been noted. In this study, coupling was observed with all 8 mGluRs through the Gi/o proteins, and only mGluR1&5 through Gq/11, and perhaps surprisingly, not G14. None activated any Gs protein. Interestingly, coupling was seen with the group I and II, but not the group III mGluRs to G16. Slow but significant coupling to Gz was also seen with the group II receptors.


Conflict of interest statement

Authors declare no competing interests.

Figures

Figure 1.
Figure 1.
Evaluation of the mGluR optimized protocol for all human mGluRs. A, Dendrogram illustrating homology of all 8 human mGluRs and their distribution into three groups. B, Schematic illustrating the setup of the NanoBRET system. C-D, Example protocol of cells expressing mGluR2-GoA prepared under the standard protocol (C) or mGluR optimized protocol (D) to 100 μM glutamate (green), 100 μM LY341495 (red), or the combination of the two (blue). The stimulus was delivered at time = 0 as indicated by the arrow. Summary data describing the basal BRET ratio (E), the LY341495 response (F), the glutamate response (G), and responses to Glu+LY34 (H) of all 8 mGluRs in the experiments as shown in C&D. Bars describe the average ± SEM. Statistics show the results of a two-way ANOVA with Holm-Šídák post hoc test, * = P<0.05, ** = P<0.005, *** = P<0.0005, and **** = P<0.0001.
Figure 2.
Figure 2.
Group I mGluR signaling profiles. Signaling profiles of mGluR1 (A-C), and mGluR5 (D-F), through a panel of 14 Ga proteins in response to 1 mM glutamate. Each stimulus was delivered at time = 0. The dark solid line indicates the average response of 3 biologic replicates and the light shading indicates the SEM for each trace. Maximum ΔBRET induced by glutamate (B&E) and initial rates (C&F) for mGluR1 and 5, respectively are displayed as the average ± SEM. Raw measurements for each replicate are shown as open circles (○) in each bar graph.
Figure 3.
Figure 3.
Group II mGluR signaling profiles. Group II mGluR signaling profiles. Signaling profiles of mGluR2 (A-C), and mGluR3 (D-F), through a panel of 14 Ga proteins in response to 1 mM glutamate. Each stimulus was delivered at time = 0. The dark solid line indicates the average response of 3 biologic replicates and the light shading indicates the SEM for each trace. Maximum ΔBRET induced by glutamate (B&E) and initial rates (C&F) for mGluR1 and 5, respectively are displayed as the average ± SEM. Raw measurements for each replicate are shown as open circles (○) in each bar graph.
Figure 4.
Figure 4.
Group III (mGluR4&6) signaling profiles. Group III mGluR signaling profiles. Signaling profiles of mGluR4 (A-C), and mGluR6 (D-F), through a panel of 14 Ga proteins in response to 1 mM glutamate. Each stimulus was delivered at time = 0. The dark solid line indicates the average response of 3 biologic replicates and the light shading indicates the SEM for each trace. Maximum ΔBRET induced by glutamate (B&E) and initial rates (C&F) for mGluR1 and 5, respectively are displayed as the average ± SEM. Raw measurements for each replicate are shown as open circles (○) in each bar graph.
Figure 5.
Figure 5.
Group III (mGluR7&8) signaling profiles. Group III mGluR signaling profiles. Signaling profiles of mGluR7 (A-C), and mGluR8 (D-F), through a panel of 14 Ga proteins in response to 1 mM glutamate. Each stimulus was delivered at time = 0. The dark solid line indicates the average response of 3 biologic replicates and the light shading indicates the SEM for each trace. Maximum ΔBRET induced by glutamate (B&E) and initial rates (C&F) for mGluR1 and 5, respectively are displayed as the average ± SEM. Raw measurements for each replicate are shown as open circles (○) in each bar graph.
Figure 6.
Figure 6.
Glutamate dose response curves illustrating relative efficacy and potency of responses of each mGluR through each responding G protein. A, glutamate dose response curves for the indicated Ga proteins when coexpressed with mGluRs1–8. Note that mGluR7 only showed responses to GoA, and only at glutamate concentrations above 1 mM, so accurate efficacy and potency estimates were not possible. Heat maps are also shown, illustrating calculated EC50 values (B) and Hill coefficients (C) for the indicated mGluR homodimer with each responding Ga protein in the NanoBRET assay.
Figure 7.
Figure 7.
Summary of mGluR-G protein responses of all mGluR homodimers. A, Summary of signal amplitude data displayed as raw ∆BRET according to blue intensity scale shown below for each mGluR-G protein pair. B, Initial rate data displayed as Log10 transformed initial rates according to the color scale shown below for each mGluR-G protein pair. Heatmaps in both A&B display the average value of three biologic replicates. Data are from the same experimental replicates shown in Figs. 2–5.

References

    1. Gregory K. J., Asymmetry is central to excitatory glutamate receptor activation. Nat Struct Mol Biol 28, 633–635 (2021). - PubMed
    1. Kammermeier P. J., Ikeda S. R., Expression of RGS2 alters the coupling of metabotropic glutamate receptor 1a to M-type K+ and N-type Ca2+ channels. Neuron 22, 819–829 (1999). - PubMed
    1. Avet C. et al., The PAR2 inhibitor I-287 selectively targets Galpha(q) and Galpha(12/13) signaling and has anti-inflammatory effects. Commun Biol 3, 719 (2020). - PMC - PubMed
    1. McCool B. A. et al., Rat group I metabotropic glutamate receptors inhibit neuronal Ca2+ channels via multiple signal transduction pathways in HEK 293 cells. J Neurophysiol 79, 379–391 (1998). - PubMed
    1. Hauser A. S. et al., Common coupling map advances GPCR-G protein selectivity. Elife 11, (2022). - PMC - PubMed

Publication types