[Preprint]. 2023 Jul 28:2023.07.26.550731.
doi: 10.1101/2023.07.26.550731.

Drug screening in human physiologic medium identifies uric acid as an inhibitor of rigosertib efficacy

Affiliations

Drug screening in human physiologic medium identifies uric acid as an inhibitor of rigosertib efficacy

Vipin Rawat et al. bioRxiv. .

Update in

Abstract

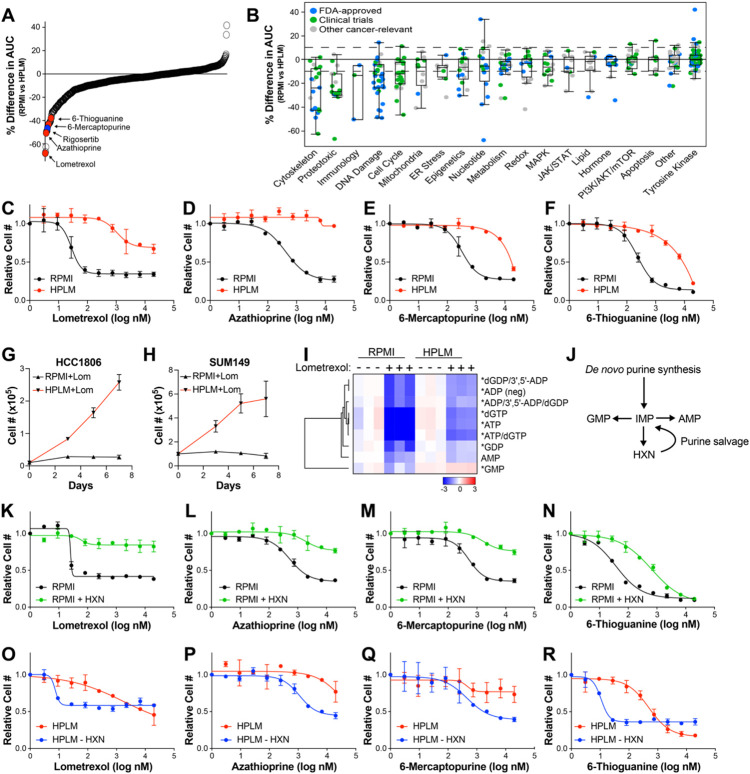
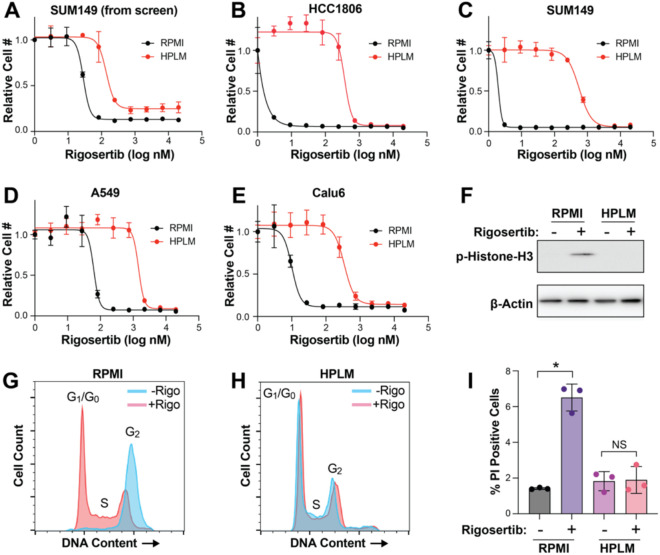
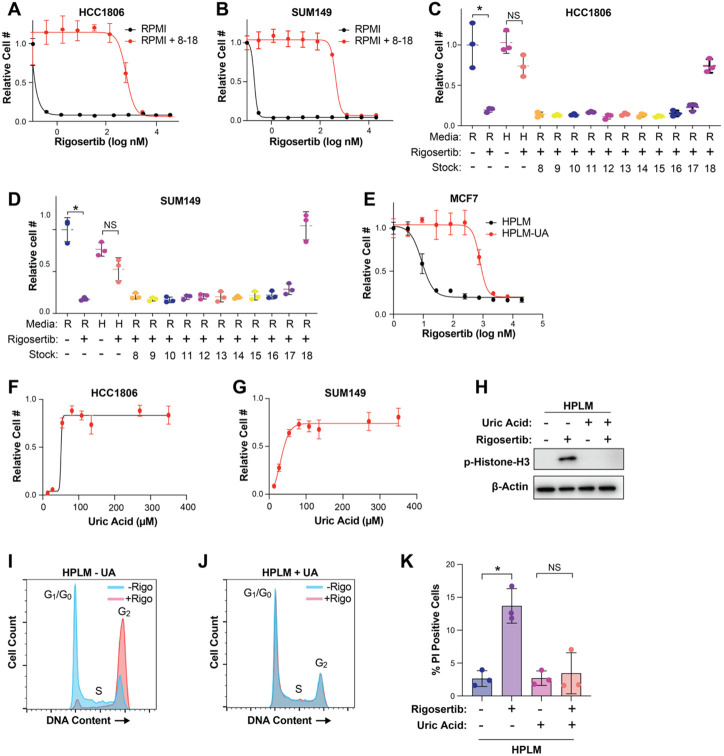
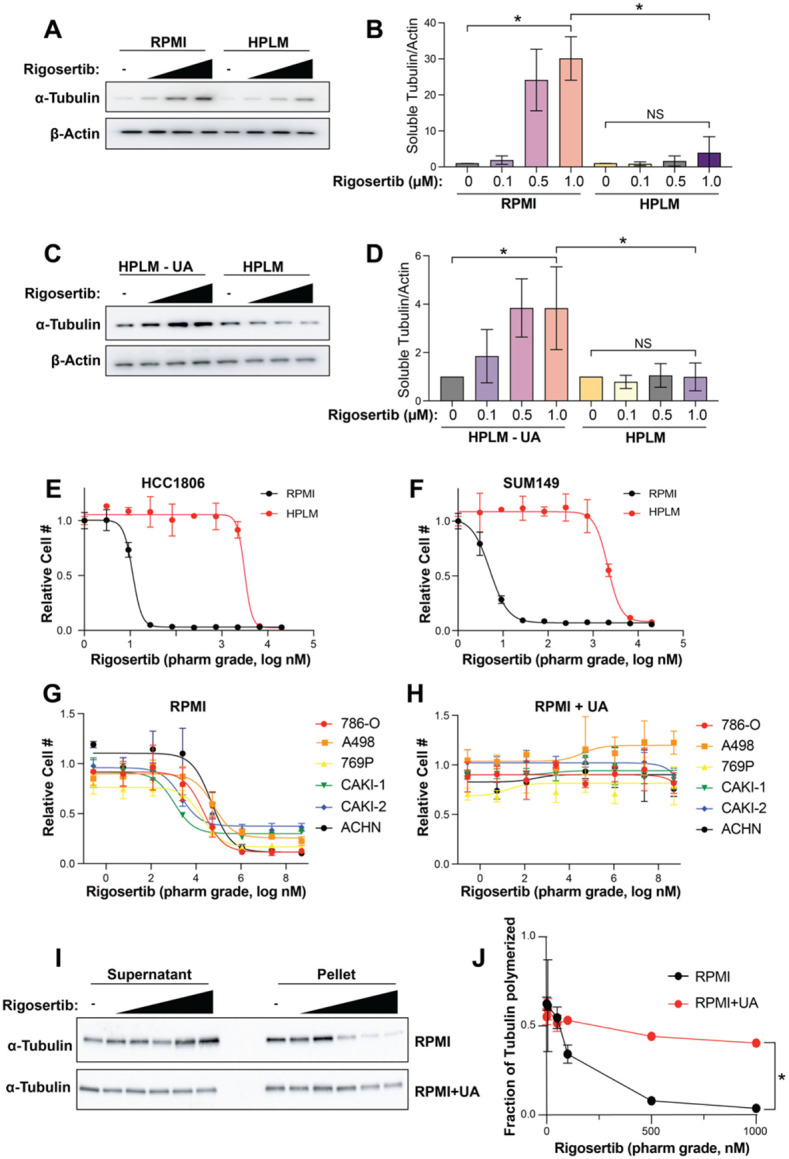
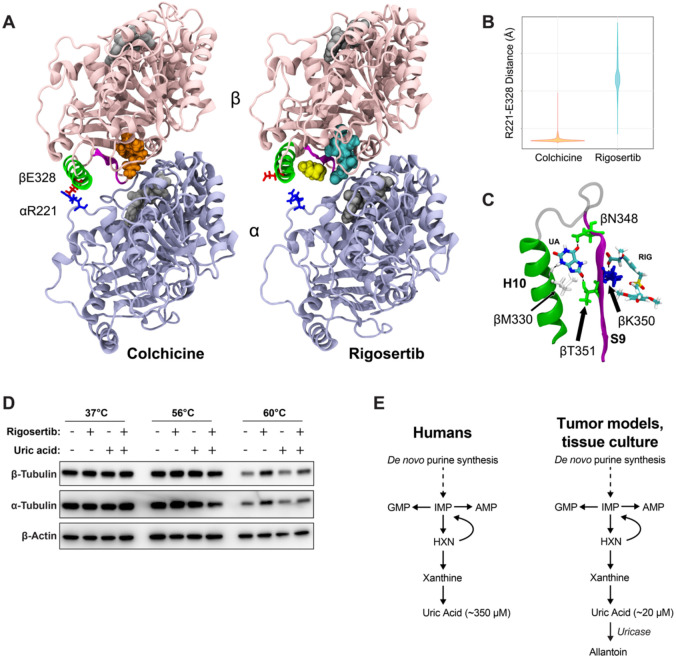
The non-physiological nutrient levels found in traditional culture media have been shown to affect numerous aspects of cancer cell physiology, including how cells respond to certain therapeutic agents. Here, we comprehensively evaluated how physiological nutrient levels impact therapeutic response by performing drug screening in human plasma-like medium (HPLM). We observed dramatic nutrient-dependent changes in sensitivity to a variety of FDA-approved and clinically trialed compounds, including rigosertib, an experimental cancer therapeutic that has recently failed in phase 3 clinical trials. Mechanistically, we found that the ability of rigosertib to destabilize microtubules is strongly inhibited by the purine metabolism waste product uric acid, which is uniquely abundant in humans relative to traditional in vitro and in vivo cancer models. Structural modelling studies suggest that uric acid interacts with the tubulin-rigosertib complex and may act as an uncompetitive inhibitor of rigosertib. These results offer a possible explanation for the failure of rigosertib in clinical trials and demonstrate the utility of physiological media to achieve in vitro results that better represent human therapeutic responses.


Conflict of interest statement

The authors have declared that no conflict of interest exists.

Figures

Figure 1.
Figure 1.. Culture in HPLM changes sensitivity to a variety of therapeutic agents
(A) Percent difference in the area under curve (% Difference in AUC) data for SUM149 cells cultured in either RPMI or HPLM after treatment with anti-cancer and metabolic inhibitor libraries. Only compounds with an Emax >50% in either medium are shown. (B) The same data as in (A) categorized based on target pathway. (C – F) Dose-response curves of the purine biosynthesis inhibitors lometrexol (C), azathioprine (D), 6-mercaptopurine (E), and 6-thioguanine (F) on SUM149 cells growing in RPMI vs HPLM. (G & H) Growth curves of HCC1806 (G) and SUM149 (H) cells treated with lometrexol in RPMI vs HPLM. (I) LC-MS analysis to quantify purine nucleotide abundance in HCC1806 cells treated with lometrexol in RPMI vs HPLM. * indicates p < 0.05 for HPLM + lometrexol relative to RPMI + lometrexol (unpaired two-tailed t-test). (J) Schematic representation of purine synthesis and salvage pathways. (K – N) Dose-response curves of the purine biosynthesis inhibitors lometrexol (K), azathioprine (L), 6-mercaptopurine (M), and 6-thioguanine (N) on SUM149 cells grown in RPMI with and without hypoxanthine (HXN). (O – R) Dose-response curves of the purine biosynthesis inhibitors lometrexol (O), azathioprine (P), 6-mercaptopurine (Q), and 6-thioguanine (R) on SUM149 cells grown in HPLM with and without hypoxanthine (HXN). For all panels data represents the means ± SD of triplicate samples.
Figure 2.
Figure 2.. Culture in HPLM reduces sensitivity to rigosertib
(A) Dose response curve of SUM149 cells treated with rigosertib from the high-throughput screen described in Figure 1. Data are the mean ± SD of triplicate samples. (B – E) Dose response curves for rigosertib treatment of HCC1806 (B), SUM149 (C), A549 (D) and Calu6 (E) cells growing in RPMI vs HPLM. Data are the mean ± SD of triplicate samples. (F) Representative western blot of phospho-Histone H3 in HCC1806 cells treated with rigosertib in RPMI vs HPLM. (G & H) Cell cycle analysis of HCC1806 cells treated with 150 nM commercial-grade rigosertib in RPMI (G) and HPLM (H). (I) Cell death analysis of HCC1806 cells treated with 200 nM commercial-grade rigosertib in RPMI vs HPLM. Cell death and cell cycle data are the means ± SD of triplicate samples. * indicates p < 0.05 from unpaired two-tailed t-test. NS (not significant) indicates p > 0.05.
Figure 3.
Figure 3.. Uric acid prevents the activity of rigosertib
(A & B) Dose response curves of HCC1806 (A) and SUM149 (B) cells treated with rigosertib in RPMI vs RPMI + HPLM stocks 8-18. (C & D) Cell growth assays of HCC1806 (C) and SUM149 (D) cells treated with 80 nM rigosertib in the presence of individual HPLM stocks 8-18. R = RPMI and H = HPLM. (E) Dose response curve of MCF7 cells treated with rigosertib in HPLM vs HPLM – UA. (F & G) Dose response curves of uric acid on HCC1806 (F) and SUM149 (G) cells treated with 80 nM rigosertib. (H) Representative western blot of phospho-Histone H3 in HCC1806 cells treated with 150 nM rigosertib in HPLM vs HPLM – UA. (I & J) Cell cycle analysis of HCC1806 cells treated with 150 nM commercial-grade rigosertib in HPLM (I) and HPLM – UA (J). (K) Cell death analysis of HCC1806 cells treated with 200 nM commercial-grade rigosertib in HPLM and HPLM – UA. For all panels, data is represented as mean ± SD of triplicate samples. * indicates p < 0.05 from unpaired two-tailed t-test. NS (not significant) indicates p > 0.05.
Figure 4.
Figure 4.. Uric acid inhibits the microtubule destabilizing activity rigosertib
(A) Western blot of soluble α-tubulin from SUM149 treated with increasing doses of rigosertib (0.1 μM, 0.5 μM and 1 μM ) for 4h in RPMI and HPLM. (B) Quantification of western blots from (A). Data is represented as mean ± SD from three independent experiments. * indicates p < 0.05 from one way ANOVA followed by Tukey’s multiple comparison test. NS (not significant) indicates p > 0.05. (C) Western blot of soluble α-tubulin from SUM149 treated with increasing doses of rigosertib (0.1 μM, 0.5 μM and 1 μM) for 4h in HPLM and HPLM – UA. (D) Quantification of western blots from (C). Data is represented as mean ± SD from three independent experiments. * indicates p < 0.05 from one way ANOVA followed by Tukey’s multiple comparison test. NS (not significant) indicates p > 0.05. (E & F) Dose response curves of HCC1806 (E) and SUM149 (F) cells treated with pharmaceutical-grade rigosertib in RPMI vs HPLM. (G & H) Dose response curves of a panel of renal cancer cell lines treated with pharmaceutical-grade rigosertib in RPMI (G) vs RPMI + UA (H). (I) Western blot of soluble and pellet α-tubulin from 786-O cells treated with increasing doses (5 nM, 50 nM, 100 nM, 500 nM, 1000 nM) of pharmaceutical-grade rigosertib for 4 hr in RPMI and RPMI + UA. (J) Quantification of western blots from (I). Data is represented as means ± SD of three independent experiments. * indicates p < 0.05 from two-way ANOVA.
Figure 5.
Figure 5.. Uric acid inhibits rigosertib activity by reducing the affinity of rigosertib for β-tubulin
(A) Structural comparisons of colchicine-bound and rigosertib-bound tubulin. Colchicine and rigosertib are colored orange and cyan, respectively. The salt bridge between βE328 and αR221 found in colchicine structure is absent in the rigosertib structure, allowing H10 (green) to move away from the dimer body and create a pocket for uric acid (yellow) to bind. (B) Distance between αE328 and βR221 in the colchicine and rigosertib simulations. When this ionic bond is not formed, H10 becomes untethered which creates the binding pocket for uric acid. (C) Molecular details of uric acid binding in the pocket between H10 (green) and S9 (magenta). Residues that form hydrogen-bonds with uric acid are labeled. (D) CETSA analysis of K562 cells treated for 4 hr with 40 μM pharmaceutical-grade rigosertib in RPMI at the indicated temperature. (E) Unlike mice and other model organisms/systems, humans do not express uricase resulting in uniquely high uric acid levels.

References

    1. Altea-Manzano P, et al. Nutrient metabolism and cancer in the in vivo context: a metabolic game of give and take.. EMBO Rep 2020;21(10):e50635. - PMC - PubMed
    1. Sullivan MR, et al. Quantification of microenvironmental metabolites in murine cancers reveals determinants of tumor nutrient availability.. Elife 2019;8. doi:10.7554/eLife.44235 - DOI - PMC - PubMed
    1. Rinaldi G, Rossi M, Fendt S-M. Metabolic interactions in cancer: cellular metabolism at the interface between the microenvironment, the cancer cell phenotype and the epigenetic landscape.. Wiley Interdiscip Rev Syst Biol Med 2018;10(1). doi:10.1002/wsbm.1397 - DOI - PubMed
    1. DULBECCO R, FREEMAN G. Plaque production by the polyoma virus.. Virology 1959;8(3):396–397. - PubMed
    1. EAGLE H. The specific amino acid requirements of a human carcinoma cell (Stain HeLa) in tissue culture.. J Exp Med 1955;102(1):37–48. - PMC - PubMed

Publication types