[Preprint]. 2023 Jul 26:2023.07.26.550625.
doi: 10.1101/2023.07.26.550625.

An allelic series at the EDNRB2 locus controls diverse piebalding patterns in the domestic pigeon

Affiliations

An allelic series at the EDNRB2 locus controls diverse piebalding patterns in the domestic pigeon

Emily T Maclary et al. bioRxiv. .

Update in

Abstract

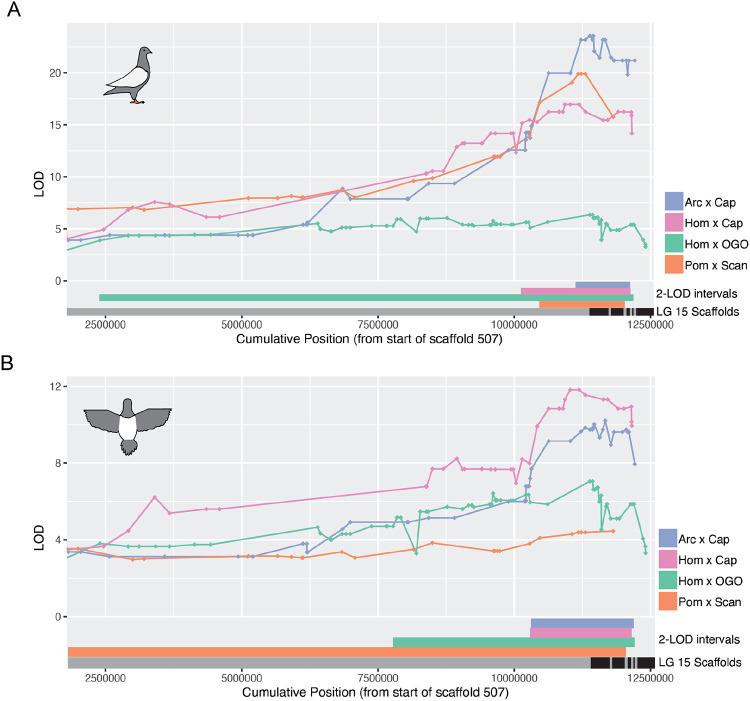
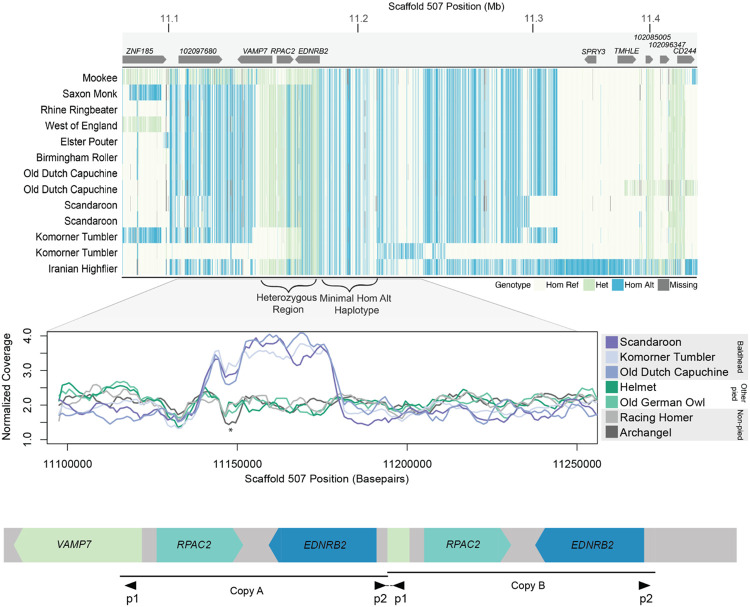
Variation in pigment patterns within and among vertebrate species reflects underlying changes in cell migration and function that can impact health, reproductive success, and survival. The domestic pigeon (Columba livia) is an exceptional model for understanding the genetic changes that give rise to diverse pigment patterns, as selective breeding has given rise to hundreds of breeds with extensive variation in plumage color and pattern. Here, we map the genetic architecture of a suite of pigmentation phenotypes known as piebalding. Piebalding is characterized by patches of pigmented and non-pigmented feathers, and these plumage patterns are often breed-specific and stable across generations. Using a combination of quantitative trait locus mapping in F2 laboratory crosses and genome-wide association analysis, we identify a locus associated with piebalding across many pigeon breeds. This shared locus harbors a candidate gene, EDNRB2, that is a known regulator of pigment cell migration, proliferation, and survival. We discover multiple distinct haplotypes at the EDNRB2 locus in piebald pigeons, which include a mix of protein-coding, noncoding, and structural variants that are associated with depigmentation in specific plumage regions. These results identify a role for EDNRB2 in pigment patterning in the domestic pigeon, and highlight how repeated selection at a single locus can generate a diverse array of stable and heritable pigment patterns.


Figures

Figure 1.
Figure 1.. Piebald patterns vary among breeds and within F2 crosses.
(A-H) Examples of piebald and cross founder breeds. (A) Helmet, (B) Mookee, (C) Scandaroon (Pom x Scan founder breed), (D) Pomeranian Pouter (Pom x Scan founder breed), (E) Archangel (Arc x Cap founder breed), (F) Old Dutch Capuchine (Arc x Cap and Hom x Cap founder breed), (G) Racing Homer (Hom x Cap and Hom x OGO founder breed), (H) Old German Owl (Hom x OGO founder breed). E and F are images of founders of the Arc x Cap cross, others are representative images. (I) Boxplots showing the distribution of the proportion of white plumage for F2 birds from each cross in the 15 different body regions quantified. Boxes span from the first to third quartile of each data set, with lines indicating the median. Whiskers span up to 1.5x the interquartile range. Photos in (C) and (D) by Layne Gardner, used with permission.
Figure 2.
Figure 2.. QTL mapping identifies shared and cross-specific regions associated with piebalding.
Representative QTL results for piebalding in the Arc x Cap (A-B), Hom x Cap (C-D), and Hom x OGO (E-F) crosses. A,C, and E show QTL results for the dorsal right wing. B, D, and F show QTL results for the dorsal body. Lefthand plots illustrate QTL mapping results, with linkage map position on the X-axis and LOD score on the Y-axis. Red lines indicate the threshold for genome-wide statistical significance. Righthand boxplots illustrate the relationship between genotype at the LG15 peak marker and the proportion of white plumage in that body region. Boxes span from the first to third quartile of each data set, with lines indicating the median. Whiskers span up to 1.5x the interquartile range. QTL mapping results for additional body regions are in Supplemental Figures S2, S3, and S4.
Figure 3.
Figure 3.. Piebalding QTLs on linkage group 15 overlap in all crosses.
Overlaid QTL results for dorsal right wing (A) and dorsal body (B) within the LG15 peak region. 2-LOD intervals for each cross are indicated at the bottom of each plot. Black and gray bars indicate scaffold boundaries for the scaffolds that make up the candidate region in all four crosses; some scaffolds are not represented in all crosses due to lack of informative markers.
Figure 4.
Figure 4.. A single genomic locus associated with piebalding across many breeds.
(A) Whole-genome pFST comparisons of piebald birds to non-piebald birds. Dashed red line indicates 5% threshold for genome-wide significance. (B) Plot of genotypes within the candidate region identified by pFST. Each row shows an individual bird, and each vertical line a SNP position colored by genotype relative to the reference genome. Approximate locations of genes are illustrated at top. Shading on the left-hand side indicates birds with shared fixed haplotypes, the approximate span of these haplotypes is illustrated by gray blocks on the bottom of the plot. Hom Ref, homozygous reference allele; Het, heterozygous; Hom Alt, homozygous alternate (non-reference) allele.
Figure 5.
Figure 5.. Three coding mutations are associated with plumage depigmentation.
(A) Genomic context of the Group 1 piebald haplotype. Gene models for the region are shown in gray. Arrowheads indicate coding (yellow) and non-coding (green) SNPs. (B) Multi-species alignment of a portion of EDNRB2 (light gray rows) and EDNRB/EDNRB1 (dark gray, bottom two rows) protein sequences. Amino acids within a transmembrane helix are shaded in light green, residues that are part of a putative ligand binding pocket are shaded dark green. The coding changes identified in recessive white and Group 1 piebald birds, like the Helmet breed, are marked by yellow arrows, with the altered residues shaded dark blue. (C) Genomic context of the Group 2 piebald haplotype. (D) Multi-species alignment of a portion of EDNRB2 protein sequences. The cleaved peptide at the 5’ end of the C. livia protein is marked in gray; this portion exists in other species but is not easily delineated in this alignment due to variability of the amino end of the protein. The coding change identified in Group 2 birds is marked a yellow arrow, with the altered residue shaded dark blue.
Figure 6.
Figure 6.. EDNRB2 expression is altered in piebald birds.
(A) Genomic context of the Group 2 piebald haplotype. Gene models for the region are shown in gray. Arrowheads denote SNPs in the following regions: yellow, coding regions; pink, non-coding regions that overlap with conserved non-coding elements; green, other noncoding regions. Conserved noncoding elements (CNEs) from tetrapod (upper) and avian-only (lower) alignments are shown in blue. (B) Differential expression (by RNA-seq) of genes within the Hom x OGO LG15 candidate region comparing white vs. pigmented regenerating feather buds from Hom x OGO F2 pigeons. One gene, EDNRB2 is significantly downregulated in white feather buds. (C) Normalized EDNRB2 read count from RNA-seq in adult Racing Homers (pigmented feather buds only), Old German Owls (OGO, pigmented and white feather buds), and Hom x OGO F2s (HOGO F2, pigmented and white feather buds). (D-K) Whole-mount in situ hybridization for EDNRB2 in Racing Homer (D-G) and Classic Old Frill (H-K) embryos. Panels show dorsal body (D,H), Proximal forelimb (E,I), tail (F,J), and facial primordia (G,K).
Figure 7.
Figure 7.. A 37-kb tandem duplication is associated with the Group 4 “baldhead” piebalding pattern.
(A) Plot of genotypes within the candidate region identified by pFST for Group 4 birds. Each row shows an individual bird, and each vertical line a SNP, colored by genotype relative to the reference genome. Approximate locations of genes are illustrated at top, and regions of interest delineated by brackets, below. (B) Plot of normalized whole genome sequencing read coverage for representative birds from seven different breeds. Three baldhead breeds show an increase in coverage. * marks a coverage drop that coincides with both a LINE element and a nearby stretch of “N” bases in the reference genome and is not associated with a piebalding phenotype. (C) Schematic of the predicted structure of the baldhead-associated duplication. The duplicated region includes the 5’ portion of VAMP7 and the entirety of both RPAC2 and EDNRB2. Black triangles below indicate primer pairs used to amplify across the central breakpoint (also see Supplemental Fig. S8).

References

    1. Cieslak M, Reissmann M, Hofreiter M, Ludwig A. Colours of domestication. Biol Rev. 2011;86: 885–899. doi: 10.1111/j.1469-185x.2011.00177.x - DOI - PubMed
    1. Hubbard JK, Uy JAC, Hauber ME, Hoekstra HE, Safran RJ. Vertebrate pigmentation: from underlying genes to adaptive function. Trends Genetics Tig. 2010;26: 231–9. doi: 10.1016/j.tig.2010.02.002 - DOI - PubMed
    1. Price AC, Weadick CJ, Shim J, Rodd FH. Pigments, Patterns, and Fish Behavior. Zebrafish. 2008;5: 297–307. doi: 10.1089/zeb.2008.0551 - DOI - PubMed
    1. Kelsh RN, Harris ML, Colanesi S, Erickson CA. Stripes and belly-spots -- a review of pigment cell morphogenesis in vertebrates. Semin Cell Dev Biol. 2008;20: 90–104. doi: 10.1016/j.semcdb.2008.10.001 - DOI - PMC - PubMed
    1. Reissmann M, Ludwig A. Pleiotropic effects of coat colour-associated mutations in humans, mice and other mammals. Semin Cell Dev Biol. 2013;24: 576–586. doi: 10.1016/j.semcdb.2013.03.014 - DOI - PubMed

Publication types