[Preprint]. 2023 Jul 28:2023.07.28.551016.
doi: 10.1101/2023.07.28.551016.

A CRISPR screen of HIV dependency factors reveals CCNT1 is non-essential in T cells but required for HIV-1 reactivation from latency

Affiliations

A CRISPR screen of HIV dependency factors reveals CCNT1 is non-essential in T cells but required for HIV-1 reactivation from latency

Terry L Hafer et al. bioRxiv. .

Update in

Abstract

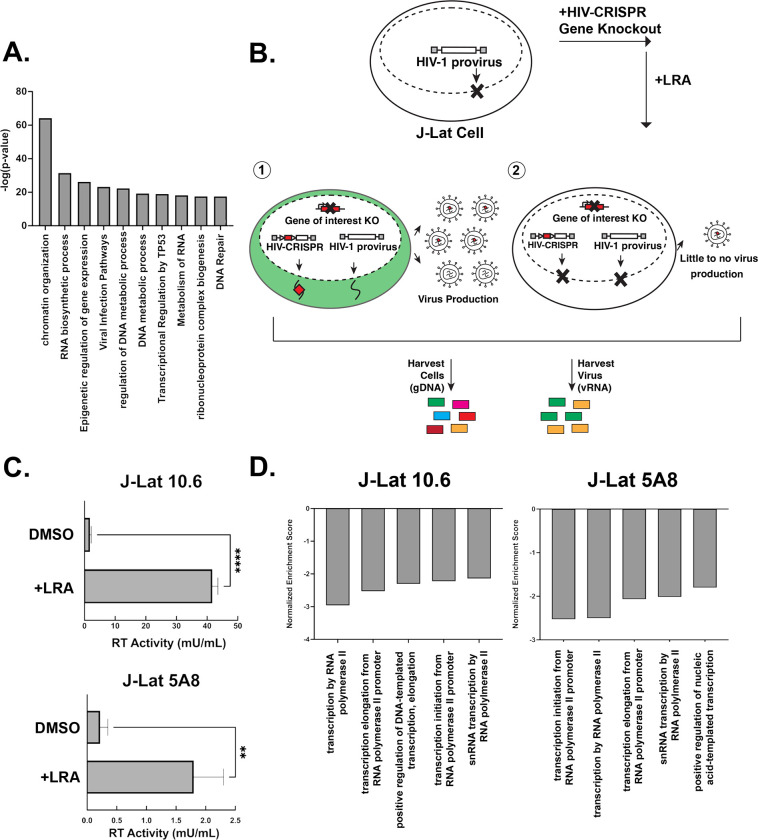
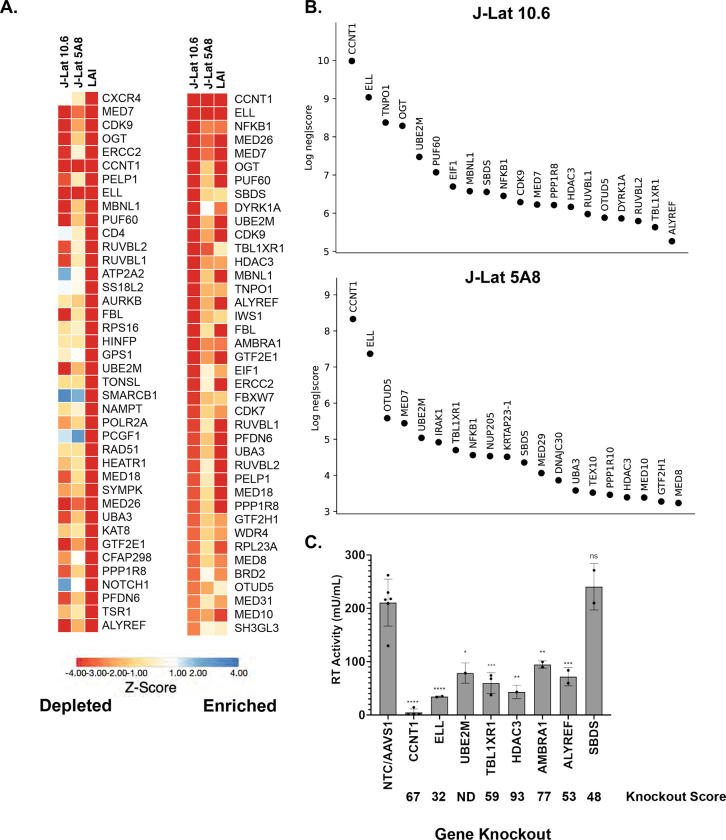
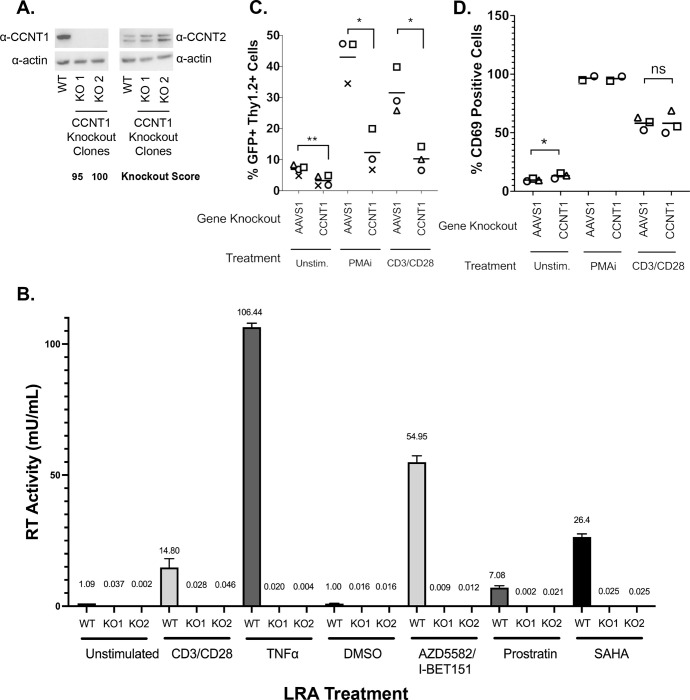
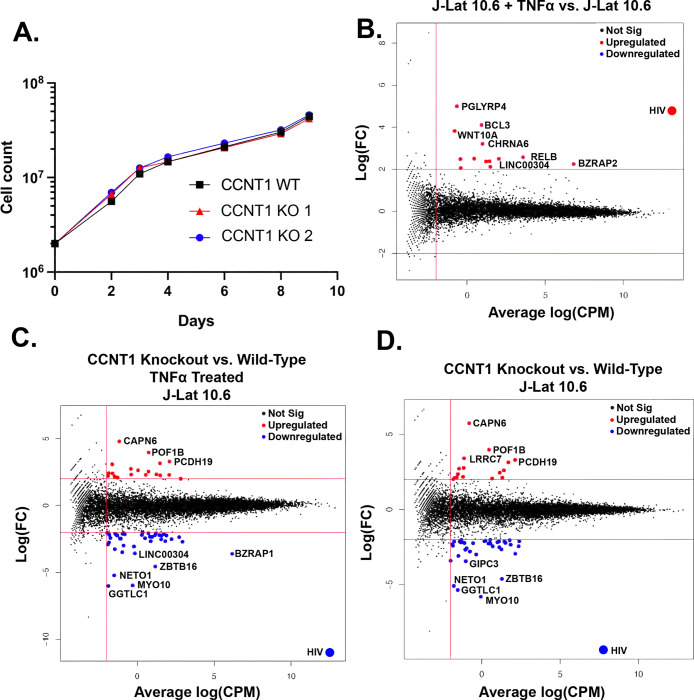
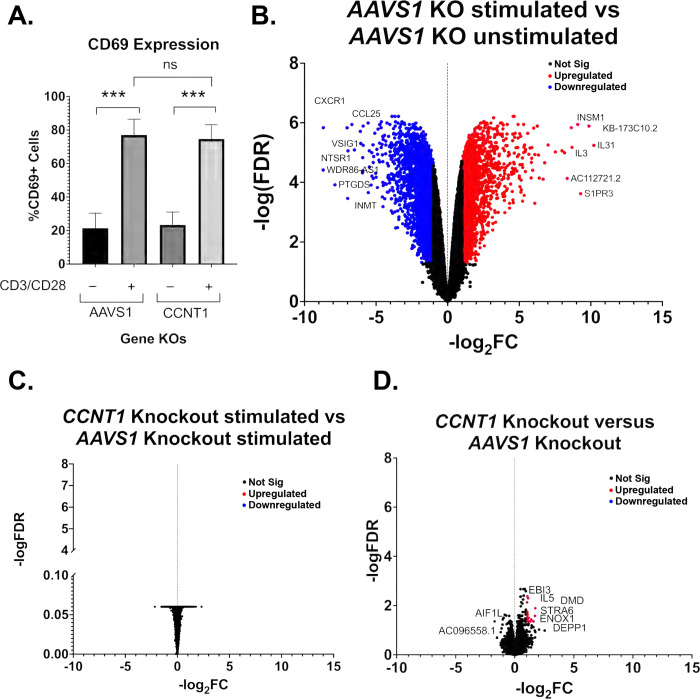
We sought to explore the hypothesis that host factors required for HIV-1 replication also play a role in latency reversal. Using a CRISPR gene library of putative HIV dependency factors, we performed a screen to identify genes required for latency reactivation. We identified several HIV-1 dependency factors that play a key role in HIV-1 latency reactivation including ELL , UBE2M , TBL1XR1 , HDAC3 , AMBRA1 , and ALYREF . Knockout of Cyclin T1 ( CCNT1 ), a component of the P-TEFb complex important for transcription elongation, was the top hit in the screen and had the largest effect on HIV latency reversal with a wide variety of latency reversal agents. Moreover, CCNT1 knockout prevents latency reactivation in a primary CD4+ T cell model of HIV latency without affecting activation of these cells. RNA sequencing data showed that CCNT1 regulates HIV-1 proviral genes to a larger extent than any other host gene and had no significant effects on RNA transcripts in primary T cells after activation. We conclude that CCNT1 function is redundant in T cells but is absolutely required for HIV latency reversal.


Figures

Figure 1.
Figure 1.. A Latency HIV-CRISPR Screen to identify factors required for latency reversal.
(A) A Metascape analysis of the genes in the HIV-Dep gene library is shown, with enriched pathways on the x-axis and statistical significance on the y-axis. (B) Overview of latency HIV-CRISPR screen of HIV Dependency Factors. The HIV-CRISPR vector has intact 5’ and 3’ LTRs and can be packaged by HIV-1 after integration (19) J-Lat cells were transduced with an HIV-CRISPR library of genes of HIV-1 dependency factors, selected for integration by puromycin selection, and treated with a latency reversal agent (LRA). Viral RNA (vRNA) and genomic DNA (gDNA) are harvested at the end of the experiment. Guides corresponding with genes that do not affect reactivation from latency are packaged in virions and enriched in the supernatant relative to the genomic DNA pool (scenario 1, left). For genes that are important for latency reactivation after treatment of cells with an LRA, these guides will be depleted in the viral supernatant relative to the genomic DNA knockout library (scenario 2, right). (C) Supernatant from J-Lat cells transduced with the HIV-DEP gene library were measured for Reverse Transcriptase (RT) activity after treatment with the LRA combination AZD5582 (1 nM) and I-BET151 (2.5 uM). Error bars represent technical triplicates, unpaired t-test was used for statistical analysis. p-value < 0.01 = **, < 0.0001 = **** (D) MAGEcKFlute (22) was used to analyze screen results of the depleted genes. The normalized enrichment score is on the y-axis (negative because guides to these genes are depleted from the viral supernatant) and the x-axis is the biological processes.
Figure 2.
Figure 2.. Analysis and Validation of Top Hits from HIV-CRISPR screen.
(A). Z-score analysis of the depleted versus enriched guides across multiple screens. J-Lat 10.6 and J-Lat 5A8 are screens from this study, whereas LAI represents Jurkat cells infected with an LAI strain of HIV-1 from previous screen performed using the same gene library in Jurkat cells to identify HIV Dependency Factors (17). Z-scores are sorted by the most depleted genes in the LAI screen (left panel) and by the most depleted genes in the J-Lat 10.6 line from this study (right panel). The mean z-score of two replicates each of J-Lat 10.6 and J-Lat 5A8, and of four replicates of the LAI screen is shown. Most depleted genes are red and most enriched genes are blue. Z-scores were that were less than −4 were capped at −4 in the heat map. (B). The top 20 most depleted hits from each J-Lat line in ranked order are shown. (C) Selected hits from the screen were tested by performing gene knockouts (x-axis), treating with the LRA combination AZD5582/I-BET151, and assayed for reverse transcriptase activity. Gene knockouts were performed using a lentiviral knockout approach and/or an electroporation with Cas9 and RNPs. Each point represents a single lentiviral or electroporation knockout experiment done in triplicate. An average of RT activity from two guides targeting each gene was taken for lentiviral knockouts, and the electroporation knockouts included three individual guides targeting each gene. The ICE gene knockout score for each experiment was averaged and is shown below each gene on the x-axis. Statistical analysis was performed using a two-way ANOVA and Šídák’s multiple comparisons test to measure the difference in latency reactivation between each gene knockout relative to NTC/AAVS1 control. p-value ≥ 0.05 = ns (not significant), < 0.05 = *, < 0.01 = **, < 0.001 = ***, < 0.0001 = ****. NTC/AAVS1 controls are combined; each dot represents either an AAVS1 or NTC control for an individual experiment. Each experiment (dot) has 3 technical replicates: NTC/AAVS1, n=6 experiments, 3 replicates each; CCNT1, n = 4 experiments, 3 replicates each; ELL, n = 2 experiments, 3 replicates each; UBE2M, n = 1 experiment, 3 replicates each; TBL1XR1, n = 3 experiments, 3 replicates each; HDAC3, 1 experiment, 3 replicates each; AMBRA1 n = 2 experiments, 3 replicates each; ALYREF, 2 experiments, 3 replicates each; SBDS n = 2 experiments, 3 replicates each.
Figure 3.
Figure 3.. CCNT1 is required for reactivation of HIV-1 from latency in Jurkat T cells and primary CD4+ T cells from healthy donors.
(A). Western blot of cell lysates of J-Lat 10.6 either wild-type or clonally knocked out for CCNT1 is shown, with two separate knockout clones. Actin was used as loading control. Left: CCNT1 antibody is shown, Right: CCNT2 antibody is shown. ICE Knockout scores are shown for each knockout clone of CCNT1 (B). J-Lat 10.6 cells wild-type for CCNT1 and the two clones knocked out for CCNT1 were treated with the LRAs shown on the bottom. The mean of RT activity in the supernatant 24 hrs after LRA treatment is shown on the Y axis and above each bar. Averages and standard deviation of the experiment done in triplicate is represented (C). Primary CD4+ T cells from three different healthy donors were infected with a dual-reporter virus that monitors cells active and latent infection (Thy 1.2, CD90 marker) and actively transcribing provirus (GFP marker). Cells were either knocked out for AAVS1 control or CCNT1 and either untreated, stimulated with PMAi, or stimulated with anti-CD3/anti-CD28 antibodies at the end of latency establishment. Each shape represents an individual donor. (D) CD69 expression was monitored with the different LRA treatments. CCNT1 ICE knockout scores were: 80, 76, 53, and 37 for each of four donors for CD3/CD28 and two donors for PMAi. A paired t-test was used for comparison of AAVS1 knockout vs CCNT1 knockout between donors. p-value ≥ 0.05 = ns, < 0.05 = *, < 0.01 = **
Figure 4.
Figure 4.. Cell proliferation and RNA sequencing analysis of CCNT1 knockouts in J-Lat 10.6 cells.
(A). Cell counts were monitored over a span of nine days in J-Lat 10.6 cells in WT or clonally knocked out CCNT1 cells. The average of three experimental replicates are shown with standard deviation. (B-D). Log2 FC (fold-change) is plotted on y-axis with the average Log2 CPM (counts per million) across technical replicates on the x-axis. Red lines on the signify genes that have an average Log2 CPM > −1, and a |Log2 FC | > 2. Red dots signify upregulated genes whereas blue genes signify downregulated genes for each comparison. B) Differential gene expression of J-Lat 10.6 with TNFα treatment versus J-Lat 10.6 (untreated) is shown. C). J-Lat 10.6 CCNT1 KO cells (two independent clones each tested in technical triplicate and averaged) versus the J-Lat 10.6 wild-type cells – both were treated with the LRA TNFα and gene expression comparison is shown. D). J-Lat 10.6 CCNT1 KO cells versus wild-type CCNT1 differential gene expression is shown – neither cell line was treated with an LRA.
Figure 5.
Figure 5.. Primary T cells transcripts are largely unaffected by CCNT1 knockout.
(A) Uninfected CD4+ T cells from three donors were knocked out for AAVS1 or CCNT1, and then treated with CD3/CD28 co-stimulation. Cells were analyzed by flow cytometry to measure CD69 expression. On left, one representative donor is shown. On right, a summary of CD69 expression in AAVS1 knockout versus CCNT1 knockout from all three healthy donors is shown. One-way ANOVA was used for analysis with Dunnett’s multiple comparison tests. p (B-D). Volcano plots of primary CD4+ T cell RNA sequencing data is shown, with −log2FC shown on the x-axis and −log(FDR) on the y-axis. RNA was isolated from three biological replicates. A FDR = 0.05 was used as a cutoff for significance, and the cutoff for significant gene expression was |Fold-Change| > 1. A subset of genes for each condition are marked that have significance. (B) Differential gene expression between AAVS1 knockout stimulated with CD3/CD28 versus unstimulated is shown. (C) A comparison of CCNT1 versus AAVS1 knockout is shown, and both were stimulated with anti-CD3/anti-CD28 antibodies. (D) CCNT1 versus AAVS1 knockout is shown, and neither of these are stimulated with anti-CD3/anti-CD28 antibodies. p-value ≥ 0.05 =, < 0.001 = ***

References

    1. Kim Y, Anderson JL, Lewin SR. 2018. Getting the “Kill” into “Shock and Kill”: Strategies to Eliminate Latent HIV. Cell Host Microbe 23:14–26. - PMC - PubMed
    1. Rodari A, Darcis G, Van Lint CM. 2021. The Current Status of Latency Reversing Agents for HIV-1 Remission. Annu Rev Virol 8:491–514. - PubMed
    1. Margolis DM, Archin NM, Cohen MS, Eron JJ, Ferrari G, Garcia JV, Gay CL, Goonetilleke N, Joseph SB, Swanstrom R, Turner AW, Wahl A. 2020. Curing HIV: Seeking to Target and Clear Persistent Infection. Cell 181:189–206. - PMC - PubMed
    1. Cohn LB, Chomont N, Deeks SG. 2020. The Biology of the HIV-1 Latent Reservoir and Implications for Cure Strategies. Cell Host Microbe 27:519–530. - PMC - PubMed
    1. Grau-Exposito J, Luque-Ballesteros L, Navarro J, Curran A, Burgos J, Ribera E, Torrella A, Planas B, Badia R, Martin-Castillo M, Fernandez-Sojo J, Genesca M, Falco V, Buzon MJ. 2019. Latency reversal agents affect differently the latent reservoir present in distinct CD4+ T subpopulations. PLoS Pathog 15:e1007991. - PMC - PubMed

Publication types