[Preprint]. 2023 Jul 26:2023.07.24.550282.
doi: 10.1101/2023.07.24.550282.

Spatial and single-nucleus transcriptomic analysis of genetic and sporadic forms of Alzheimer's Disease

Affiliations

Spatial and single-nucleus transcriptomic analysis of genetic and sporadic forms of Alzheimer's Disease

Emily Miyoshi et al. bioRxiv. .

Update in

  • Spatial and single-nucleus transcriptomic analysis of genetic and sporadic forms of Alzheimer's disease.
    Miyoshi E, Morabito S, Henningfield CM, Das S, Rahimzadeh N, Shabestari SK, Michael N, Emerson N, Reese F, Shi Z, Cao Z, Srinivasan SS, Scarfone VM, Arreola MA, Lu J, Wright S, Silva J, Leavy K, Lott IT, Doran E, Yong WH, Shahin S, Perez-Rosendahl M; Alzheimer’s Biomarkers Consortium–Down Syndrome (ABC–DS); Head E, Green KN, Swarup V. Miyoshi E, et al. Nat Genet. 2024 Dec;56(12):2704-2717. doi: 10.1038/s41588-024-01961-x. Epub 2024 Nov 22. Nat Genet. 2024. PMID: 39578645 Free PMC article.

Abstract

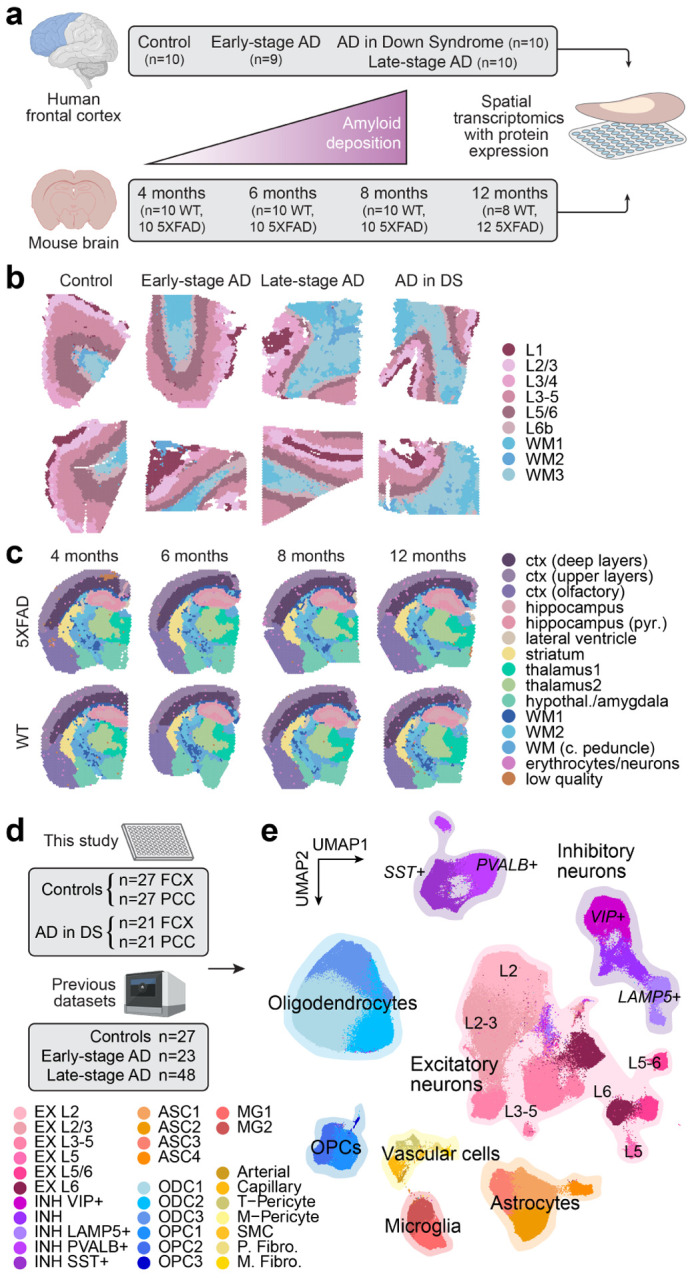
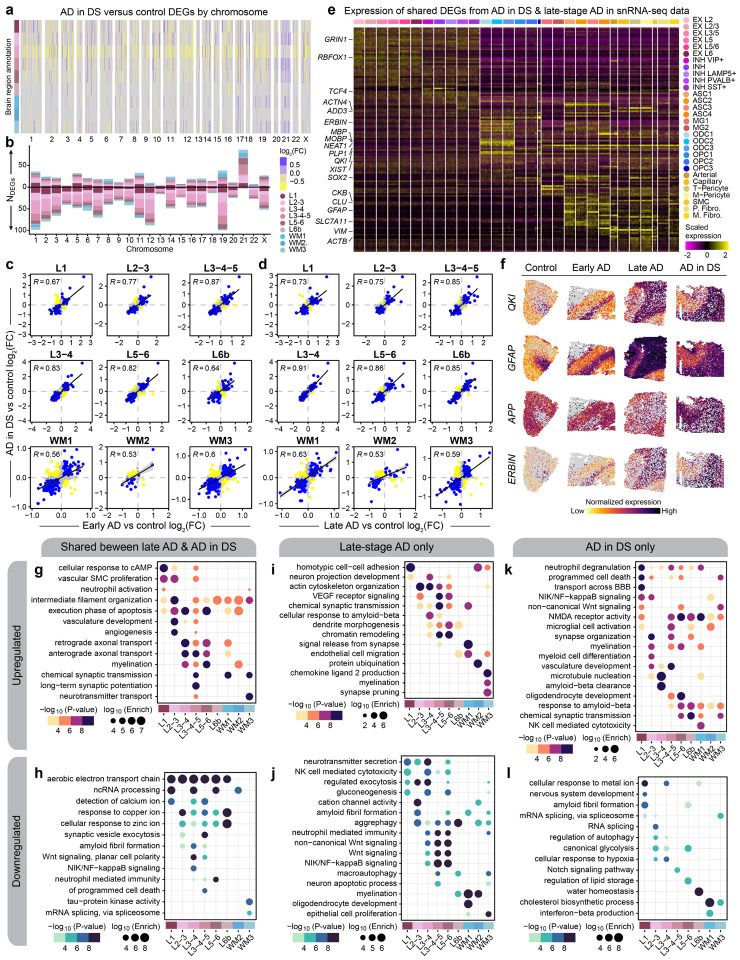
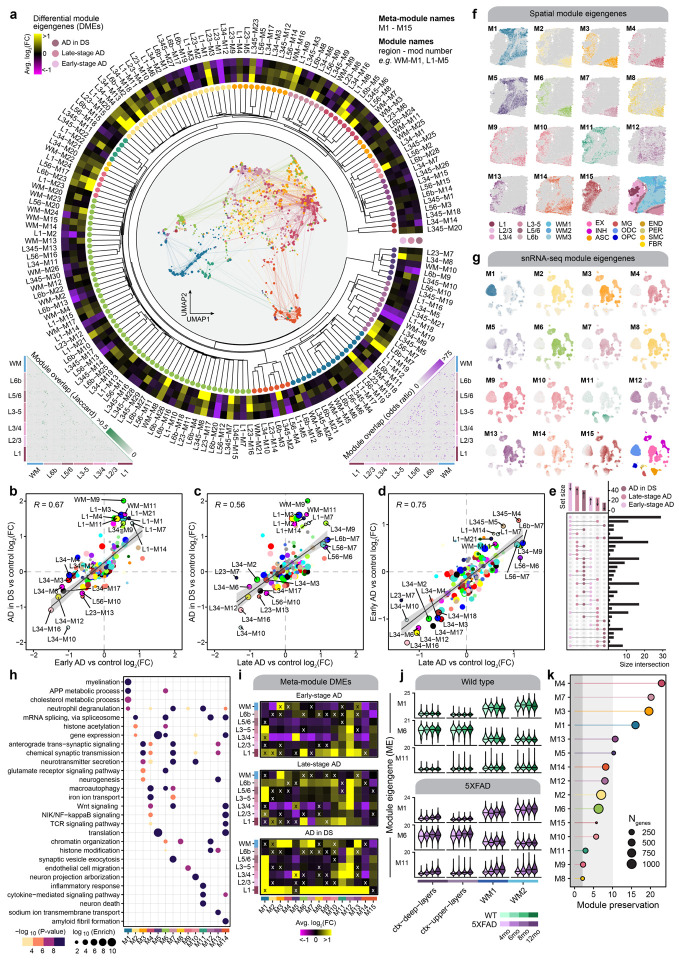
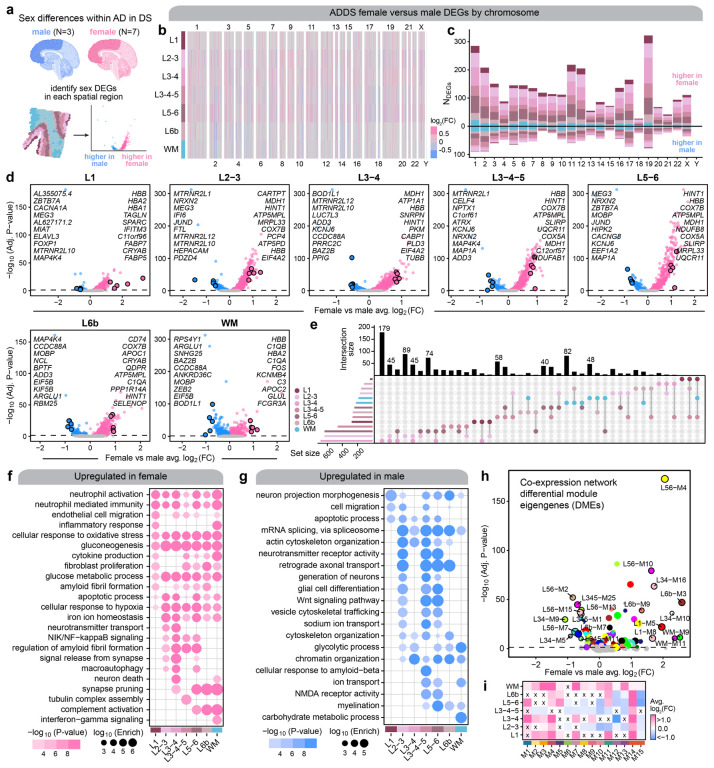
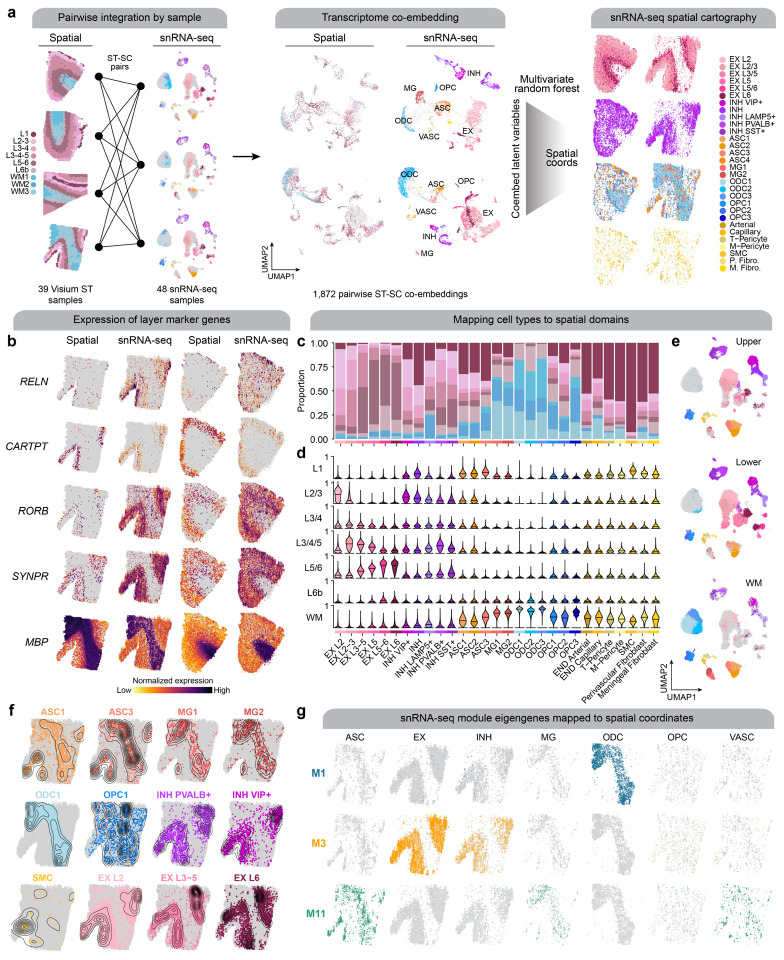
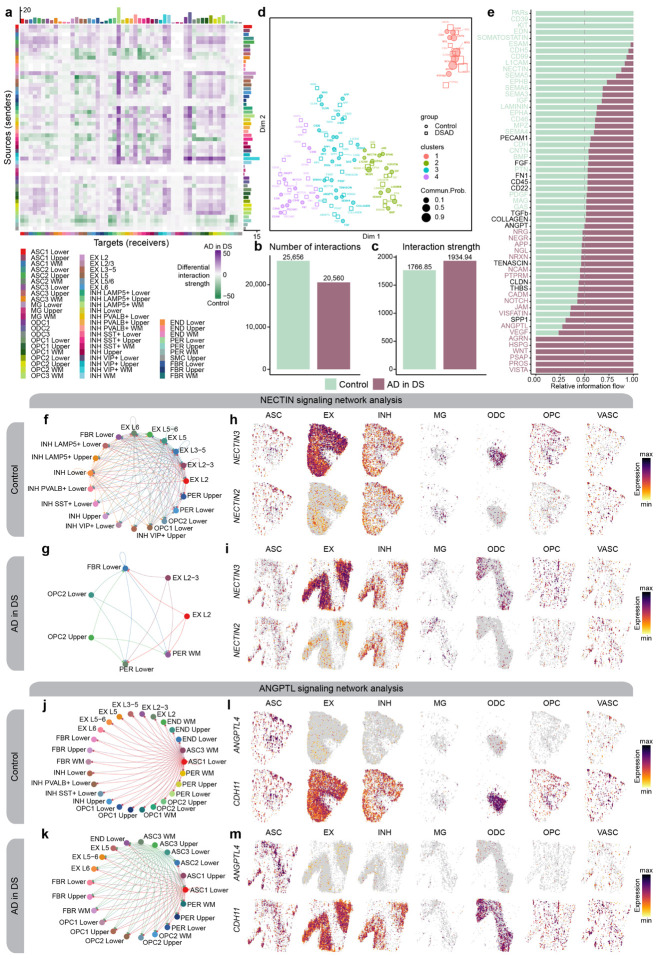
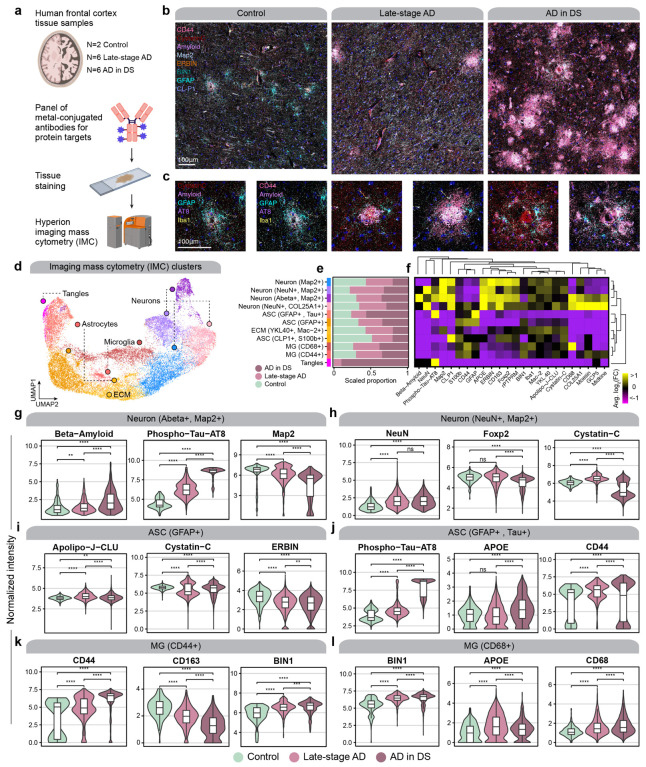
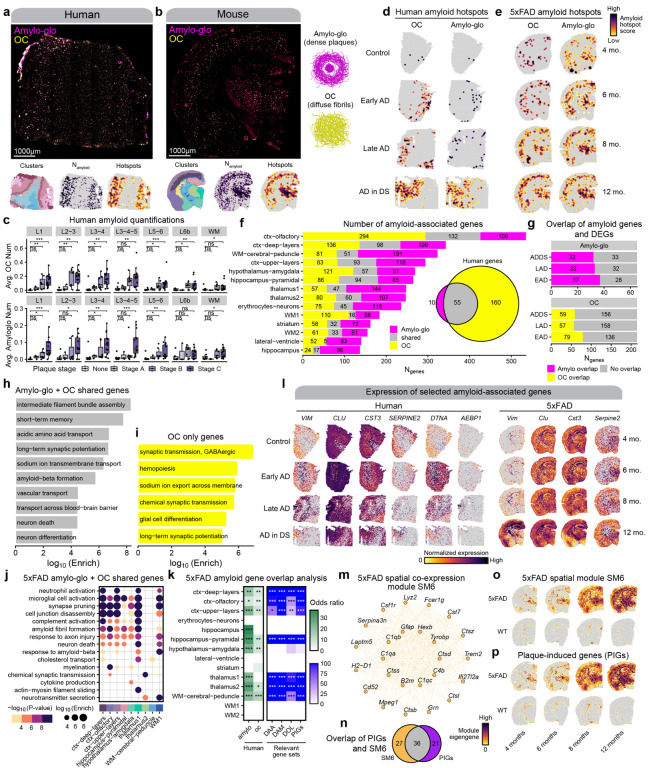
The pathogenesis of Alzheimer's disease (AD) depends on environmental and heritable factors, with remarkable differences evident between individuals at the molecular level. Here we present a transcriptomic survey of AD using spatial transcriptomics (ST) and single-nucleus RNA-seq in cortical samples from early-stage AD, late-stage AD, and AD in Down Syndrome (AD in DS) donors. Studying AD in DS provides an opportunity to enhance our understanding of the AD transcriptome, potentially bridging the gap between genetic mouse models and sporadic AD. Our analysis revealed spatial and cell-type specific changes in disease, with broad similarities in these changes between sAD and AD in DS. We performed additional ST experiments in a disease timecourse of 5xFAD and wildtype mice to facilitate cross-species comparisons. Finally, amyloid plaque and fibril imaging in the same tissue samples used for ST enabled us to directly link changes in gene expression with accumulation and spread of pathology.


Figures

Figure 1.
Figure 1.. Spatial and single-nucleus transcriptomic analysis of genetic and sporadic forms of AD.
a, We performed spatial transcriptomic experiments in the human frontal cortex and the mouse brain using 10X Genomics Visium. Human samples: n=10 cognitively normal controls; n=9 early-stage AD; n=10 late-stage AD; n=10 AD in DS. Mouse samples: n=10 WT and n=10 5xFAD aged 4 months; n=10 WT and n=10 5xFAD aged 6 months; n=10 WT and n=10 5xFAD aged 8 months; n=8 WT and n=12 5xFAD aged 12 months. b, Two representative human ST samples from each of the disease conditions, where each spot is colored by cortical annotations derived from unbiased spatial transcriptome clustering analysis. c, One representative mouse ST sample from WT and 5xFAD at each of the four time points, where each spot is colored by brain region annotations derived from unbiased spatial transcriptome clustering analysis. d, We performed single-nucleus RNA-seq (snRNA-seq) in the frontal cortex and posterior cingulate cortex from cognitively normal control donors (n=27 FCX, n=27 PCC) and AD in DS donors (n=21 FCX, n=21 PCC). We also included snRNA-seq data from three previous studies of the cortex in AD (n=27 controls, n=23 early-stage AD, n=48 late-stage AD). e, Uniform manifold approximation and projection (UMAP) plot depicting a two-dimensional view of the cellular neighborhood graph of 585,042 single-nuclei transcriptome profiles. Each point in this plot represents one cell, colored by their cell-type annotations derived from Leiden clustering analysis. Illustrations created with Biorender.com.
Figure 2.
Figure 2.. Shared and distinct gene expression signatures among subtypes of AD.
a, Heatmap colored by effect size from the AD in DS versus control differential gene expression analysis, with genes stratified by chromosome and by spatial region. Statistically significant (FDR < 0.05) genes with an absolute average log2(fold-change) >=0.25 in at least one region are shown. b, Stacked bar chart showing the number of AD in DS versus control DEGs in each spatial region stratified by chromosome. c, Comparison of differential expression effect sizes from early-stage AD versus control and AD in DS versus control. Genes that were statistically significant (adjusted p-value < 0.05) in either comparison were included in this analysis. Genes are colored blue if the direction is consistent, yellow if inconsistent, and grey if the absolute effect sizes were smaller than 0.05. Black line represents a linear regression with a 95% confidence interval shown in grey. Pearson correlation coefficients are shown in the upper left corner of each panel. d, Comparison of differential expression effect sizes from late-stage AD versus control and AD in DS versus control, layout as in panel (c). e, Heatmap showing the gene expression values in the snRNA-seq dataset of spatial DEGs shared between AD in DS and late-stage AD. f, Spatial feature plots of four selected DEGs (QKI, GFAP, APP, and ERBIN) in one representative sample from each disease group. g-h, Selected pathway enrichment results from DEGs that were upregulated (g) or downregulated (h) in both late-stage AD and AD in DS compared to controls. i-j, Selected pathway enrichment results from DEGs that were upregulated (i) or downregulated (j) in late-stage AD exclusively. k-l, Selected pathway enrichment results from DEGs that were upregulated (k) or downregulated (l) in AD in DS exclusively.
Figure 3.
Figure 3.. Multi-scale spatial co-expression network analysis reveals systems-level transcriptome alterations in AD.
a, Dendrogram shows the of partitioning 166 gene co-expression modules into 15 brain-wide meta-modules. Network plot in the center represents a consensus co-expression network constructed from grey matter cortical clusters and white matter, where each dot represents a gene colored by meta-module assignment. Heatmap shows effect sizes from differential module eigengene (DME) testing in early-stage AD, late-stage AD, and AD in DS compared with controls. Triangular heatmaps show measures of distance between modules (bottom left: Jaccard index, bottom right: odds ratio). b-d, Comparison of effect sizes from differential module eigengenes testing in early-stage AD and AD in DS (b), late-stage AD and AD in DS (c), and late-stage AD and early-stage AD (d). Each dot represents a gene co-expression module, and selected modules are labeled. Black line represents a linear regression with a 95% confidence interval shown in grey. Pearson correlation coefficients are shown in the upper left corner of each panel. e, Upset plot showing the overlap between sets of differentially expressed modules in each disease group. f, Spatial expression profiles (module eigengenes, MEs) of the 15 meta-modules in one representative sample. Darker color corresponds to higher expression levels. A spatial plot with each spot colored by cluster assignment is shown in the bottom right corner as a visual aid. g, UMAP feature plots showing MEs of the 15 spatial meta-modules projected into the snRNA-seq dataset. Darker color corresponds to higher expression levels. The UMAP plot colored by major cell type is shown in the bottom right corner as a visual aid. h, Selected pathway enrichment results for each meta-module. i, Heatmaps showing the meta-module DME results for each cortical layer and white matter in the early-stage AD (top), late-stage AD (middle), and AD in DS (bottom) samples compared to controls. DME tests were performed similarly to those shown in panel (a). X symbol indicates that the test did not reach statistical significance. j, Violin plots showing MEs of selected meta-modules (M1, M6, and M11) in the 5xFAD mouse dataset, split by age group, with black line indicating the median ME. k, Lollipop plot showing module preservation analysis of the meta-modules projected into the 5xFAD mouse dataset. Z-summary preservation > 10: highly preserved; 10 > Z-summary preservation > 2: moderately preserved; 2 > Z-summary preservation: not preserved.
Figure 4.
Figure 4.. Sex differences within the AD in DS cohort.
a, We performed differential expression analyses between female and male samples for each spatial cluster within the AD in DS cohort for our ST dataset. Since we had more female than male samples in the ST dataset, we subsampled the ST spots in the female samples to match the number from the male samples (Methods). b, Heatmap colored by effect size from the AD in DS female versus male differential gene expression analysis, with genes stratified by chromosome and by spatial region. Statistically significant (FDR < 0.05) genes with an absolute average log2(fold-change) >= 0.25 in at least one region are shown. c, Stacked bar chart showing the number of AD in DS female versus male DEGs in each spatial region stratified by chromosome. d, Volcano plots showing the effect size and significance level from the AD in DS female versus male differential expression tests in each of the spatial clusters. The top 10 and bottom 10 significant genes by effect size are labeled, excluding the set of genes that are commonly DE among all the spatial clusters. e, Upset plot showing the overlap between sets of DEGs in each spatial clusters. f-g, Selected pathway enrichment analysis from DEGs that were upregulated in female (f) or in male (g). h, Volcano plot showing the effect size and significance level from the AD in DS female versus male differential module eigengene (DME) analysis, with the top 10 and bottom 10 modules labeled. i, Heatmap showing the meta-module AD in DS female versus male DME results for each cortical layer and white matter. DME tests were performed similarly to those shown in panel (h). X symbol indicates that the test did not reach statistical significance.
Figure 5.
Figure 5.. Systematic integration of spatial and single-nucleus expression profiles.
a, We performed a systematic pairwise integration of biological samples profiled with spatial and single-nucleus transcriptomics (left). For all possible pairs of ST + snRNA-seq samples, we constructed a transcriptomic co-embedding (middle), and then we used a multivariate random forest model (CellTrek) to predict the spatial coordinates of each snRNA-seq cell in the given spatial context. The snRNA-seq dataset is shown on the right projected into two different spatial contexts (left: control sample; right: AD in DS sample), split by major cell lineages and colored by cell annotations. b, Spatial feature plots of selected layer-specific marker genes, shown side-by-side in the ST dataset and the snRNA-seq dataset projected into the spatial context for one AD in DS sample (left) and one control sample (right). c, Stacked bar plot showing the proportion of nuclei from each snRNA-seq cluster mapped to the spatial domains defined by the ST clustering. d, Violin plots showing the distribution of spatial domain mapping probabilities for nuclei from each of the snRNA-seq clusters. e, UMAP plot of the snRNA-seq dataset split by predicted spatial partitions into the upper cortical layers, lower cortical layers, or the white matter. f, Spatial density plot showing the snRNA-seq dataset in predicted spatial coordinates, highlighting selected cell populations. g, Spatial feature plots showing selected module eigengenes in the snRNA-seq dataset in predicted spatial coordinates.
Figure 6.
Figure 6.. Altered cell-cell communication signaling networks in AD in DS.
a, Heatmap showing the differential cell-cell communication (CCC) interaction strength between AD in DS and control. Each cell represents a snRNA-seq cell population, where rows correspond to signaling sources and columns correspond to signaling targets. Bar plots on the top and right show the sum of the incoming and outgoing signaling respectively. b-c, Bar plots showing the total number of CCC interactions (b) and interaction strength (c) for control and AD in DS. d, Joint dimensionality reduction and clustering of signaling pathways inferred from AD in DS and control data based on their functional similarity. Each point represents a signaling pathway. e, Bar plots showing signaling pathways with significant differences between AD in DS and controls, ranked based on their information flow (sum of communication probability among all pairs of cell populations in the network). f-g, Network plot showing the CCC signaling strength between different cell populations in AD in DS (f) and controls (g) for the NECTIN signaling pathway. h-i, Spatial feature plots of the snRNA-seq in predicted spatial coordinates for one control sample (h) and one AD in DS sample (i) for one ligand and one receptor in the NECTIN pathway. j-k, Network plot as in panels (f-g) in AD in DS (j) and controls (k) for the ANGPTL signaling pathway. l-m, Spatial feature plots as in panels (h-i) for one control sample (l) and one AD in DS sample (m) for the ANGPTL pathway.
Figure 7.
Figure 7.. Imaging mass cytometry reveals spatial proteomic changes in AD.
a, We performed imaging mass cytometry (IMC) in postmortem human cortical tissue (n=2 control, n=6 late-stage AD, n=6 AD in DS) using the Standard BioTools Hyperion Imaging System. b, Representative IMC images from control, late-stage AD, and AD in DS samples with select targets from the panel. c, Images as in panel (b) at higher magnification and focused around amyloid plaques. d, UMAP plot showing the unbiased clustering of segmented nuclei from the IMC dataset based on their protein intensity values. Each dot represents a segmented nucleus, colored by cluster assignment. e, Stacked bar plots showing the proportion of segmented nuclei assigned to each cluster stratified by disease groups. f, Heatmap showing the relative protein intensity of each protein in each IMC cluster. Dendrograms depict hierarchical clustering results based on these relative intensities. g-l, Violin plots showing the distribution of protein intensities for selected proteins in specified IMC clusters, stratified by disease groups. Wilcox test comparison results are overlaid on each plot. Not significant (ns), p > 0.05; * p <= 0.05; ** p <= 0.01; *** p <= 0.001, **** p<= 0.0001.
Figure 8.
Figure 8.. Identifying amyloid-associated gene expression signatures.
a-b, Representative fluorescent whole-section images from one AD in DS (a) and one 12-month 5xFAD sample (b) stained with Amylo-glo and OC to mark dense amyloid plaques and diffuse amyloid fibrils respectively. ST data colored by cluster (left), amyloid quantification (middle), and amyloid hotspot analysis (right) are shown below the images. c-d, Spatial feature plots showing the amyloid hotspot analysis results (Getis-Ord Gi* statistic) for the human (c) and mouse (d) ST datasets for OC (left) and Amylo-glo (right). e, Box and whisker plots showing the distribution of amyloid quantifications in the human ST dataset, stratifying samples by their neuropathological plaque staging. Box boundaries and line correspond to the interquartile range (IQR) and median, respectively. Whiskers extend to the lowest or highest data points that are no further than 1.5 times the IQR from the box boundaries. f, Stacked bar plot showing the number of amyloid-associated genes from Amylo-glo, OC, and shared for each of the mouse ST clusters. Euler diagram shows the number of Amylo-gloand OC-associated genes in the human dataset, and the overlap between these gene sets. g, Bar plots show the number of Amylo-glo- and OC-associated genes that overlap with disease DEGs. h-i, Selected pathway enrichment results from amyloid-associated genes that were shared between Amylo-glo and OC (h) and OC-specific (i) in the human ST dataset. j, Selected pathway enrichment results from amyloid-associated genes that were shared between Amylo-glo and OC for each cluster in the mouse ST dataset. k, Heatmap showing gene set overlap analysis results with the mouse amyloid-associated genes and human (left), and with other relevant gene sets (DAA: Disease-associated astrocytes; DAM: Disease-associated microglia; DOL: Disease-associated oligodendrocytes; PIGs: Plaque-induced genes). Fisher’s exact test results shown as follows: Not significant (ns), p > 0.05; * p <= 0.05; ** p <= 0.01; *** p <= 0.001, **** p<= 0.0001. l, Spatial feature plots of selected amyloid-associated genes in representative samples from the human (left) and mouse (right) ST datasets. m, Network plot showing module hub genes from the mouse spatial co-expression network module SM6. n, Euler plot showing the gene set overlap of the SM6 module and the PIGs module from Chen et al.. o-p Spatial feature plots showing the module eigengenes for the SM6 module (o) and the PIGs module (p) in representative samples of the mouse ST dataset.

References

    1. BRAIN Initiative Cell Census Network (BICCN), BRAIN Initiative Cell Census Network (BICCN) Corresponding authors, Callaway Edward M, Dong Hong-Wei, Ecker Joseph R, Hawrylycz Michael J, Huang Z Josh, Ed Lein S, Ngai John, Osten Pavel, et al. A multimodal cell census and atlas of the mammalian primary motor cortex. Nature, 598(7879):86–102, 2021. ISSN 0028–0836. doi: 10.1038/s41586-021-03950-0. - DOI - PMC - PubMed
    1. Lake Blue B., Ai Rizi, Kaeser Gwendolyn E., Salathia Neeraj S., Yung Yun C., Liu Rui, Wildberg Andre, Gao Derek, Fung Ho-Lim, Chen Song, et al. Neuronal subtypes and diversity revealed by single-nucleus RNA sequencing of the human brain. Science, 352(6293):1586–1590, 2016. ISSN 0036–8075. doi: 10.1126/science.aaf1204. - DOI - PMC - PubMed
    1. Darmanis Spyros, Sloan Steven A., Zhang Ye, Enge Martin, Caneda Christine, Shuer Lawrence M., Hayden Gephart Melanie G., Barres Ben A., and Quake Stephen R.. A survey of human brain transcriptome diversity at the single cell level. Proceedings of the National Academy of Sciences, 112(23):7285–7290, 2015. ISSN 0027–8424. doi: 10.1073/pnas.1507125112. - DOI - PMC - PubMed
    1. Hodge Rebecca D., Bakken Trygve E., Miller Jeremy A., Smith Kimberly A., Barkan Eliza R., Graybuck Lucas T., Close Jennie L., Long Brian, Johansen Nelson, Penn Osnat, et al. Conserved cell types with divergent features in human versus mouse cortex. Nature, 573 (7772):61–68, 2019. ISSN 0028–0836. doi: 10.1038/s41586-019-1506-7. - DOI - PMC - PubMed
    1. Tasic Bosiljka, Menon Vilas, Thuc Nghi Nguyen Tae Kyung Kim, Jarsky Tim, Yao Zizhen, Levi Boaz, Gray Lucas T, Sorensen Staci A, Dolbeare Tim, et al. Adult mouse cortical cell taxonomy revealed by single cell transcriptomics. Nature Neuroscience, 19(2):335–346, 2016. ISSN 1097–6256. doi: 10.1038/nn.4216. - DOI - PMC - PubMed

Publication types