[Preprint]. 2023 Jun 20:2023.06.20.545796.
doi: 10.1101/2023.06.20.545796.

Functionalized graphene-oxide grids enable high-resolution cryo-EM structures of the SNF2h-nucleosome complex without crosslinking

Affiliations

Functionalized graphene-oxide grids enable high-resolution cryo-EM structures of the SNF2h-nucleosome complex without crosslinking

Un Seng Chio et al. bioRxiv. .

Update in

Abstract

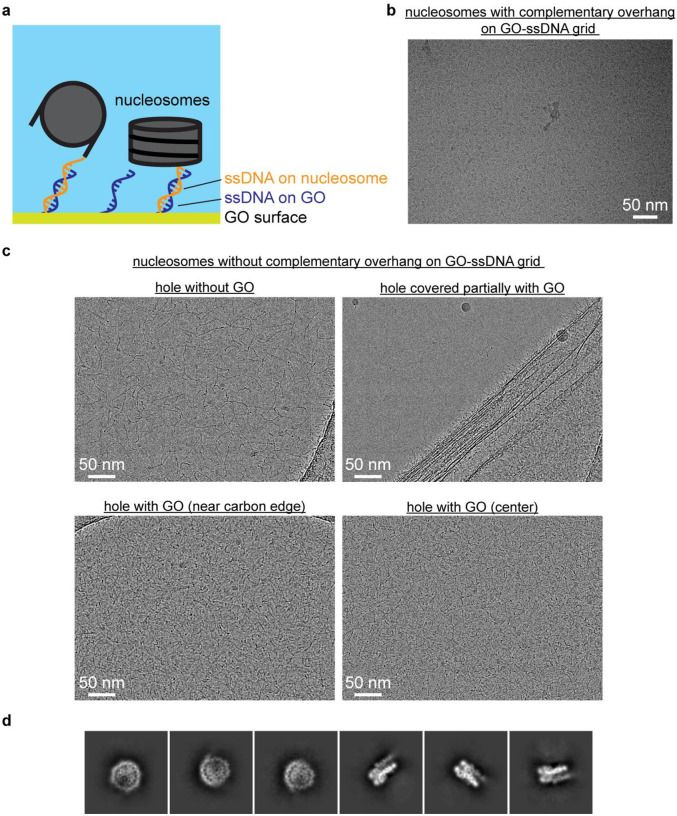
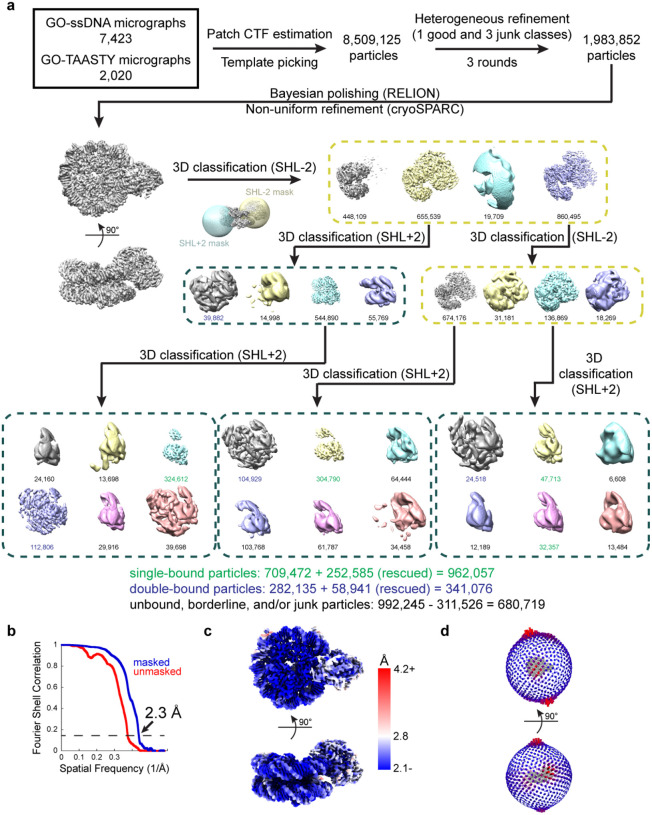
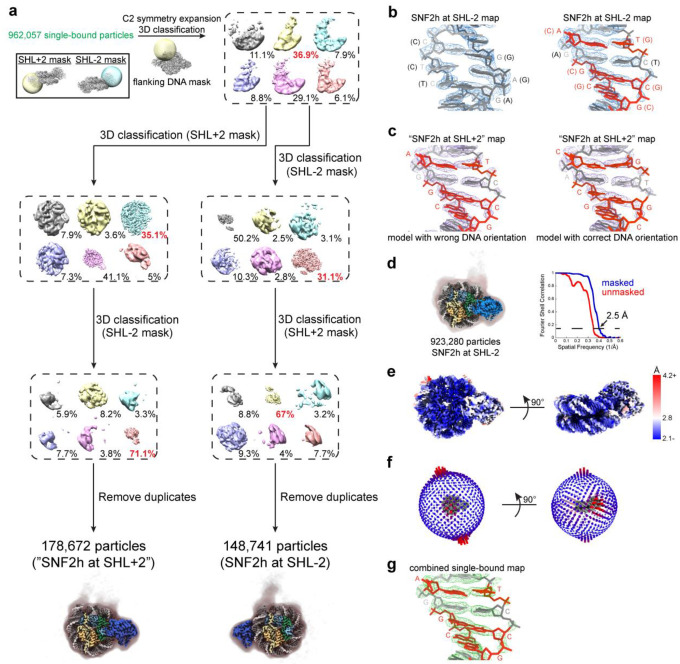
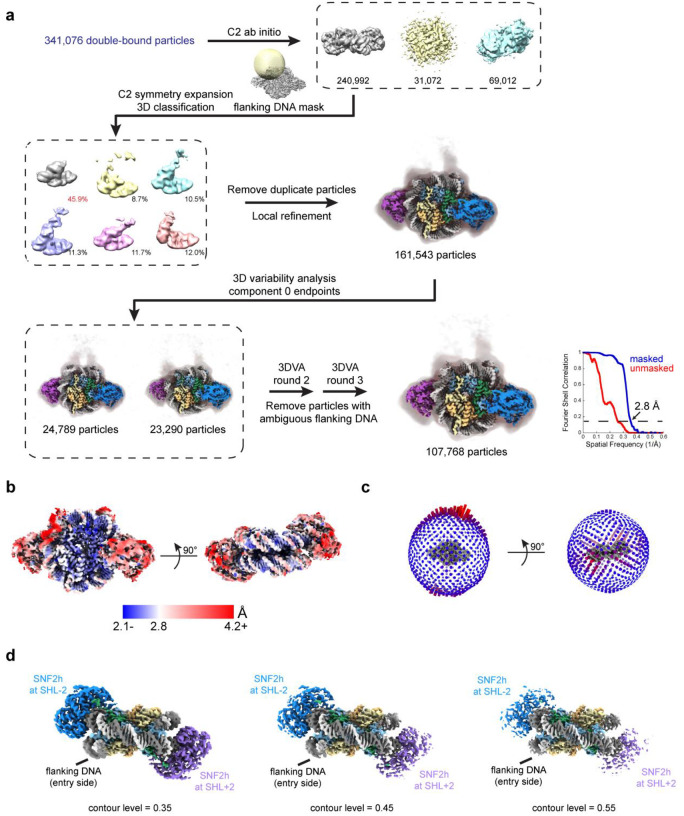
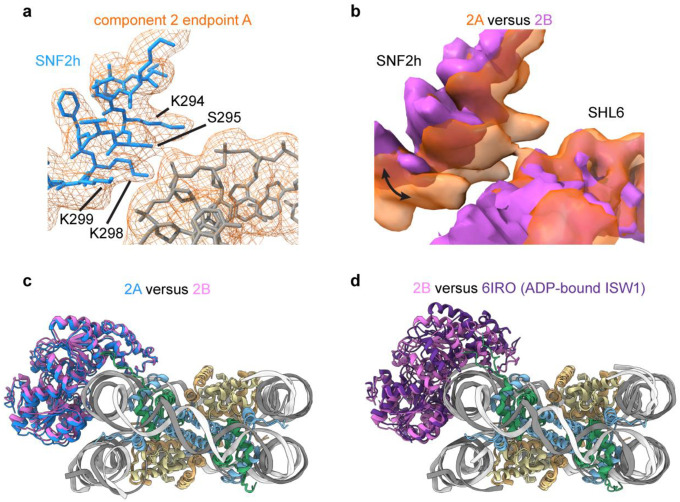
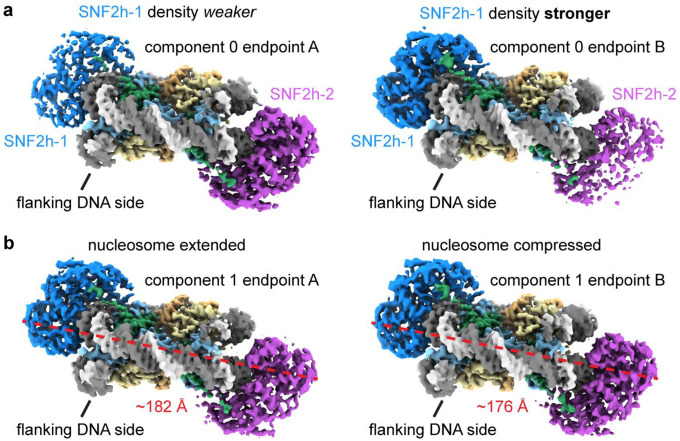
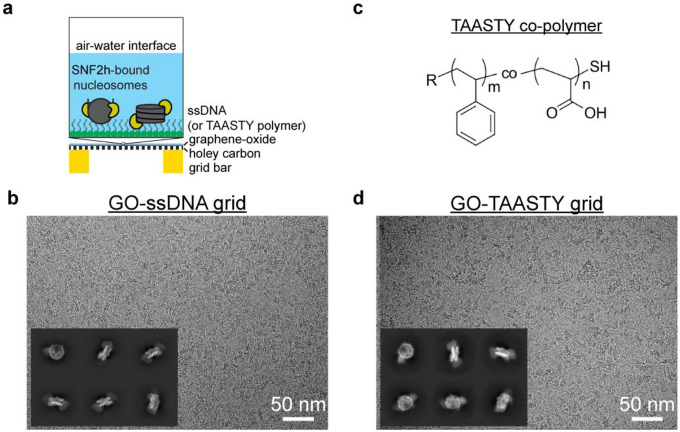
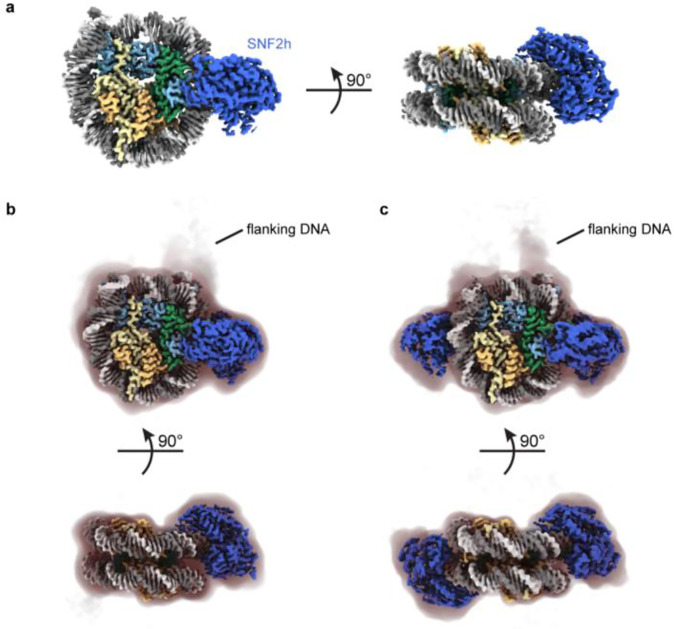
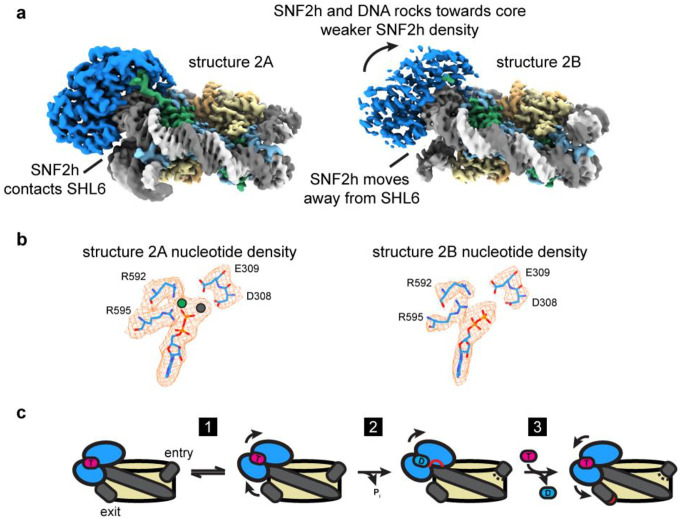
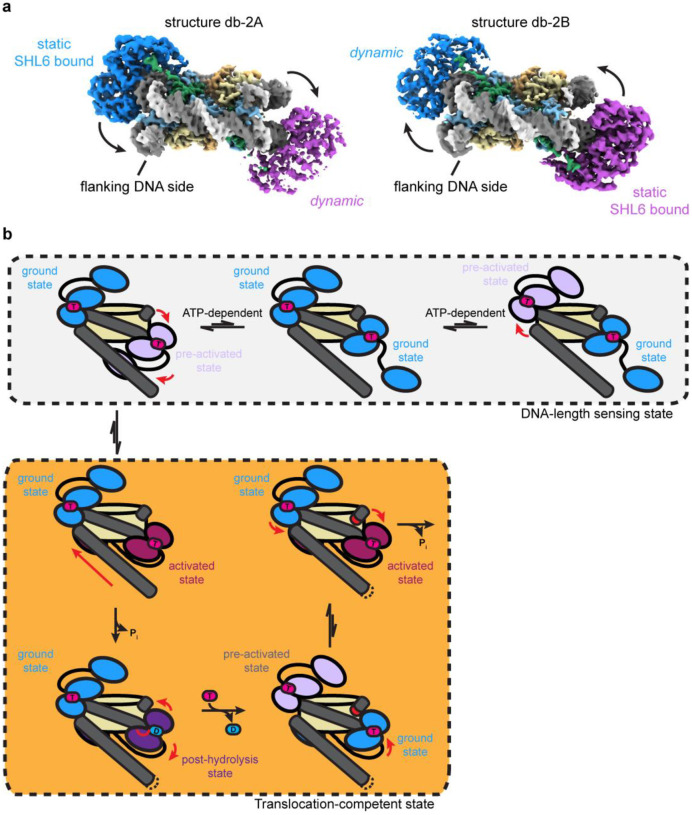
Single-particle cryo-EM is widely used to determine enzyme-nucleosome complex structures. However, cryo-EM sample preparation remains challenging and inconsistent due to complex denaturation at the air-water interface (AWI). To address this issue, we developed graphene-oxide-coated EM grids functionalized with either single-stranded DNA (ssDNA) or thiol-poly(acrylic acid-co-styrene) (TAASTY) co-polymer. These grids protect complexes between the chromatin remodeler SNF2h and nucleosomes from the AWI and facilitated collection of high-quality micrographs of intact SNF2h-nucleosome complexes in the absence of crosslinking. The data yields maps ranging from 2.3 to 3 Å in resolution. 3D variability analysis reveals nucleotide-state linked conformational changes in SNF2h bound to a nucleosome. In addition, the analysis provides structural evidence for asymmetric coordination between two SNF2h protomers acting on the same nucleosome. We envision these grids will enable similar detailed structural analyses for other enzyme-nucleosome complexes and possibly other protein-nucleic acid complexes in general.

Keywords: ISWI; SNF2h; chromatin remodeler; graphene oxide; nucleosome; single-particle cryo-EM.


Conflict of interest statement

Competing Interests The authors declare no competing interests.

Figures

Extended Data Fig. 1.
Extended Data Fig. 1.. ssDNA GO grids protect nucleosomes from the AWI.
a) Schematic illustrating the use of complementary DNA sequences to bring nucleosomes closer to the GO surface away from the AWI. b) Representative micrograph of nucleosomes with complementary ssDNA overhang on an ssDNA GO grid. c) Representative micrographs of nucleosomes on an ssDNA GO grid. Areas without GO display denatured nucleosomes (upper left). A hole partially covered with GO shows nucleosomes are only visible in the area with GO (upper right). The nucleosomes appear uniformly spread across holes covered with GO (lower left and lower right). d) Representative 2D classes showing intact nucleosomes on an ssDNA GO grid.
Extended Data Fig. 2.
Extended Data Fig. 2.. Cryo-EM data processing for SNF2h-nucleosome datasets.
a) Schematic illustrating the initial processing workflow from micrographs to separating single- and double-bound SNF2h-nucleosome complexes as described in Methods. Particle counts for single-bound classes are colored in green and particle counts for double-bound classes are colored in blue. An additional round of classification (not graphically depicted) with particles from other classes was performed to rescue additional single- and double-bound particles (252,585 and 58,941 particles, respectively), leading to the final particle counts denoted. b) Gold-standard FSCs for the consensus map containing both single- and double-bound particles determined without masking (red) and by cryoSPARC masking (blue). c) The consensus SNF2h-nucleosome map surface colored by local resolution determined by cryoSPARC with FSC cutoff of 0.143. d) Angular distribution plots for the consensus SNF2h-nucleosome map.
Extended Data Fig. 3.
Extended Data Fig. 3.. Classification and assessment of DNA sequence for single-bound SNF2h-nucleosome complexes.
a) Schematic illustrating processing workflow to identify single-bound SNF2h-nucleosome complexes with SNF2h at either the SHL+2 or SHL-2 position as described in Methods. b) (left) DNA modeled into region of density in the single-bound SNF2h at SHL-2 nucleosome map corresponding to DNA where purines and pyrimidines remain the same regardless of the orientation of the 601 sequence. (right) DNA modeled into region of density in the single-bound SNF2h at SHL-2 nucleosome map corresponding to DNA where certain purines and pyrimidines (in orange) would be flipped depending on the orientation of the 601 sequence. The DNA built with the orientation corresponding to SNF2h at SHL-2 fits the density well. c) (left) DNA modeled into the same region of density in the single-bound “SNF2h at SHL+2” map as in b). The model built with the wrong DNA orientation as in b) does not match the density well. (right) DNA modeled in the opposite orientation into the same region of density in the single-bound “SNF2h at SHL+2” map. The model built with DNA in the correct orientation matches the density well, suggesting that SNF2h in this map is also at SHL-2 instead. d) Non-uniform refinement of all 923,280 single-bound particles after duplicate removal resulted in a 2.5 Å global resolution map based on gold-standard FSC determined by cryoSPARC. A Gaussian-filtered map at lower contour is shown as a shadow to indicate the position of flanking DNA, which appears to be conformationally heterogeneous. e) The single-bound SNF2h-nucleosome map surface colored by local resolution determined by cryoSPARC with FSC cutoff of 0.143. f) Angular distribution plots for the single-bound SNF2h-nucleosome map. g) DNA modeled into region of density in the map from a) corresponding to DNA where certain purines and pyrimidines (in orange) would be flipped depending on the orientation of the 601 sequence. DNA built with the orientation corresponding to SNF2h at SHL-2 fits the density well.
Extended Data Fig. 4.
Extended Data Fig. 4.. Classification for double-bound SNF2h-nucleosome complexes.
a) Schematic illustrating processing workflow to identify the location of flanking DNA for the double-bound SNF2h-nucleosome complex as described in Methods. The gold-standard FSC determined by cryoSPARC is plotted in blue (FSC threshold of 0.143 indicated with dotted line). b) The double-bound SNF2h-nucleosome map surface colored by local resolution determined by cryoSPARC with FSC cutoff of 0.143. c) Angular distribution plots for the double-bound SNF2h-nucleosome map. d) Coulomb potential map of the double-bound SNF2h-nucleosome complex shown at different contour levels. As the contour level increases, the density for SNF2h at the SHL+2 position appears weaker than the density for SNF2h at the SHL-2 position.
Extended Data Fig. 5.
Extended Data Fig. 5.. Densities for nucleotide in single- and double-bound SNF2h-nucleosome maps.
a) Clear density for only ADP was observed in the previously determined SNF2h-nucleosome structure at 3.4 Å resolution (PDB 6NE3 in EMD-9352). b) Extra density corresponding to Mg2+ and BeFx ions are clearly visible in the combined single-bound SNF2h at SHL-2 map. c) Clear density for only ADP is observed in the SNF2h protomers in the double-bound SNF2h-nucleosome map (density shown at two different contour levels).
Extended Data Fig. 6.
Extended Data Fig. 6.. Comparison of single-bound SNF2h-nucleosome maps and models.
a) Gaussian filtered maps of the previously determined SNF2h-nucleosome structure at 140 mM KCl (top left; EMD-9352) and of the current SNF2h-nucleosome structure at 60 mM KCl (top right). An overlay of the two maps (bottom) is consistent with a 2-bp translocation observed for the structure at 140 mM KCl but not for the structure at 60 mM KCl. The flanking DNA also displays more conformational variability at 60 mM KCl. b) Per-residue root-mean-square deviation (RMSD) between the single- and double-bound SNF2h-nucleosome models determined in this study. Most residues within the histone octamer display RMSD differences of less than 1 Å. Most variation is observed with the flanking DNA and DNA at the SHL+2 position, which is altered due to the binding of the second SNF2h protomer in the double-bound complex.
Extended Data Fig. 7.
Extended Data Fig. 7.. Nucleosome expansion and compression.
a) Coulomb potential maps from refinements of subsets of particles corresponding to endpoints of principal component 0 from 3DVA of the single-bound SNF2h-nucleosome particles. b) Overlay of the maps from a) showing the dilation of structure 0B versus structure 0A in the x direction. c) Coulomb potential maps from refinements of subsets of particles corresponding to endpoints of principal component 4 from 3DVA of the single-bound SNF2h-nucleosome particles. d) Overlay of the maps from c) showing the dilation of structure 4A versus structure 4B in the y direction.
Extended Data Fig. 8.
Extended Data Fig. 8.. DNA unwrapping can occur with both entry and exit side DNA.
a) Coulomb potential maps from refinements of subsets of particles corresponding to endpoints of principal components 3 and 4 from 3D variability analysis of the single-bound SNF2h-nucleosome particles. For these two components, the entry side DNA unwraps, leading to loss of H3 and H2A densities for component 3 but not for component 4. b) Coulomb potential maps from refinements of subsets of particles corresponding to endpoints of principal component 5 from 3D variability analysis of the single-bound SNF2h-nucleosome particles. In this component, the exit side DNA unwraps, leading to loss of adjacent H3 and H2A densities.
Extended Data Fig. 9.
Extended Data Fig. 9.. SNF2h rocking to and from SHL6.
a) Interaction interface between SNF2h and nucleosomal DNA at SHL6 observed in endpoint structure 2A from 3DVA of the single-bound SNF2h-nucleosome particles. Clear contacts between DNA and residues K294, S295, K298, and K299 of SNF2h are observed. b) Overlay of coulomb potential maps for endpoint 2A and 2B illustrating movement of SNF2h to and from SHL6. c) Overlay of the models for single-bound SNF2h-nucleosome complex endpoint structures 2A and 2B. The entire SNF2h ATPase domain rocks upwards in structure 2B (pink) versus structure 2A (blue). d) Overlay of the models for single-bound SNF2h-nucleosome complex endpoint structure 2B and the previously determined ADP-bound ISW1-nucleosome structure (PDB 6IRO). While the bottom ATPase lobe (lobe 1) appears similarly positioned and dissociated from SHL6, the top ATPase lobe (lobe 2) dramatically shifts upwards in the ADP-bound structure.
Extended Data Fig. 10.
Extended Data Fig. 10.. Asymmetric and symmetric motions with double-bound SNF2h.
Coulomb potential maps from refinements of subsets of particles corresponding to endpoints of (a) principal component 0 and (b) principal component 1 from 3D variability analysis of the double-bound SNF2h-nucleosome particles. In (a), the density for the two SNF2h protomers alternate in strength between the two endpoints. In (b), the nucleosome extends and compresses between the two endpoints.
Fig. 1.
Fig. 1.. Functionalized GO grids protect SNF2h-nucleosome complexes from the air-water interface.
a) Schematic illustrating functionalized GO grids. GO is layered on top of a commercial Quantifoil holey carbon grid. The GO surface is then functionalized with either single-strand DNA or TAASTY co-polymer to attract SNF2h-nucleosome complexes away from the AWI. b) Representative micrograph of the SNF2h-nucleosome complex on a ssDNA GO grid. Representative 2D classes of particles picked from a ssDNA GO grid are also shown. c) Chemical structure of the TAASTY co-polymer. d) Representative micrograph of the SNF2h-nucleosome complex on a TAASTY GO grid. Representative 2D classes of particles picked from a TAASTY GO grid are also shown.
Fig. 2.
Fig. 2.. High-resolution SNF2h-nucleosome structures determined using functionalized GO grids.
a) Coulomb potential map of a consensus SNF2h-nucleosome complex at ~2.3 Å global resolution determined with datasets collected on ssDNA GO and TAASTY GO grids. b) Coulomb potential map of SNF2h bound to nucleosome at the inactive position at ~2.7 Å resolution. A filtered map at lower contour is shown as a shadow with the position of flanking DNA indicated. c) Coulomb potential map of the double-bound SNF2h-nucleosome complex at ~2.8 Å resolution. A filtered map at lower contour is shown as a shadow with the position of flanking DNA indicated.
Fig. 3.
Fig. 3.. SNF2h rocks on the nucleosome and intermittently contacts SHL6.
a) Two coulomb potential maps representing the endpoints of component 2 from 3DVA of the single-bound SNF2h-nucleosome particles. On one end (structure 2A), SNF2h is stably bound to nucleosome and contacts DNA at the SHL6 position. On the other end (structure 2B), SNF2h becomes more dynamic and dissociates from DNA at SHL6 while rocking slightly upward toward the histone octamer core. b) Density for nucleotide in structures 2A and 2B. Clear extra density is observed for Mg2+ and BeFx ions in structure 2A but not in structure 2B. c) Working model for SNF2h conformational changes during ATP-dependent translocation of DNA across a nucleosome. SNF2h is initially in a ground state stably bound to both ATP and DNA at SHL6. SNF2h then rocks upwards and dissociates from DNA at SHL6 (step 1). SNF2h hydrolyses ATP, which causes the top ATPase lobe of SNF2h to shift upward and promote partial translocation of DNA (step 2). Exchange of ADP for ATP finishes DNA translocation and resets SNF2h for subsequent rounds of ATP-dependent remodeling (step 3).
Fig. 4.
Fig. 4.. Coordinated asymmetric actions of SNF2h protomers on a nucleosome.
a) Two coulomb potential maps representing the endpoints of one principal component from 3DVA of the double-bound SNF2h-nucleosome particles. On one end (structure db-2A), one SNF2h is stably bound to the nucleosome, while the other SNF2h is more dynamic. On the other end (structure db-2B), the SNF2h that was stably bound to the nucleosome becomes more dynamic, while the SNF2h that was more dynamic becomes more static. b) Working model for SNF2h conformations while coordinating actions on a nucleosome. In the DNA-length sensing state, each SNF2h protomer can either be in a ground state or dynamic pre-activated state while searching for flanking DNA using its HAND-SANT-SLIDE (HSS) domain. The protomer that is able to sense flanking DNA will undergo further conformational change to reach an activated state that promotes ATP hydrolysis and DNA translocation. Exchange of ADP for ATP resets SNF2h to a ground state, and the other SNF2h protomer then has first priority to again search for flanking DNA in a dynamic, pre-activated state.

References

    1. Luger K., Mäder A. W., Richmond R. K., Sargent D. F. & Richmond T. J. Crystal structure of the nucleosome core particle at 2.8 Å resolution. Nature 389, 251–260 (1997). - PubMed
    1. McGinty R. K. & Tan S. Recognition of the nucleosome by chromatin factors and enzymes. Curr Opin Struct Biol 37, 54–61 (2016). - PMC - PubMed
    1. McGinty R. K. & Tan S. Principles of nucleosome recognition by chromatin factors and enzymes. Curr Opin Struct Biol 71, 16–26 (2021). - PMC - PubMed
    1. Zhou K., Gaullier G. & Luger K. Nucleosome structure and dynamics are coming of age. Nat Struct Mol Biol 26, 3–13 (2019). - PMC - PubMed
    1. Cheng Y. Single-particle cryo-EM—How did it get here and where will it go. Science 361, 876–880 (2018). - PMC - PubMed

Publication types