[Preprint]. 2023 Jul 27:2023.07.25.550489.
doi: 10.1101/2023.07.25.550489.

PMS1 as a target for splice modulation to prevent somatic CAG repeat expansion in Huntington's disease

Affiliations

PMS1 as a target for splice modulation to prevent somatic CAG repeat expansion in Huntington's disease

Zachariah L McLean et al. bioRxiv. .

Update in

Abstract

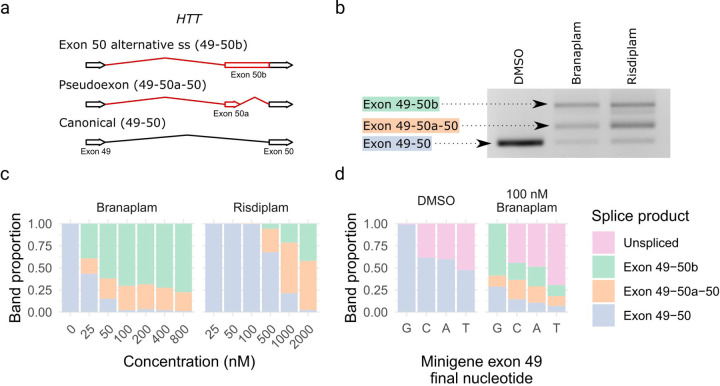
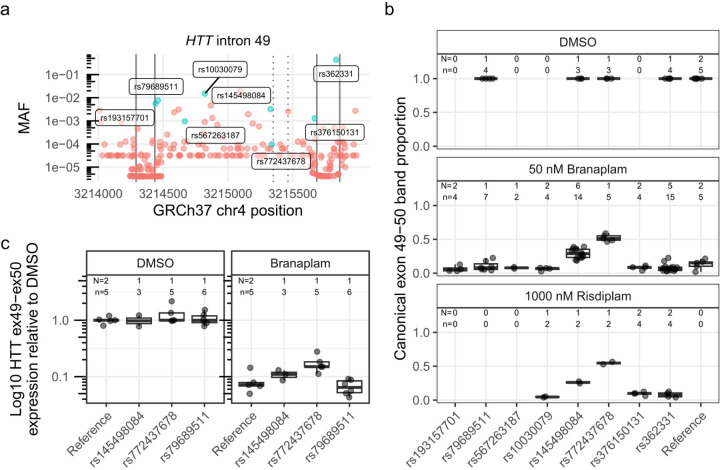
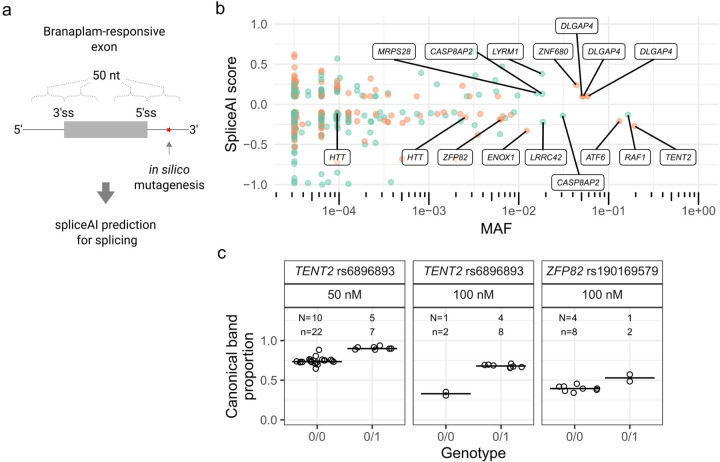
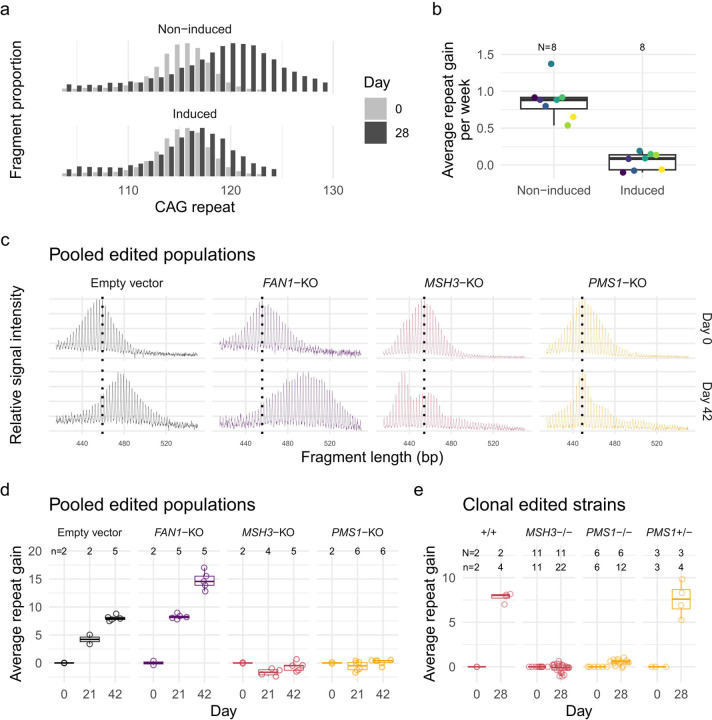
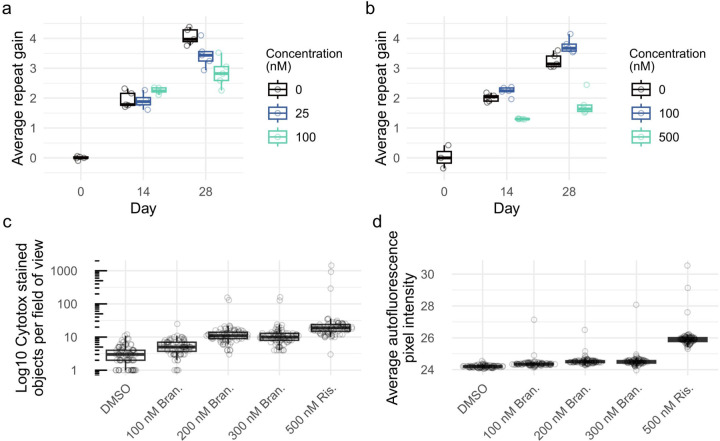
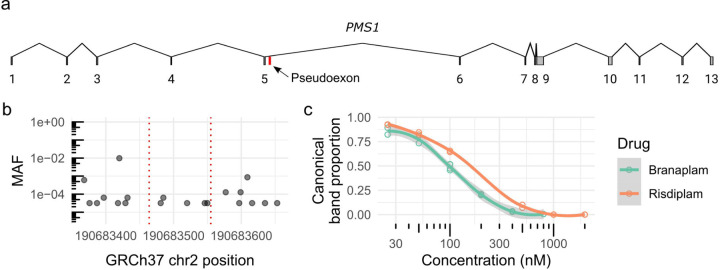
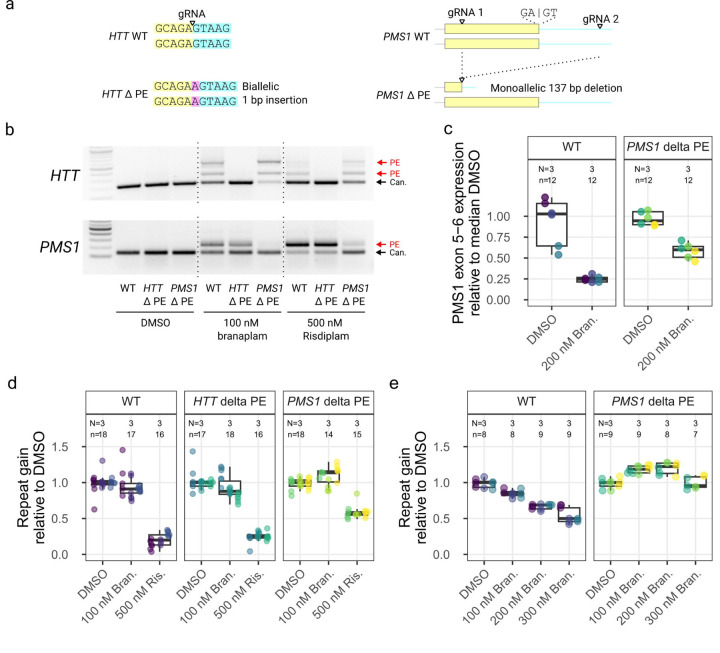
Huntington's disease (HD) is a dominantly inherited neurodegenerative disorder whose motor, cognitive, and behavioral manifestations are caused by an expanded, somatically unstable CAG repeat in the first exon of HTT that lengthens a polyglutamine tract in huntingtin. Genome-wide association studies (GWAS) have revealed DNA repair genes that influence the age-at-onset of HD and implicate somatic CAG repeat expansion as the primary driver of disease timing. To prevent the consequent neuronal damage, small molecule splice modulators (e.g., branaplam) that target HTT to reduce the levels of huntingtin are being investigated as potential HD therapeutics. We found that the effectiveness of the splice modulators can be influenced by genetic variants, both at HTT and other genes where they promote pseudoexon inclusion. Surprisingly, in a novel hTERT-immortalized retinal pigment epithelial cell (RPE1) model for assessing CAG repeat instability, these drugs also reduced the rate of HTT CAG expansion. We determined that the splice modulators also affect the expression of the mismatch repair gene PMS1, a known modifier of HD age-at-onset. Genome editing at specific HTT and PMS1 sequences using CRISPR-Cas9 nuclease confirmed that branaplam suppresses CAG expansion by promoting the inclusion of a pseudoexon in PMS1, making splice modulation of PMS1 a potential strategy for delaying HD onset. Comparison with another splice modulator, risdiplam, suggests that other genes affected by these splice modulators also influence CAG instability and might provide additional therapeutic targets.


Conflict of interest statement

Competing interests J.F.G. and V.C.W. were founding scientific advisory board members with a financial interest in Triplet Therapeutics Inc. Their financial interests were reviewed and are managed by Massachusetts General Hospital (MGH) and Mass General Brigham (MGB) in accordance with their conflict of interest policies. J.F.G. consults for Transine Therapeutics, Inc. and has previously provided paid consulting services to Wave Therapeutics USA Inc., Biogen Inc. and Pfizer Inc. V.C.W. is a scientific advisory board member of LoQus23 Therapeutics Ltd. and has provided paid consulting services to Acadia Pharmaceuticals Inc., Alnylam Inc., Biogen Inc. and Passage Bio. R.M.P. and V.C.W. have received research support from Pfizer Inc. B.P.K. is a consultant for EcoR1 capital and Curie.Bio, and is an advisor to Acrigen Biosciences, Life Edit Therapeutics and Prime Medicine. B.P.K. has a financial interest in Prime Medicine, Inc., a company developing therapeutic CRISPR-Cas technologies for gene editing. B.P.K.’s interests were reviewed and are managed by MGH and MGB in accordance with their conflict-of-interest policies. J-M.L. consults for Life Edit Therapeutics and serves on the scientific advisory board of GenEdit Inc. E.M. is inventor on an International Patent Application Number PCT/US2021/012103, assigned to Massachusetts General Hospital and PTC Therapeutics entitled “RNA Splicing Modulation” related to use of BPN-15477 in modulating splicing.

Figures

Figure 1.
Figure 1.
Branaplam and risdiplam treatment of HD LCLs produced two major HTT alternative splice products. (a) Schematic diagram showing the alternative HTT splice products upon drug treatment. (b) PCR from exon 49–50 showing the size of the splice products. (c) Branaplam and risdiplam dose response for each HTT splice product. (d) Quantification of splice products produced from mutant minigenes following transfection of HEK 293T cells either treated with a vehicle control (DMSO) or 100 nM branaplam.
Figure 2.
Figure 2.
Two single nucleotide variants affected HTT splice modulation. (a) Minor allele frequency (MAF) of variants spanning HTT exon 49–50 (exons marked with solid vertical lines), with variants represented in the cell lines tested labeled and highlighted in blue. The dotted vertical lines indicate the pseudoexon splice sites (ss). (b) The proportion of canonical HTT exon 49–50 product across tested cells lines, grouped by heterozygous presence of variant. Since the production of the pseudoexon requires drug treatment, only a subset of the cell lines were treated with DMSO control. (c) Absolute quantification by ddPCR across exon 49–50 junction for a subset of the cell lines on a log10 axis. N = Number of cell clones, n = cultures analyzed
Figure 3.
Figure 3.
SpliceAI identified variants predicted to affect splicing of genome-wide branaplam-responsive exons. (a) SpliceAI predictions were made for variants within 50 nt of branaplam-responsive exon and pseudoexon splice junctions. (b) Variants near branaplam-responsive pseudoexons (orange) and exons (green) that yield significant SpliceAI scores are plotted by allele frequency with gene names indicated for selected variants. HTT variants rs148430407 (MAF 2.6x10⁻³) and rs772437678 (MAF 9.6x10⁻⁵) are labelled, while rs145498084 did not have a significant SpliceAI score (c) SpliceAI-predicted variants affect splice modulation of TENT2 and ZFP82. Proportion of canonically spliced product across tested LCLs for TENT2 and ZFP82, grouped by no presence (0/0) or heterozygous presence (0/1) of variant. N = Number of cell lines for variant, n = cultures analyzed.
Figure 4.
Figure 4.
RPE1-AAVS1-CAG115 cell model for CAG repeat instability. (a) CAG repeat fragment distribution for a single RPE1-AAVS1-CAG115 clone in the absence (top) or presence (bottom) of doxycycline-induced transcription either at day 0 (light gray) or 28 (dark gray). (b) The average repeat gain per week for the 8 RPE1-AAVS1-CAG115 clones with either non-induced or induced transcription. Color indicates cell clone and N the total number of clones analyzed (c) Fragment analysis traces showing the change in CAG repeat length distribution across time in different non-edited and edited cells for pooled edited populations. Color indicates CRISPR-Cas9 target: non-targeting empty vector (black), FAN1 (purple), MSH3 (red), and PMS1 (orange). The plots represent raw fluorescent signal without baseline correction and therefore have a negative signal bias with increasing fragment size. The following instability metrics were derived from data processed in the GeneMapper software which corrects this bias. (d) Average repeat gain for pooled edited populations, with each dot representing a biological replicate. (e) Average repeat gain for cell clones isolated from either MSH3 (red) or PMS1 (orange) targeted populations. N = Number of cell clones, n = cultures analyzed.
Figure 5.
Figure 5.
Branaplam and risdiplam treatments reduced repeat expansion in RPE1-AAVS1-CAG115 cells. Average repeat gain of non-induced RPE1-AAVS1-CAG115 cells with treatment of either branaplam (a) or risdiplam (b), with the color indicating the drug concentration. Each treatment group and timepoint had five cultures analyzed, except risdiplam day 0 which had three. (c) Drug cytotoxicity quantified by high-throughput image analysis of cells treated with DNA labeling of dead cells. (d) Average background autofluorescence pixel intensity. For c and d, 81 images were analyzed per treatment.
Figure 6.
Figure 6.
HD modifier PMS1 contains a drug-inducible pseudoexon. (a) Schematic diagram of the PMS1 transcript (NM_000534) highlighting the pseudoexon location in red. (b) Minor allele frequency (MAF) of variants 50 bp surrounding the pseudoexon location (red dotted lines). (c) Dose response of PMS1 exon 5–6 after branaplam (teal) or risdiplam (red) treatment with each empty dot representing a biological replicate and the line showing the local polynomial regression.
Figure 7.
Figure 7.
PMS1 pseudoexon inclusion explained the effect on repeat expansion with branaplam, but only partially with risdiplam. (a) Schematic diagrams showing the CRISPR-Cas9 targeting approach for the disruption of pseudoexon (PE) sequences in HTT (left) and PMS1 (right). Yellow indicates pseudoexon sequence upstream of the 5’ splice site targeted by the drug, blue representing the downstream intronic sequence, with the inserted sequence highlighted in purple. (b) PCR analysis over the HTT (top) and PMS1 (bottom) pseudoexon splice junctions with branaplam or risdiplam treatment for the control and pseudoexon edited cell lines. (c) Accurate quantification of PMS1 canonical isoform by ddPCR for the control and PMS1 pseudoexon edited cell lines. The dot color represents a unique cell line. (d, e) The average repeat gain per week after branaplam or risdiplam treatment for the different edited cell lines (dot color), normalized on the average repeat gain in the DMSO for each genotype.

References

    1. MacDonald M. E. et al. A novel gene containing a trinucleotide repeat that is expanded and unstable on Huntington’s disease chromosomes. Cell 72, 971–983 (1993). - PubMed
    1. Mouro Pinto R. et al. Patterns of CAG repeat instability in the central nervous system and periphery in Huntington’s disease and in spinocerebellar ataxia type 1. Human Molecular Genetics 29, 2551–2567 (2020). - PMC - PubMed
    1. Kennedy L. et al. Dramatic tissue-specific mutation length increases are an early molecular event in Huntington disease pathogenesis. Human Molecular Genetics 12, 3359–3367 (2003). - PubMed
    1. Swami M. et al. Somatic expansion of the Huntington’s disease CAG repeat in the brain is associated with an earlier age of disease onset. Human Molecular Genetics 18, 3039–3047 (2009). - PMC - PubMed
    1. Lee J.-M. et al. CAG Repeat Not Polyglutamine Length Determines Timing of Huntington’s Disease Onset. Cell 178, 887–900.e14 (2019). - PMC - PubMed

Publication types