[Preprint]. 2023 Jul 29:2023.04.14.536843.
doi: 10.1101/2023.04.14.536843.

The lncRNA Malat1 Inhibits miR-15/16 to Enhance Cytotoxic T Cell Activation and Memory Cell Formation

Affiliations

The lncRNA Malat1 Inhibits miR-15/16 to Enhance Cytotoxic T Cell Activation and Memory Cell Formation

Benjamin D Wheeler et al. bioRxiv. .

Update in

Abstract

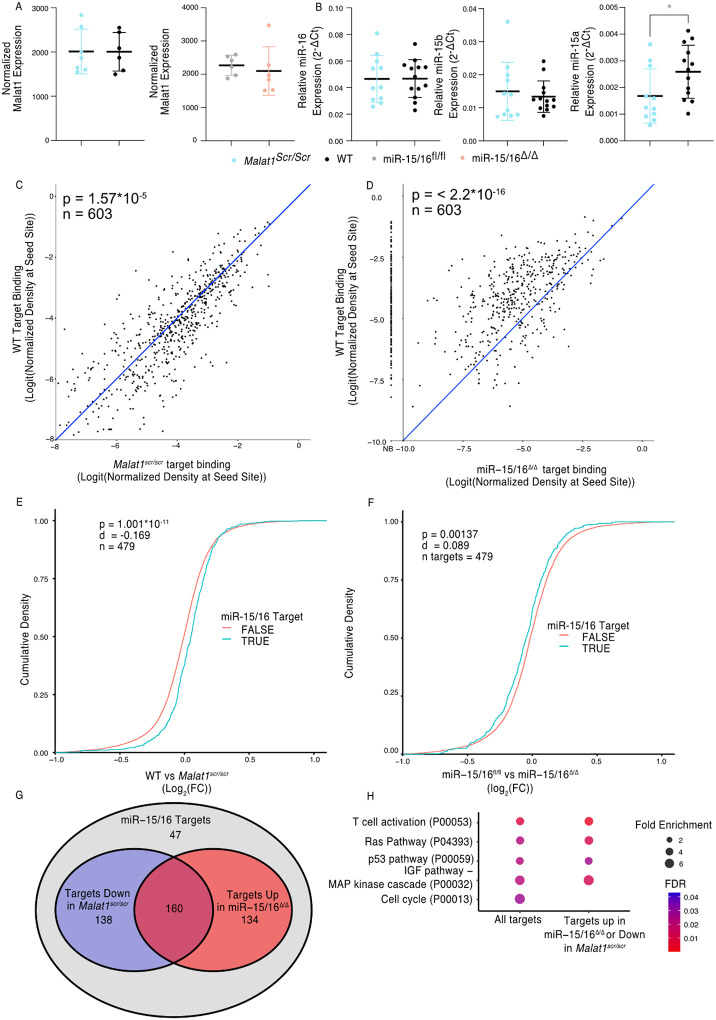
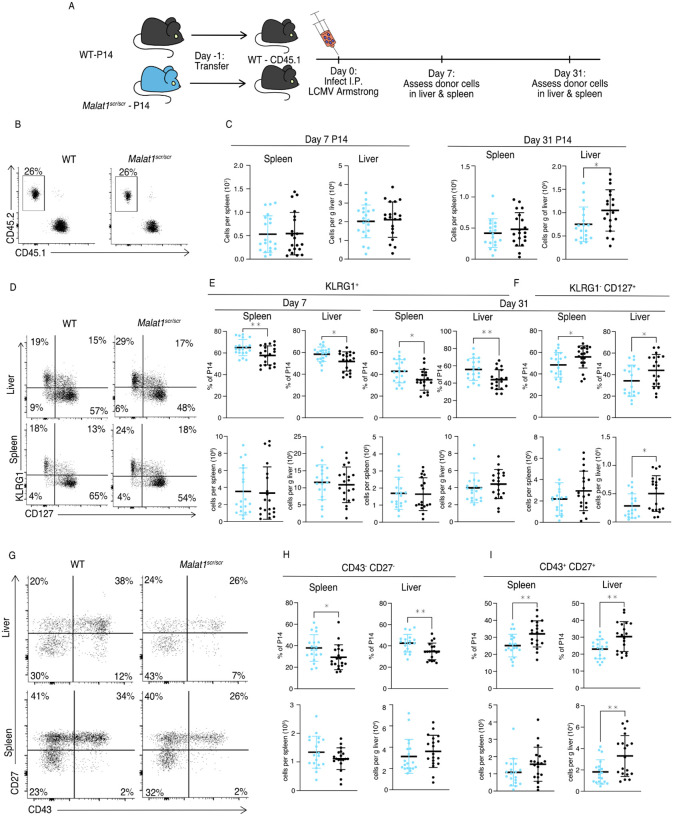
Proper activation of cytotoxic T cells via the T cell receptor and the costimulatory receptor CD28 is essential for adaptive immunity against viruses, many intracellular bacteria and cancers. Through biochemical analysis of RNA:protein interactions, we uncovered a non-coding RNA circuit regulating activation and differentiation of cytotoxic T cells composed of the long non-coding RNA Malat1 (Metastasis Associated Lung Adenocarcinoma Transcript 1) and the microRNA family miR-15/16. miR-15/16 is a widely and highly expressed tumor suppressor miRNA family important for cell proliferation and survival. miR-15/16 also play important roles in T cell responses to viral infection, including the regulation of antigen-specific T cell expansion and T cell memory. Comparative Argonaute-2 high throughput sequencing of crosslinking immunoprecipitation (Ago2 HITS-CLIP, or AHC) combined with gene expression profiling in normal and miR-15/16-deficient T cells revealed a large network of several hundred direct miR-15/16 target mRNAs, many with functional relevance for T cell activation, survival and memory formation. Among these targets, the long non-coding RNA Malat1 contained the largest absolute magnitude miR-15/16-dependent AHC peak in T cells. This binding site was also among the strongest lncRNA:miRNA interactions detected in the T cell transcriptome. We used CRISPR targeting with homology directed repair to generate mice with a 5-nucleotide mutation in the miR-15/16 binding site in Malat1. This mutation interrupted Malat1:miR-15/16 interaction, and enhanced the repression of other miR-15/16 target genes, including CD28. Interrupting Malat1 interaction with miR-15/16 decreased cytotoxic T cell activation, including the expression of IL-2 and a broader CD28-responsive gene program. Accordingly, Malat1 mutation diminished memory cell persistence following LCMV Armstrong and Listeria monocytogenes infection. This study marks a significant advance in the study of long noncoding RNAs in the immune system by ascribing cell-intrinsic, sequence-specific in vivo function to Malat1. These findings have implications for T cell-mediated autoimmune diseases, antiviral and anti-tumor immunity, as well as lung adenocarcinoma and other malignancies where Malat1 is overexpressed.


Conflict of interest statement

A.M. is a cofounder of Arsenal Biosciences, Spotlight Therapeutics, and Survey Genomics, serves on the boards of directors at Spotlight Therapeutics and Survey Genomics, is a board observer (and former member of the board of directors) at Arsenal Biosciences, is a member of the scientific advisory boards of Arsenal Biosciences, Spotlight Therapeutics, Survey Genomics, NewLimit, Amgen and Tenaya, owns stock in Arsenal Biosciences, Spotlight Therapeutics, NewLimit, Survey Genomics, PACT Pharma, and Tenaya and has received fees from Arsenal Biosciences, Spotlight Therapeutics, NewLimit, 23andMe, PACT Pharma, Juno Therapeutics, Trizell, Vertex, Merck, Amgen, Genentech, AlphaSights, Rupert Case Management, Bernstein and ALDA. A.M. is an investor in and informal advisor to Offline Ventures and a client of EPIQ. The Marson laboratory has received research support from Juno Therapeutics, Epinomics, Sanofi, GlaxoSmithKline, Gilead and Anthem. M.H.S. is founder and a board member of Teiko.bio and has received a speaking honorarium from Fluidigm Inc., has served as a consultant for Five Prime, Ono, January, Earli, Astellas, and Indaptus, and has received research funding from Roche/Genentech, Bristol Myers Squibb, Valitor, and Pfizer. J.D.G. is now an employee of Arsenal Biosciences.

Figures

Figure 1.
Figure 1.. Malat1 is highly bound by miR-15/16
CD8+ T cells were isolated from spleens, grown in vitro for 5 days, then Ago2 transcriptomic occupancy was assayed via Ago2 HITS-CLIP. (A-B) Transcriptome wide analysis of Ago2 HITS-CLIP libraries prepared from WT cells (combined libraries n = 2). (A) Summed reads across entire annotations. Line indicates total reads across the Malat1 transcript. Malat1 was #8 most highly bound lncRNA annotation, which was in the top 0.0091% of all lncRNA annotations analyzed with >0 HITS-CLIP reads. (B) Ago2 HITS-CLIP peaks were identified and reads were summed within those called peaks that intersectedwith the given annotation. Peaks were of variable length so summed reads were normalized by peak length. Line indicates HITS-CLIP reads per nucleotide in the called peak containing the miR-15/16 binding site in Malat1. This peak was the #121 most bound HITS-CLIP peak in lncRNA peaks analyzed, which was in the top 2.3% of all evaluated peaks in lncRNAs. (C) Ago2 HITS-CLIP binding to the mouse Malat1 locus reads from combined libraries shown (n = 2 for eachgenotype). Grey bar indicates the peak containing the miR-15/16 binding site. Black bars indicate regions identified as peaks by piranha. Blue bars indicate predicted binding sites of miRNAs expressed in our data set from the miRTarget custom sequence prediction algorithm. Grey bar indicates miR-15/16 binding peak. (D) Local alignment of the human and mouse Malat1 sequences near the miR-15/16 conserved binding site. Highlighting indicates the depth of evolutionary conservation of k-mers as predicted by the lncLOOM algorithm (Ross et al., 2021). (E)Ago2 HITS-CLIP binding to the human MALAT1 locus from publicly available data sets (Karginov and Hannon, 2013; Li et al., 2018). Blue vertical bar indicates the conserved miR-15/16 binding site. (F) Schematic representing the creation of the Malat1scr allele. Bases in red indicate the 5 nucleotides whose sequence was scrambled by CRISPR-Cas9 HDR to prevent miR-15/16 binding.
Figure 2.
Figure 2.. Malat1 Inhibits miR-15/16 binding and suppressive activity
(A) Malat1 expression measure by RNA-seq from CD8+ T cells isolated from spleens and stimulated withɑCD3 and ɑCD28 for 24 hours (WT n = 6, Malat1scr/scr n = 7, miR-15/16fl/fl n = 6, miR-15/16Δ/Δ n = 6; 1 experiment) (B) miR-16, miR-15b, and miR-15a expression measured by miRNA qPCR from CD8+ T cells freshly isolated from spleens. Expression was determined relative to 5.8s ribosomal RNA expression. Unpaired t-test performed to determine significance. (C-D) TargetScan predicted miR-15/16 binding sites that contained at least one HITS-CLIP read in both WT and Malat1scr/scr CD8+ T cells were compared for depth of Ago2 HITS-CLIP reads. First, reads at the predicted seed site were normalized by total Ago2 HITS-CLIP reads in a given 3’ UTR. To best visualize all sites, logit transforms of these values are plotted. Paired t-test performed to determine significance. Blue line indicates the identity line. Data for each genotype is from combined libraries of n = 2 biological replicates. (C) Comparison of WT and Malat1scr/scr cells (D) Comparison of WT and miR-15/16Δ/Δ. Values to the left of the y-axis labeled with NB indicate there was no bind detected at that site in the miR-15/16Δ/Δ cells. (E-F) Cumulative density plots to determine changes in expression of miR-15/16 targets. Targets determined by TargetScan predicted miR-15/16 mRNA targets that had at least one 3’ UTR site with reads in both WT and Malat1scr/scr CD8+ T cells. Kolmogorov-Smirnov test used to determine significant differences in the distributions of target and non-target genes. (E) comparison of the Log2(FC) between WT and Malat1scr/scr samples stimulated with ɑCD3 and ɑCD28 for 24 hours (F) comparison of the Log2(FC) between miR-15/16fl/fl and miR-15/16Δ/Δ samples stimulated with ɑCD3 and ɑCD28 for 24 hours. (G) Venn diagram of miR-15/16 target expression regulated in concordance with the Malat1-miR-15/16 circuit.The blue circle indicates genes with WT vs Malat1scr/scr log2(FC) > 0 and the red circle indicates genes with miR-15/16fl/fl vs miR-15/16Δ/Δ log2(FC) < 0. The purple overlap indicates genes that meet both conditions and the grey indicates genes that do not meet either condition. (H) Gene ontology analysis of the bound target set used above as well as genes regulated in accordance withthe Malat1-miR-15/16 circuit (WT vs Malat1scr/scr log2(FC) > 0 or miR-15/16fl/fl vs miR-15/16Δ/Δ log2(FC) < 0). Enrichment determined within the Panther Pathway annotations. (*, p<0.05)
Figure 3.
Figure 3.. The Malat1-miR-15/16 Circuit Increase CD28 Expression and Co-stimulation induced Gene Expression
(A) Ago2 HITS-CLIP binding at the Cd28 locus. Sequencing libraries generated from CD8+ T cells isolated from spleens and cultured for 5 days (combined libraries from n = 2 for each genotype). Grey bar indicates the peak containing the TargetScan predicted miR-15/16 binding site. (B) Schematic illustrating the assay scheme to assay acute gene expression downstream of CD28 co-stimulation (C) Representative flow cytometry plots of CD28 expression on naive (CD62L+ CD44) CD8+ T cells from spleens of unchallenged mice. Mean fluorescence intensity for the sample reported in the upper right of the plot. (D) Quantification of CD28 mean fluorescence intensity normalized to the relevant control. (Malat1scr/scr compared to WT from 3 independent experiments; miR-15/16fl/fl compared to miR-15/16Δ/Δ from 2 independent experiments) (E-H) Cumulative density plots comparing expression of CD28 responsive gene set defined as genes from (Martínez-Llordella et al., 2013) with ɑCD3ɑCD28 vs ɑCD3 log2(FC) > 1.5 and adjusted p value < 0.001. Kolmogorov-Smirnov test used to determine significant differences in the distributions of target and non-target genes. ɑCD3 used at 1 μg/mL, and ɑ CD28 used at 1 μg/mL. (E) Comparison of CD28 responsive genes in WT vs Malat1scr/scr cells stimulated with ɑCD3 alone (F) Comparison of CD28 responsive genes in WT vs Malat1scr/scr cells stimulated with ɑCD3 and ɑCD28 (G) Comparison of CD28 responsive genes in miR-15/16fl/fl vs miR-15/16Δ/Δ cells stimulated with ɑCD3 alone (H) Comparison of CD28 responsive genes in miR-15/16fl/fl vs miR-15/16Δ/Δ cells stimulated with ɑCD3 and ɑCD28 (I-J) Heatmaps of CD28 responsive gene set expression by genotype and stimulation condition. Dendrograms represent unbiased hierarchical clustering of the samples. (I) Malat1scr/scr and WT samples compared with ɑCD3 ± ɑCD28 (J) miR-15/16fl/fl vs miR-15/16Δ/Δ samples compared with ɑCD3 ± ɑCD28 (*, p<0.05; **, p<0.01; ***, p<0.001; ****, p<0.0001)
Figure 4.
Figure 4.. The Malat1-MiR-15/16 circuit increases functional outcomes of CD28 co-stimulation
(A-C) CD8+ T cells were isolated from spleens and stimulated with ɑCD3 and ɑCD28 antibodies, results displayed are gated on activated cells (CD69+ Nur77+) (A) Representative histograms of CD69 and Nur77 expression 4 hours after stimulation (B) Quantification of CD69 mean fluorescence intensity 2 and 4 hours after stimulation. Both time points reflectstatistically significant changes (p < 0.01) by ordinary one-way ANOVA; statistics displayed on graph represent results of post-hoc multiple comparisons of Malat1scr/scr to WT and miR-15/16Δ/Δ to WT. Data from 2 independent experiments, each normalized to WT average value. (C) Quantification of Nur77 mean fluorescence intensity 2 and 4 hours after stimulation. No significant changesdetermined by ordinary one-way ANOVA. Data from 2 independent experiments, each normalized to WT average value. (D-F) Quantification of cytokine secretion into the supernatant by CD8+ T cells isolated from spleens, stimulated ɑCD3 ± ɑCD28, and cultured 16 hours. Cell free supernatant protein concentration measured by ELISA. Data from a single experiment (D) Quantification of IL-2 secretion. By 2-way ANOVA, in both experiments there was a significant (p < 0.0001) increase in IL-2 with the addition of ɑCD28 stimulation. But the only significant (p = 0.0001) genotypic effect was increased IL-2 secretion in miR-15/16Δ/Δ vs mir-15/16fl/fl. Comparisons shown on plot are the results of post-hoc multiple comparison tests. (E) Quantification of TNFɑ secretion. By 2-way ANOVA, in both experiments there was a significant (p < 0.0001) increase in IL-2 with the addition of ɑCD28 stimulation. But the only significant (p = 0.003) genotypic effect was increased IL-2 secretion in miR-15/16Δ/Δ vs mir-15/16fl/fl. Comparisons shown on plot are the results of post-hoc multiple comparison tests. (F) Quantification of IFNɣ secretion. By 2-way ANOVA, in both experiments there was a significant (p < 0.0001) increase in IL-2 with the addition of ɑCD28 stimulation. But no genotypic effect was observed. (*, p<0.05; **, p<0.01; ***, p<0.001; ****, p<0.0001)
Figure 5.
Figure 5.. Malat1 enhances memory T cell persistence following LCMV infection
Malat1scr/scr and WT cells containing the GP33 specific TCR transgene (P14) on the CD45.2 background were transferred separately into congenic CD45.1 WT hosts. One day later the recipient mice were infected with 5*105 p.f.u. I.p. lcmv armstrong. LCMV specific responses were assayed by monitoring the transferred cells by flow cytometry in the blood, spleen, and liver over time (data from two independent experiments per time point) (A) Schematic of experimental design (B) Representative flow plots to identify and quantify transferred cells (C) Quantification of transferred P14 cell numbers at day 7 and day 31 (D) Representative flow plots of KLRG1 and CD127 expression on P14 cells at day 31 post infection (E) Quantification of P14 KLRG1+ cells by percent of P14 and total numbers in spleen and liver at day 7 and day 31 post infection (F) Quantification of P14 KLRG1 CD127+ by percent of P14 and total numbers in spleen and liver at day 31 post infection (G) Representative flow plots of CD43 and CD27 expression on P14 cells at day 31 post infection (H) Quantification of P14 CD43 CD27 t-Tem cells by percent of P14 and total numbers in spleen and liver at day 31 post infection (I) Quantification of P14 CD43+ CD27+ memory cells by percent of P14 and total numbers in spleen and liver at day 31 post infection Statistics displayed determined by unpaired t-test between Malat1scr/scr and WT transferred cells (*, p<0.05; **, p<0.01)
Figure 6.
Figure 6.. Malat1 and miR-15/16 alter memory T cell differentiation following Listeria Monocytogenes infection
miR-15/16fl/fl and miR-15/16Δ/Δ with a polyclonal TCR repertoire were directly infected with 2*104 colony forming units (c.f.u.) r.o. Listeria monocytogenes-gp33 (LM-GP33). LM-GP33 specific responses were then assayed in the spleen 31 days post infection (miR-15/16Δ/Δ n = 5 and miR-15/16fl/fl n = 6 from a single experiment). (A) schematic of experimental design (B) Quantification of tetramer specific CD8 T cells in the spleen (C-F) Quantification of tetramer specific subpopulations by percent of GP33+ and numbers for (C) CD127 KLRG1, (D) CD127+ KLRG1, (E) CD27 CD43, and (F) CD27+ CD43+ populations Malat1scr/scr and WT cells containing the GP33 specific TCR transgene (P14) on the CD45.2 background were transferred separately into congenic CD45.1 WT hosts. One day later the recipient mice were infected with 2*104 c.f.u. r.o. LM-GP33. LM-GP33 specific responses were assayed by monitoring the transferred cells by flow cytometry in the spleen and liver at discrete time points (data from a single experiment per time point). (G) Schematic of experimental design (H) Quantification of transferred P14 cell numbers at day 7 and day 31 (I-K) Quantification of P14 (I) CD127 KLRG1+, (J) CD43 CD27, and (K) CD43+ CD27+ cells by percent of P14 and total numbers in spleen and liver at day 7 (L) Representative flow plots of KLRG1 and CD127 expression on P14 cells at day 31 post infection (M) Representative flow plots of CD43 and CD27 expression on P14 cells at day 31 post infection (N-Q) Quantification of P14 (N) KLRG1+, (O) CD127+ KLRG1, (P) CD43 CD27, and (Q) CD43+ CD27+ cells by percent of P14 and total numbers in spleen and liver at day 31 post infection Statistics displayed determined by unpaired t-test between Malat1scr/scr and WT transferred cells (*, p<0.05; **, p<0.01; ***, p<0.001)
Figure 7.
Figure 7.. Malat1 Enhances Pro-survival Cues Downstream of T cell activation
Malat1scr/scr and WT cells containing the GP33 specific TCR transgene (P14) on the CD45.2 background were transferred separately into congenic CD45.1 WT hosts. One day later the recipient mice were infected with 2*105 p.f.u. I.p. lcmv armstrong or 2*104 c.f.u. r.o. LM-GP33. Antigen specific responses were assayed by monitoring the transferred cells by flow cytometry in the spleen. (A-C) Bcl2 expression in transferred P14 cells in the spleen 7 and 31 days post infection for both LCMV and LM-GP33. Data from two independent experiments per LCMV time point and a single experiment per LM-GP33 time point. (A) Representative flow cytometry plots of P14 KLRG1+ CD127 cell Bcl2 expression 7 days post infection. Numbers shown are mean fluorescence intensity. (B) Representative flow cytometry plots of P14 CD43 CD27 cell Bcl2 expression 31 days post infection. Numbers shown are mean fluorescence intensity. (C) Quantification of Bcl2 expression producing cells by mean fluorescence intensity within the indicated P14 subpopulation defined by KLRG1 or CD27 and CD43. (D-E) Analysis of dead cells within splenic P14 CD43 and CD27 subpopulations at days 7 and 31 post LM-GP33 infection, data from a single experiment per time point. (D) Representative flow cytometry plots of P14 subsets defined by CD43 and CD27. Numbers shownrepresent percent of dead cells per the parent subpopulation (E) Quantification of dead cells as a percentage of parent P14 subpopulation (F-G) Analysis of IL-2 producing P14 subsets in the spleen via IL-2 capture assay at days 7 and 31 post infection for both LCMV and LM-GP33, data from a single experiment per infection per time point. (F) Representative flow cytometry plots of all P14 cells stained for KLRG1 and captured IL-2 from both infections at day 7. Numbers represent percent of cells in that quadrant of all P14 transferred cells. (G) Quantification of IL-2 producing cells by percent of parent within the indicated P14 subpopulation defined by KLRG1 or CD27 and CD43. Statistics displayed determined by unpaired t-test between Malat1scr/scr and WT transferred cells, where multiple tests were performed the Holm–Šidák method was used to correct for multiple comparisons (*, p<0.05; **, p<0.01)

References

    1. Allen BM, Hiam KJ, Burnett CE, Venida A, DeBarge R, Tenvooren I, Marquez DM, Cho NW, Carmi Y, Spitzer MH. 2020. Systemic dysfunction and plasticity of the immune macroenvironment in cancer models. Nat Med 26:1125–1134. - PMC - PubMed
    1. Arun G, Aggarwal D, Spector DL. 2020. MALAT1 Long Non-Coding RNA: Functional Implications. Noncoding RNA 6. doi: 10.3390/ncrna6020022 - DOI - PMC - PubMed
    1. Ashouri JF, Weiss A. 2017. Endogenous Nur77 Is a Specific Indicator of Antigen Receptor Signaling in Human T and B Cells. J Immunol 198:657–668. - PMC - PubMed
    1. Bachmann MF, Barner M, Viola A, Kopf M. 1999. Distinct kinetics of cytokine production and cytolysis in effector and memory T cells after viral infection. Eur J Immunol 29:291–299. - PubMed
    1. Badovinac VP, Porter BB, Harty JT. 2002. Programmed contraction of CD8(+) T cells after infection. Nat Immunol 3:619–626. - PubMed

Publication types