. 2023 May 10;8(7):769-780.
doi: 10.1016/j.jacbts.2023.01.004. eCollection 2023 Jul.

Transvalvular Unloading Mitigates Ventricular Injury Due to Venoarterial Extracorporeal Membrane Oxygenation in Acute Myocardial Infarction

Affiliations

Transvalvular Unloading Mitigates Ventricular Injury Due to Venoarterial Extracorporeal Membrane Oxygenation in Acute Myocardial Infarction

Kay D Everett et al. JACC Basic Transl Sci. .

Abstract

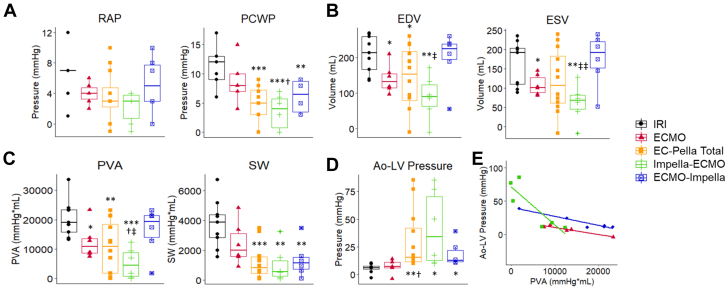
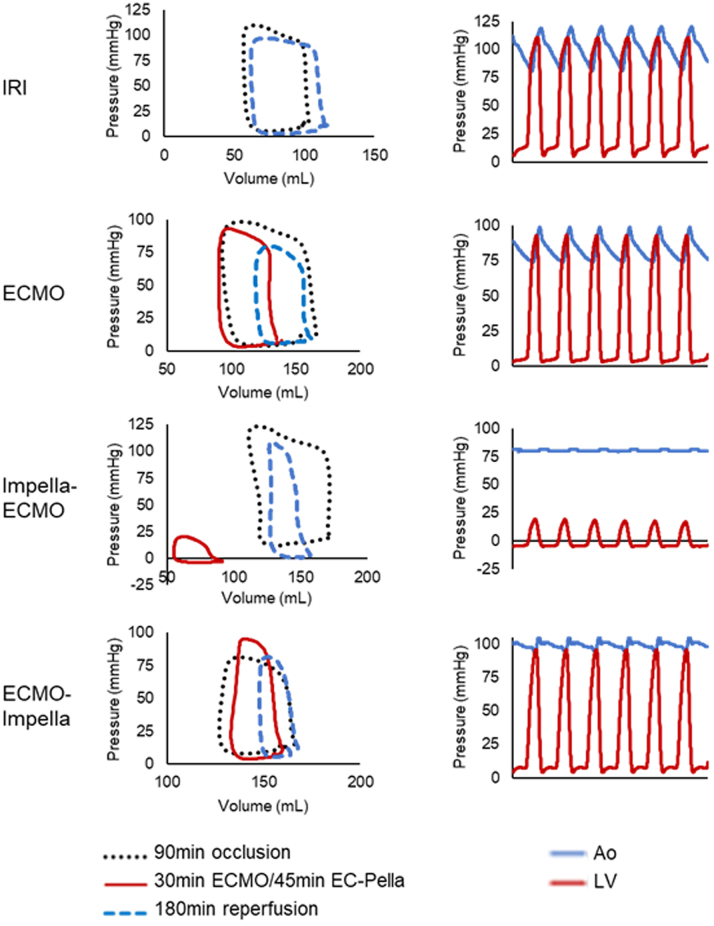
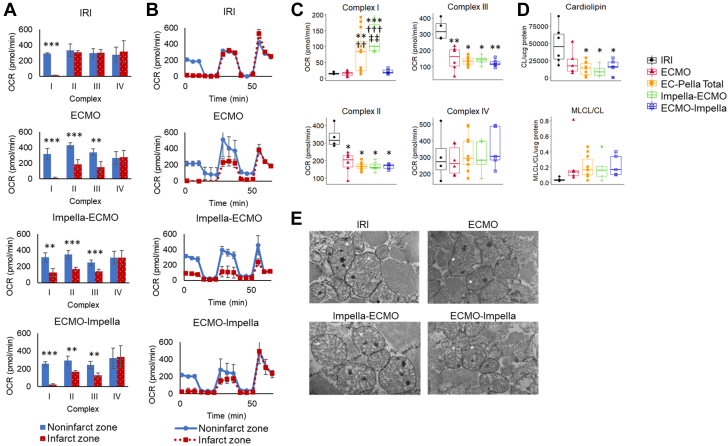
Whether extracorporeal membrane oxygenation (ECMO) with Impella, known as EC-Pella, limits cardiac damage in acute myocardial infarction remains unknown. The authors now report that the combination of transvalvular unloading and ECMO (EC-Pella) initiated before reperfusion reduced infarct size compared with ECMO alone before reperfusion in a preclinical model of acute myocardial infarction. EC-Pella also reduced left ventricular pressure-volume area when transvalvular unloading was applied before, not after, activation of ECMO. The authors further observed that EC-Pella increased cardioprotective signaling but failed to rescue mitochondrial dysfunction compared with ECMO alone. These findings suggest that ECMO can increase infarct size in acute myocardial infarction and that EC-Pella can mitigate this effect but also suggest that left ventricular unloading and myocardial salvage may be uncoupled in the presence of ECMO in acute myocardial infarction. These observations implicate mechanisms beyond hemodynamic load as part of the injury cascade associated with ECMO in acute myocardial infarction.

Keywords: cardioprotection; hemodynamic status; mechanical circulatory support; unloading.


Conflict of interest statement

This work was supported by National Institutes of Health grants R01HL159089-01 and R01HL139785-01. Dr Kapur has received consulting and speaker honoraria and institutional grant support from Abbott Laboratories, Abiomed, Boston Scientific, Edwards Lifesciences, LivaNova, Getinge, and Zoll. All other authors have reported that they have no relationships relevant to the contents of this paper to disclose.

Figures

None
Graphical abstract
Figure 1
Figure 1
Study Protocol and Myocardial Infarct Size Among Groups Schematic of mechanical circulatory support application in situ (A), study timeline (B), infarct size (C), and relationship to pressure-volume area (PVA) (D) among groups. Values are individual data points or mean ± SD. ∗∗P < 0.01 vs ischemia-reperfusion injury (IRI), †P < 0.05 vs extracorporeal membrane oxygenation (ECMO), ††P < 0.01 vs ECMO, and §§P < 0.01 for infarct size (IS)/area at risk (AAR) vs ECMO and P < 0.05 for PVA vs IRI. EC-Pella = extracorporeal membrane oxygenation plus Impella; LAD = left anterior descending coronary artery; LV = left ventricle; RV = right ventricle.
Figure 2
Figure 2
Hemodynamic Indexes Among Groups Prior to Reperfusion Key metrics demonstrating RV and LV filling pressures (A), LV volumes (B), LV work (C), ventriculoarterial coupling (D), and linear regression of PVA to aortic (Ao)–LV pressure (E) among groups. Values are individual data points. ∗P < 0.05 vs IRI, ∗∗P < 0.01 vs IRI, ∗∗∗P < 0.001 vs IRI, †P < 0.05 vs ECMO, ‡P < 0.05 vs ECMO-Impella, and ‡‡P < 0.01 vs ECMO-Impella. For the regression, r = −1.06E-3 (P = 0.009), r = −1.35E-3 (P = 0.002), and r = −5.68E-3 (P = 0.026) for ECMO, ECMO-Impella, and Impella-ECMO, respectively; regression coefficients: β = −0.0011, β = −0.0014, and β = −0.0057 for ECMO, ECMO-Impella, and Impella-ECMO, respectively (P for interaction = 0.0002). EDV = end-diastolic volume; ESV = end-systolic volume; PCWP = pulmonary capillary wedge pressure; RAP = right atrial pressure; SW = stroke work; other abbreviations as in Figure 1.
Figure 3
Figure 3
Representative Hemodynamic Tracings Changes in LV pressure-volume loops (left) and the association with simultaneous Ao-LV pressure-time data (right). Pressure-volume loops are shown at 90 minutes of occlusion (black, dashed), after mechanical circulatory support (MCS) activation (30 minutes ECMO, 45 minutes EC-Pella), prior to reperfusion (red, solid), and 180 minutes of reperfusion (blue, hashed). The right panels show pressure-time tracings for aorta (Ao) (blue) and LV (red) prior to reperfusion. After MCS activation and prior to reperfusion, ECMO decreased LV volumes. With Impella-ECMO, a phenomenon of maximal PVA reduction was observed, at which time simultaneous Ao-LV pressure-time recordings demonstrated maximal venoarterial uncoupling. Values are simultaneous recordings at noted time points. Abbreviations as in Figure 1.
Figure 4
Figure 4
Cardioprotective Signaling Western blots (A) and quantification (B) for cardioprotective and apoptotic signaling, terminal deoxynucleotidyl transferase deoxyuridine triphosphate nick-end labeling (TUNEL) and 4′,6-diamidino-2-phenylindole (DAPI) staining (C), representative images (E), and relation to PVA (D) among groups. Values are individual data points or mean ± SD. ∗P < 0.05 vs IRI, ∗∗P < 0.01 vs IRI, ∗∗∗P < 0.001 vs IRI, †P < 0.05 vs ECMO, ††P < 0.01 vs ECMO, †††P < 0.001 vs ECMO, and ‡P < 0.05 vs ECMO-Impella. Bcl = B-cell lymphoma; Bcl-XL = Bcl extra-large; GSK3b = glycogen synthase kinase 3; other abbreviations as in Figure 1.
Figure 5
Figure 5
Mitochondrial Function and Integrity (A) Quantification of individual complex activity in the noninfarct (blue) and infarct (red, dotted) zones. (B) Representative Seahorse plots. (C) Comparison of complex activity. (D) Cardiolipin (CL) and monolysocardiolipin (MLCL) levels in mitochondria isolated from the infarct zone. (E) Electron microscopy demonstrating mitochondrial structure (asterisks). Values are individual data points or mean ± SD. In A, ∗P < 0.05, ∗∗P < 0.01, and ∗∗∗P < 0.001. In C and D, ∗P < 0.05 vs IRI, ∗∗P < 0.01 vs IRI, ∗∗∗P < 0.001 vs IRI, ††P < 0.01 vs ECMO, †††P < 0.001 vs ECMO, and ‡‡P < 0.01 vs ECMO-Impella. OCR = oxygen consumption rate; other abbreviations as in Figure 1.

References

    1. Vallabhajosyula S., Prasad A., Bell M.R., et al. Extracorporeal membrane oxygenation use in acute myocardial infarction in the United States, 2000 to 2014. Circ Heart Fail. 2019;12:1–9. - PMC - PubMed
    1. Schrage B., Becher P.M., Goßling A., et al. Temporal trends in incidence, causes, use of mechanical circulatory support and mortality in cardiogenic shock. ESC Heart Fail. 2021;8:1295–1303. - PMC - PubMed
    1. Rao P., Khalpey Z., Smith R., Burkhoff D., Kociol R.D. Venoarterial extracorporeal membrane oxygenation for cardiogenic shock and cardiac arrest. Circ Heart Fail. 2018;11(9) doi: 10.1161/CIRCHEARTFAILURE.118.004905. - DOI - PubMed
    1. Fried J.A., Griffin J.M., Masoumi A., et al. Predictors of survival and ventricular recovery following acute myocardial infarction requiring extracorporeal membrane oxygenation therapy. ASAIO J. 2022;68(6):800–807. - PubMed
    1. Sheu J.J., Tsai T.H., Lee F.Y., et al. Early extracorporeal membrane oxygenator-assisted primary percutaneous coronary intervention improved 30-day clinical outcomes in patients with ST-segment elevation myocardial infarction complicated with profound cardiogenic shock. Crit Care Med. 2010;38(9):1810–1817. - PubMed

LinkOut - more resources