[Preprint]. 2023 Jul 27:arXiv:2307.14907v1.

Weakly Supervised AI for Efficient Analysis of 3D Pathology Samples

Affiliations

Weakly Supervised AI for Efficient Analysis of 3D Pathology Samples

Andrew H Song et al. ArXiv. .

Update in

  • Analysis of 3D pathology samples using weakly supervised AI.
    Song AH, Williams M, Williamson DFK, Chow SSL, Jaume G, Gao G, Zhang A, Chen B, Baras AS, Serafin R, Colling R, Downes MR, Farré X, Humphrey P, Verrill C, True LD, Parwani AV, Liu JTC, Mahmood F. Song AH, et al. Cell. 2024 May 9;187(10):2502-2520.e17. doi: 10.1016/j.cell.2024.03.035. Cell. 2024. PMID: 38729110 Free PMC article.

Abstract

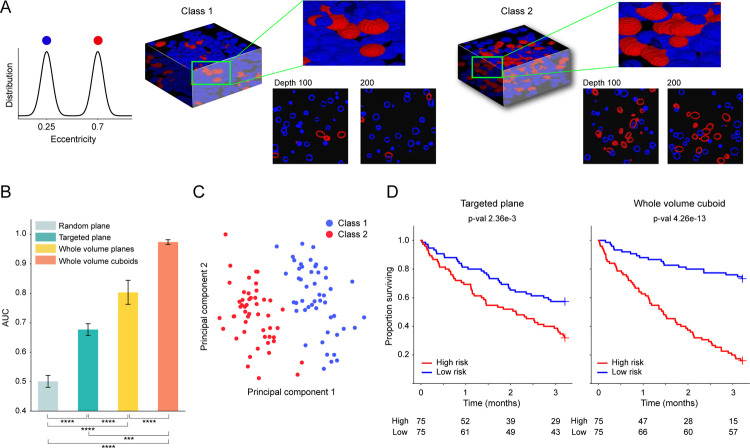
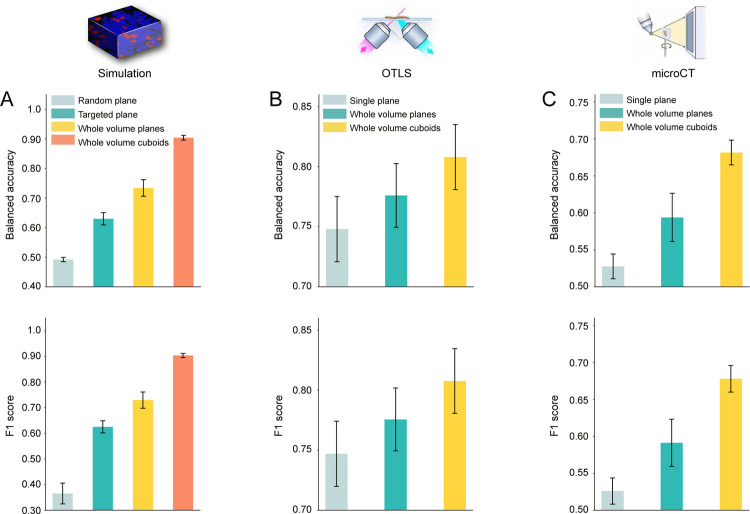
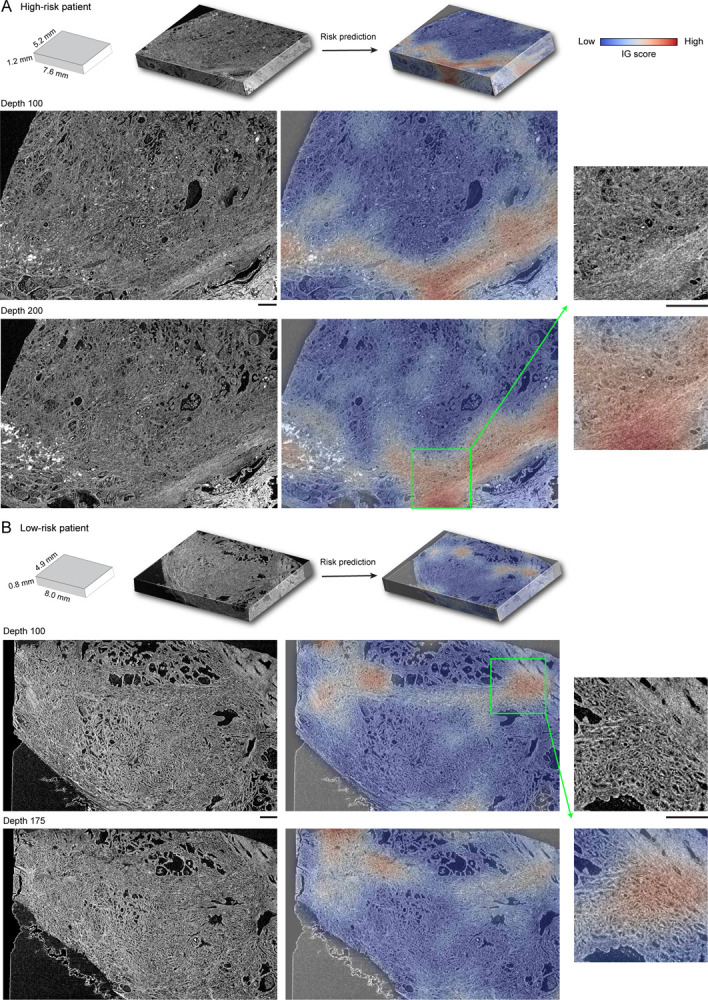
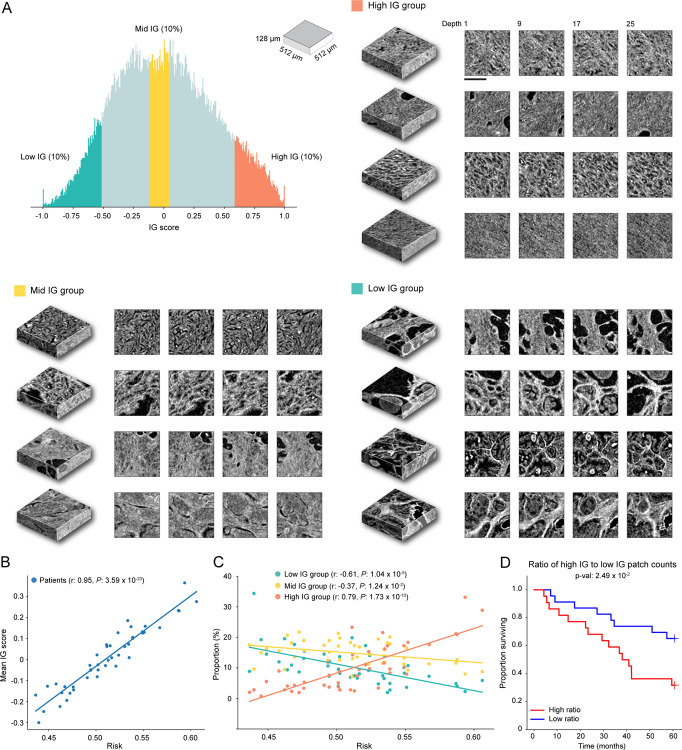
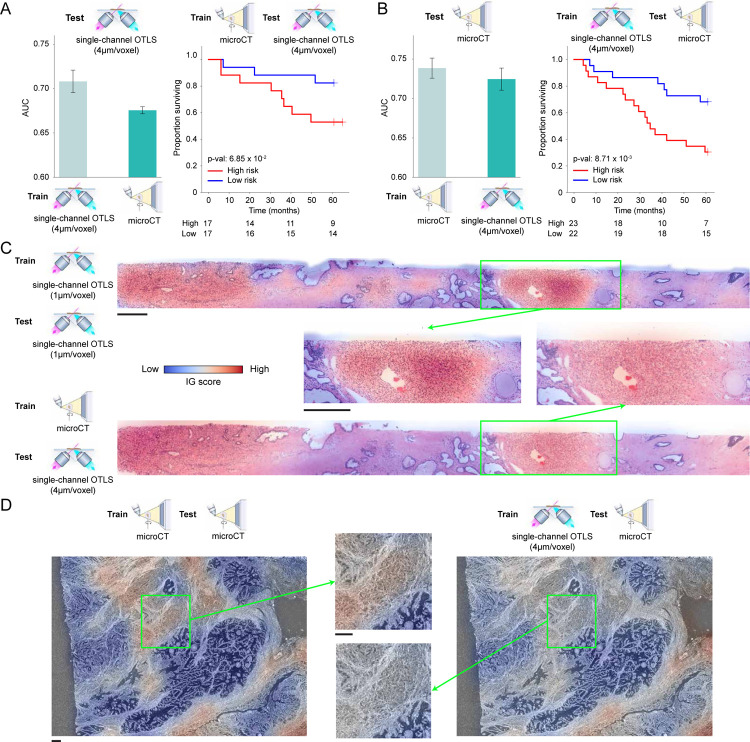
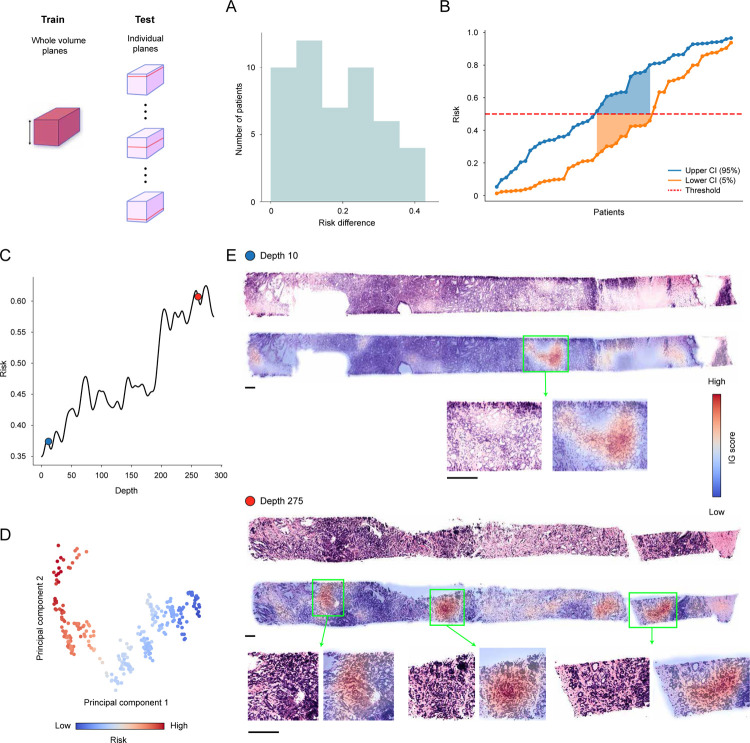
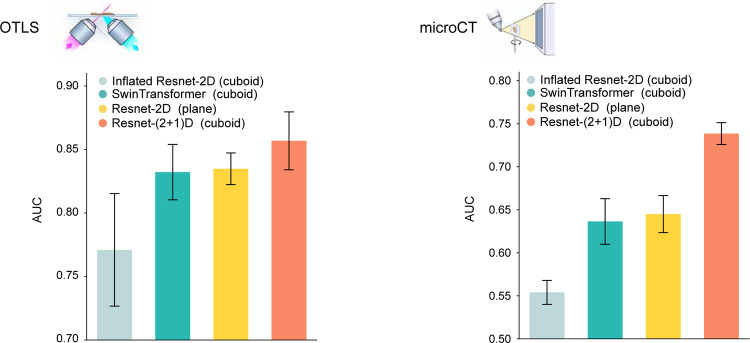
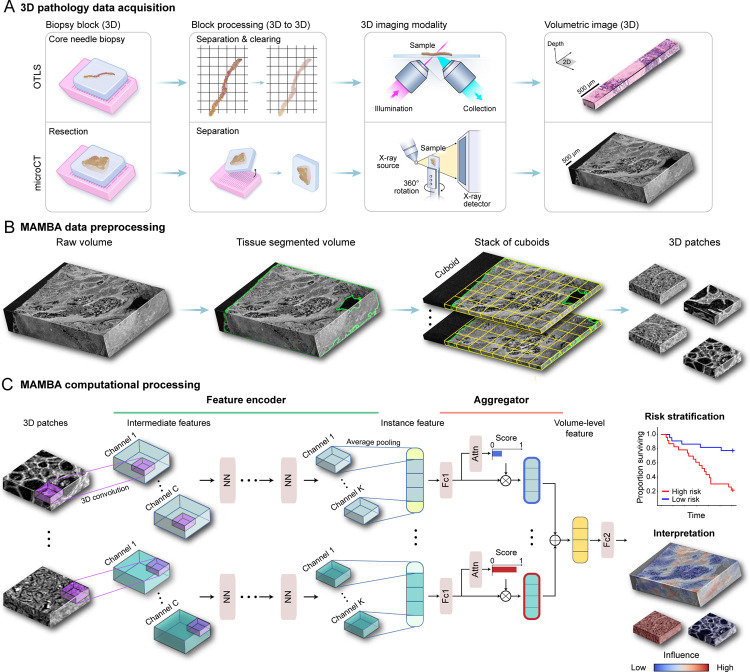
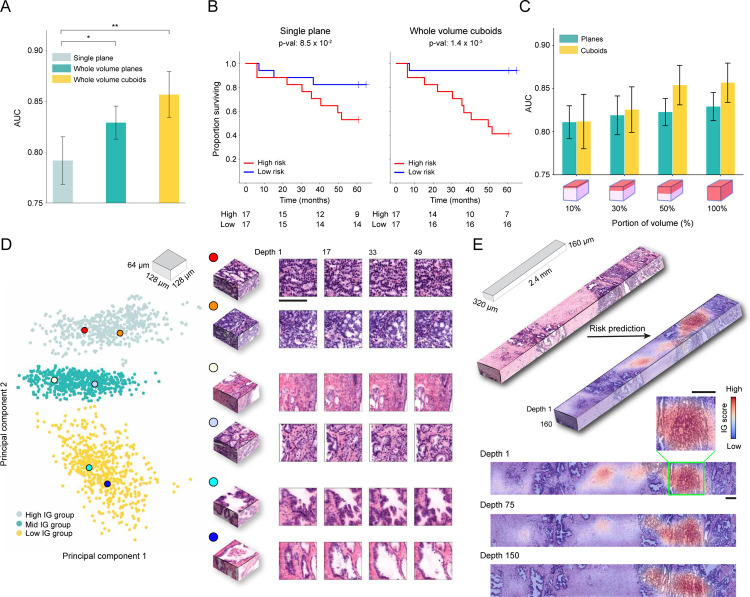
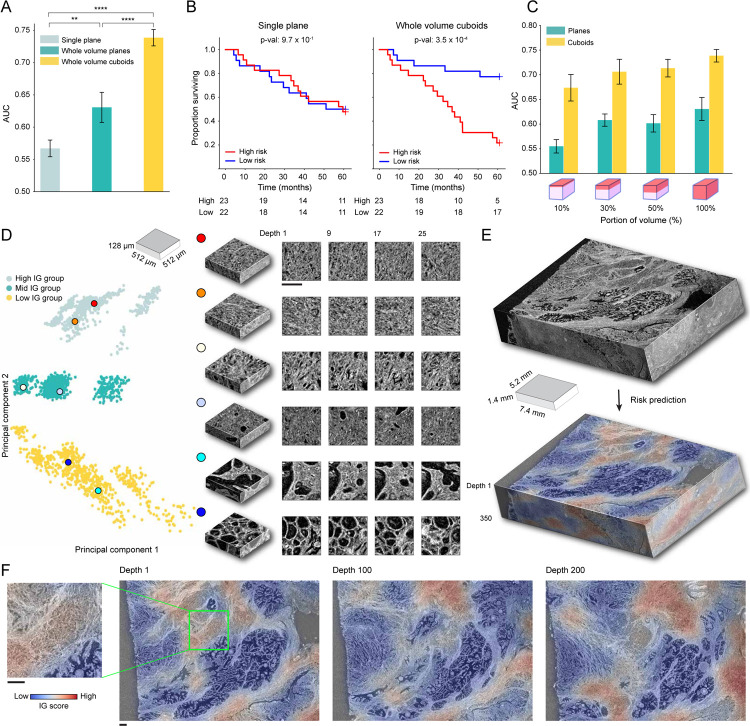
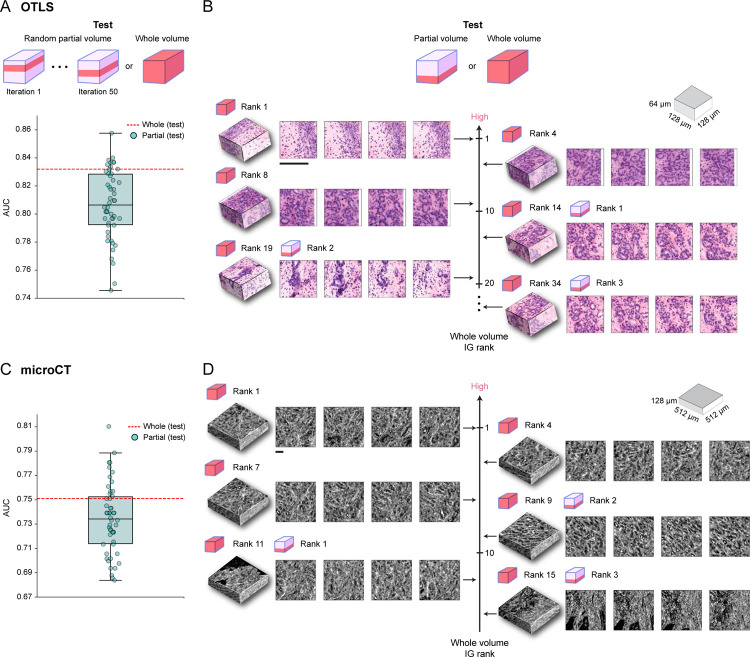
Human tissue consists of complex structures that display a diversity of morphologies, forming a tissue microenvironment that is, by nature, three-dimensional (3D). However, the current standard-of-care involves slicing 3D tissue specimens into two-dimensional (2D) sections and selecting a few for microscopic evaluation1,2, with concomitant risks of sampling bias and misdiagnosis3-6. To this end, there have been intense efforts to capture 3D tissue morphology and transition to 3D pathology, with the development of multiple high-resolution 3D imaging modalities7-18. However, these tools have had little translation to clinical practice as manual evaluation of such large data by pathologists is impractical and there is a lack of computational platforms that can efficiently process the 3D images and provide patient-level clinical insights. Here we present Modality-Agnostic Multiple instance learning for volumetric Block Analysis (MAMBA), a deep-learning-based platform for processing 3D tissue images from diverse imaging modalities and predicting patient outcomes. Archived prostate cancer specimens were imaged with open-top light-sheet microscopy12-14 or microcomputed tomography15,16 and the resulting 3D datasets were used to train risk-stratification networks based on 5-year biochemical recurrence outcomes via MAMBA. With the 3D block-based approach, MAMBA achieves an area under the receiver operating characteristic curve (AUC) of 0.86 and 0.74, superior to 2D traditional single-slice-based prognostication (AUC of 0.79 and 0.57), suggesting superior prognostication with 3D morphological features. Further analyses reveal that the incorporation of greater tissue volume improves prognostic performance and mitigates risk prediction variability from sampling bias, suggesting that there is value in capturing larger extents of spatially heterogeneous 3D morphology. With the rapid growth and adoption of 3D spatial biology and pathology techniques by researchers and clinicians, MAMBA provides a general and efficient framework for 3D weakly supervised learning for clinical decision support and can help to reveal novel 3D morphological biomarkers for prognosis and therapeutic response.


Conflict of interest statement

Competing Interests J.T.C.L. is a co-founder and board member of Alpenglow Biosciences, Inc., which has licensed the OTLS microscopy portfolio developed in his lab at the University of Washington.

Figures

Extended Data Figure 1:
Extended Data Figure 1:. 3D phantom datasets and analysis with MAMBA
(A) Examples of single-channel 3D phantom data samples for the binary classification task (n = 100), false-colored for different cell types. Samples from the first class are dominated by normal cells (blue), while samples from the second class are dominated by abnormal cells with large eccentricity (red). (B) Binary classification task AUC for MAMBA trained and tested on a random plane from each volume (random plane), the targeted plane that contains both cell types (targeted plane) from each volume, all planes, and cuboids within the whole volume (whole volume planes and cuboids). ***P ≤ 0.001 and ****P ≤ 0.0001. (C) Principal component feature space plot for the sample-level attention-aggregated volume features for whole volume cuboid approach, with the colors indicating ground truth labels. (D) Kaplan-Meier survival analysis stratified at 50 percentile by MAMBA-predicted risk on survival prediction phantom dataset (n = 150) for 2D targeted single plane and whole volume cuboids approaches. Further details of the simulation dataset are described in the Methods.
Extended Data Figure 2:
Extended Data Figure 2:. Additional metrics for high & low-risk patient classification task
Balanced accuracy and F1 score for high & low-risk patient classification task for (A) simulation (B) OTLS (C) microCT dataset. In all three datasets and metrics, we observe that the 3D treatment of the whole volume as cuboids and 3D patching is superior to the 2D plane-based alternatives.
Extended Data Figure 3:
Extended Data Figure 3:. Examples of integrated gradient (IG) heatmaps for open-top light-sheet microscopy (OTLS) cohort
The integrated gradient scores are assigned to each patch with high IG (low IG) patches indicating that patch contributes to an unfavorable (favorable) prognosis. The IG heatmaps are restricted to the inside of the segmented tissue contour. (A) High IG areas in the high-risk sample contain cancerous glands that resemble poorly differentiated tumor glands (Gleason patterns 4). (B) In the low-risk sample, the high IG areas are those with cancerous glands that are smaller, more tortuous, and more closely resemble Gleason pattern 4, as well as regions with a cellular stroma. All scale bars are 200μm. The heatmaps can also be visualized in our interactive demo.
Extended Data Figure 4:
Extended Data Figure 4:. Integrated gradient analysis for open-top light-sheet microscopy (OTLS) dataset
(A) Patches from the high IG cluster exhibit infiltrative carcinoma that resembles predominantly poorly-differentiated glands (Gleason pattern 4), exhibiting cribriform architecture. Patches from the middle IG cluster exhibit infiltrative carcinoma that resembles mixtures of Gleason patterns 3 and 4. Patches from the low IG cluster predominantly exhibit large, benign glands, with occasional corpora amylacaea. (B) Scatter plot of the normalized IG patch scores averaged within each sample as a function of predicted risk (the predicted probability for the high-risk group). (C) The scatter plot of the proportion of the number of high, middle, and low IG group patches in each sample as a function of predicted risk, which shows that a sample with a higher predicted risk profile has a larger (smaller) fraction of high (low) IG patches. (D) Kaplan-Meier curve for the cohort stratified (50%) by the ratio of the number of patches in the high and low IG group. The good stratification performance suggests that the extent to which prognostic morphologies manifest in each sample is also important. The scale bar is 100μm.
Extended Data Figure 5:
Extended Data Figure 5:. Integrated gradient (IG) heatmaps for the microcomputed tomography (microCT) cohort
The integrated gradient scores are assigned to each patch with high IG (low IG) patch indicating that patch contributes to unfavorable (favorable) prognosis. (A) In this high-risk sample, high IG values are localized in areas with the smallest and densest cancerous glands, especially when they are in or adjacent to the capsule of the prostate, as well as dense stroma that resembles the prostate capsule. (B) Similar to the high-risk case, high IG regions in this low-risk sample correspond to areas with small, dense cancerous glands and dense stroma. The juxtaposition of these two morphologies has particularly high IG values. All scale bars are 500μm. The heatmaps can also be visualized in our interactive demo.
Extended Data Figure 6:
Extended Data Figure 6:. Integrated gradient analysis for microcomputed tomography (microCT) dataset
(A) The high IG cluster consists of patches with infiltrative carcinoma that most closely resembles Gleason pattern 4; however, the lower resolution and lack of H&E staining make definitive grading effectively impossible by visual inspection of the microCT images alone. In the middle IG cluster, most patches contain infiltrating carcinoma that resembles Gleason patterns 3 and 4. The low IG cluster consists almost mostly of patches containing benign prostatic tissue with occasional foci of infiltrative carcinoma that resembles Gleason pattern 3. (B) Scatter plot of the normalized IG patch scores averaged within each sample as a function of predicted risk (the predicted probability for the high-risk group). (C) The scatter plot of the proportion of the number of high, middle, and low IG group patches in each sample as a function of predicted risk, which shows that the sample with higher predicted risk has a larger (smaller) fraction of high (low) IG patches. (D) Kaplan-Meier curve for the cohort stratified (50%) by the ratio of the number of patches in the high and low IG group. The good stratification performance suggests that the extent to which prognostic morphologies manifest in each sample are also important. The scale bar is 250μm.
Extended Data Figure 7:
Extended Data Figure 7:. Cross-modal evaluation between open-top light-sheet microscopy (OTLS) and microcomputed tomography (microCT) datasets.
We perform a cross-modal experiment by training a network with the whole block cuboid setting on one cohort and testing on the other to assess whether the network learns generalizable prostate cancer prognostic morphologies. To match the 4μm/voxel resolution and single-channel characteristics of the microCT dataset, the OTLS dataset is downsampled by a factor of 4, and only the nuclear channel is retained. (A) Test AUC for the OTLS cohort with MAMBA trained on OTLS or microCT cohorts, and the cross-modal Kaplan-Meier curve for cohort stratification of high and low-risk groups. (B) Identical analyses to (A), but tested on microCT with MAMBA trained on microCT or OTLS cohorts. The drop in test AUC for both experiments can be attributed to significantly different imaging protocols between the two datasets. (C-D) Integrated gradient (IG) heatmaps for cross-modal experiments. Despite the difference in train and test modalities, MAMBA identifies poorly-differentiated glands (C) and infiltrative carcinoma (D) as unfavorable prognostic morphologies, concurring with IG heatmaps from the original same-modality setting. These results suggest that despite the challenging nature of the cross-modal adaptation, MAMBA identifies important prognostic morphologies robust to different image pipelines. All scale bars are 250μm.
Extended Data Figure 8:
Extended Data Figure 8:. Plane variability analysis for open-top light-sheet microscopy (OTLS) dataset
We use residual CNN (ResNet50) feature encoder to train MAMBA on all planes of whole volume and predict risk (the probability for the high-risk group) on individual planes. (A) Given the plane-level predicted risks for each sample, the difference between lower 5% and upper 95% value is computed (risk difference). The histogram shows that the difference is non-negligible for some patients, indicating heterogeneity within the tissue. (B) An arbitrary risk decision threshold (e.g., 0.5) falls within the 90% risk interval for several patients, for whom the risk group can change depending on the plane chosen for prognosis. (C) Plane-level predicted risk, which fluctuates from low-risk to high-risk, as a function of depth within the volume for a patient. (D) Principal component feature space for attention-aggregated plane-level features for the sample. The separation into two clusters along the risk group reflects the risk variation observed in (C). (E) Morphological analysis of the low-risk (depth 10) and high-risk plane (depth 275) agrees with the prediction, with the higher-risk plane containing a larger proliferation of tumor resembling Gleason pattern 4 morphology than the lower-risk plane.
Extended Data Figure 9:
Extended Data Figure 9:. Comparsion between different feature encoders
We perform ablation studies on different feature encoders for OTLS and microCT datasets. MAMBA relies on transfer learning to extract representative and compressed features from 2D patches and 3D patches. MAMBA provides access to a diverse range of feature encoders for users to choose from. The results demonstrate that different feature encoders utilizing the whole volume lead to varying performance levels, with the spatiotemporal CNN (i.e., ResNet-(2+1)D) used for our study, performing the best for both OTLS and microCT datasets.
Figure 1:
Figure 1:. MAMBA computational workflow
(A) With 3D imaging modalities such as open-top light-sheet microscopy (OTLS) and microcomputed tomography (microCT), high-resolution volumetric images of tissue specimens are captured. (B) MAMBA accepts raw volumetric tissue images from diverse imaging modalities as inputs. MAMBA first segments the volumetric image to separate tissue from the background. In a common version of the workflow, the segmented volume is then treated as a stack of cuboids (3D planes) and further tessellated into smaller 3D patches. (C) The patches (i.e., instances) are then processed with a pretrained feature encoder network of choice, leveraging transfer learning to produce a set of compact and representative features. The encoded features are further compressed with a domain-adapted shallow, fully-connected network. Next, an aggregator module aggregates the set of instance features, automatically weighing them according to the importance towards rendering the prediction to form a volume-level feature. MAMBA also provides saliency heatmaps for clinical interpretation and validation. The computational workflow of MAMBA with 2D processing is identical. Further details of the model architecture are described in the Methods. NN, generic neural network layers dependent on the choice of feature encoder; Channel C, K, intermediate channels in feature encoder; Attn, attention module; Fc1, Fc2, fully-connected layers.
Figure 2:
Figure 2:. MAMBA analysis of open-top light-sheet microscopy (OTLS) prostate cancer cohort.
The OTLS cohort contains volumetric tissue images (1μm/voxel resolution) of simulated core needle biopsies extracted from prostatectomy specimens. (A) Cohort-level AUC for MAMBA trained and tested on the top plane from each volume (single plane), all planes and cuboids within the whole volume (whole volume planes and whole volume cuboids, respectively), repeated over five different experiments. Results for balanced accuracy and F1-score metrics can be found in Extended Data Figure 2B. Statistical significance was assessed with an unpaired t-test. *P ≤ 0.05 and **P ≤ 0.01. (B) Kaplan-Meier survival analysis for patients with BCR timestamps available, stratified at 50 percentile based on MAMBA-predicted risk, for single plane and whole volume cuboids approaches. The log-rank test was used. (C) Ablation analysis with training and testing on increasing portions from the top of each volume. (D) Principal component feature space plot for 3D patches with high (unfavorable outcome), middle (no influence), and low (favorable outcome) 10% integrated gradient (IG) scores aggregated across the entire cohort. Representative 3D patches and 2D slices within the patch are displayed for each cluster. (E) 3D IG heatmap with representative 2D planes displaying unfavorable (red) and favorable (blue) prognostic regions. Additional examples of IG heatmaps can be found in Extended Data Figure 3. All scale bars are 100μm.
Figure 3:
Figure 3:. MAMBA analysis of microcomputed tomography (microCT) prostate cancer cohort.
The microCT cohort contains volumetric tissue images of prostatectomy tissue from prostate cancer patients with 4μm/voxel resolution. (A) Cohort-level AUC for MAMBA trained and tested on the top plane from each volume (single plane), all planes and cuboids within the whole volume (whole volume planes and whole volume cuboids, respectively), repeated over five different experiments. Results for balanced accuracy and F1-score metrics can be found in Extended Data Figure 2C. Statistical significance was assessed with unpaired t-test. **P ≤ 0.01 and ****P ≤ 0.0001. (B) Kaplan-Meier survival analysis, stratified at 50 percentile based on MAMBA-predicted risk, for single plane and whole volume cuboids approaches. The log-rank test was used. (C) Ablation analysis with training and testing on increasing portions from the top of each volume. (D) Principal component feature space plot for 3D patches with high (unfavorable outcome), middle (no influence), and low (favorable outcome) 10% integrated gradient (IG) scores aggregated across the entire cohort. Representative 3D patches and 2D slices within the cuboid are displayed for each cluster. (E, F) 3D IG heatmap with representative 2D planes displaying unfavorable (red) and favorable (blue) prognostic regions. Additional heatmap examples can be found in Extended Data Figure 5. All scale bars are 250μm.
Figure 4:
Figure 4:. Comparison between whole-volume and partial-volume analysis
Given the predictive model trained on whole volume cuboids, the cohort-level AUC is computed for the whole volume (whole volume) or over 50 iterations with 15% of the tissue volume randomly sampled each time (partial volume). (A) OTLS cohort AUC spread for the partial volume analysis (teal) and AUC for the whole volume analysis (red). The AUC spread is considerable and indicative of significant performance variability induced by heterogeneity within the tissue volume. (B) IG score ranking for 3D patches when tested on the whole volume and partial volume of a given OTLS sample, where a higher ranking corresponds to a larger integrated gradient (IG) score. The top IG score patches from the partial volume analysis are not the top contributors for increasing the risk when other patches from the whole tissue volume are accounted for. This suggests that partial volumes can miss prognostic regions. (C-D) The same analyses for the microCT cohort with similar findings to the OTLS analyses. All scale bars are 100μm.

References

    1. Farahani N., Parwani A. V., Pantanowitz L. et al. Whole slide imaging in pathology: advantages, limitations, and emerging perspectives. Pathol Lab Med Int 7, 4321 (2015).
    1. Liu J. T. et al. Harnessing non-destructive 3D pathology. Nature biomedical engineering 5, 203–218 (2021). - PMC - PubMed
    1. King C. R. & Long J. P. Prostate biopsy grading errors: a sampling problem? International journal of cancer 90, 326–330 (2000). - PubMed
    1. Mehra K. K. et al. The impact of tissue block sampling on the detection of p53 signatures in fallopian tubes from women with BRCA 1 or 2 mutations (BRCA+) and controls. Modern Pathology 24, 152–156 (2011). - PubMed
    1. Olson S. M., Hussaini M. & Lewis J. S. Frozen section analysis of margins for head and neck tumor resections: reduction of sampling errors with a third histologic level. Modern Pathology 24, 665–670 (2011). - PubMed

Publication types

LinkOut - more resources