. 2023 Jul 21;31(5):655-666.
doi: 10.32604/or.2023.030248. eCollection 2023.

Identification of microbial metabolites that accelerate the ubiquitin-dependent degradation of c-Myc

Affiliations

Identification of microbial metabolites that accelerate the ubiquitin-dependent degradation of c-Myc

Ziyu Liu et al. Oncol Res. .

Abstract

Myc belongs to a family of proto-oncogenes that encode transcription factors. The overexpression of c-Myc causes many types of cancers. Recently, we established a system for screening c-Myc inhibitors and identified antimycin A by screening the RIKEN NPDepo chemical library. The specific mechanism of promoting tumor cell metastasis by high c-Myc expression remains to be explained. In this study, we screened approximately 5,600 microbial extracts using this system and identified a broth prepared from Streptomyces sp. RK19-A0402 strongly inhibits c-Myc transcriptional activity. After purification of the hit broth, we identified compounds closely related to the aglycone of cytovaricin and had a structure similar to that of oligomycin A. Similar to oligomycin A, the hit compounds inhibited mitochondrial complex V. The mitochondria dysfunction caused by the compounds induced the production of reactive oxygen species (ROS), and the ROS activated GSK3α/β that phosphorylated c-Myc for ubiquitination. This study provides a successful screening strategy for identifying natural products as potential c-Myc inhibitors as potential anticancer agents.

Keywords: High-throughput screening; Phosphorylation; Reactive oxygen species.


Conflict of interest statement

The authors declare that they have no conflicts of interest to report regarding the present study.

Figures

Figure 1
Figure 1. Structures of SS49 (A), cytovaricin (B), and oligomycin A (C). Molecular formulae with molecular weights (MWs) of each compound are shown. The position of C-34 of SS49 is shown in (A).
Figure 2
Figure 2. Analyses of the mechanism of action of c-Myc inhibitors, compounds 1 and 2. (A) c-Myc-specific transcriptional inhibition by hit compounds 1 and 2. E-H1 and D-D1 cells were fixed for 24 h after adding 100 ng/mL doxycycline (DOX) and 1 or 2. The relative values (% of control [DOX+, dimethyl sulfoxide (DMSO)]) as mean are shown. Results were obtained from two independent experiments. The red dots indicate individual measurements. (B) Dose-dependent effects of hit compounds 1 and 2 on c-Myc levels in E-H1 cells. E-H1 cells were harvested and lysed after treatment with 100 ng/mL DOX and compounds 1 or 2 for 24 h, and c-Myc levels were analyzed by immunoblotting. Coomassie brilliant blue (CBB) staining was used as the loading control. Protein levels were quantified using ImageJ software and are shown as the percentage of cells treated with DMSO. Results were obtained from two independent experiments. (C) c-Myc degradation by hit compounds 1 and 2 was analyzed using cycloheximide (CHX) chase. E-H1 cells were treated with 50 ng/mL compounds 1 or 2 with 40 μg/mL CHX 8 h after 100 ng/mL DOX addition, then harvested at 0 and 20 min. c-Myc levels were analyzed by immunoblotting. CBB staining was used as the loading control. Protein levels were quantified using ImageJ and are shown as the percentage of cells treated with DMSO at 0 h (8 h). The figure is representative of two independent experiments. (D) The ubiquitination of c-Myc by hit compounds 1 and 2 increased in E-H1 cells dose-dependently. Cells were harvested and lysed after treatment with DOX (100 ng/mL), compounds 1 and 2, and MG-132 (6 μM) for 6 h. c-Myc proteins in each sample were harvested from 300 μg of lysate using anti-c-Myc antibody-conjugated beads, and their ubiquitination was analyzed by immunoblotting.
Figure 3
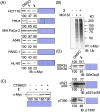
Figure 3. Degradation mechanism of endogenous c-Myc protein by compounds 1 and 2 in cancer cells. (A) c-Myc levels of c-Myc protein after hit compounds 1 and 2 treatment in different cancer cells. Cells were harvested and lysed after treatment with compounds 1 or 2 (50 ng/mL) for 24 h and analyzed by immunoblotting. Coomassie brilliant blue (CBB) staining was used as the loading control. Quantification of c-Myc levels was performed using ImageJ software and is shown as the percentage of cells treated with DMSO alone. (B) Increased ubiquitination of c-Myc by compound 2 in HCT116 cells. Cells were harvested and lysed after treatment with compound 2 (50 ng/mL), with or without MG-132 (6 μM), for 6 h. c-Myc proteins in each sample were harvested from 300 μg lysates using anti-c-Myc antibody-conjugated beads, and their ubiquitination was analyzed by immunoblotting. Representative results from two independent experiments are shown. (C) c-Myc protein reduction by compound 2 was recovered by CT99021 (10 μM) in HCT116 cells. HCT116 cells were treated with or without CT99021 and/or compound 2 (50 ng/mL) for 24 h, harvested, and lysed, and c-Myc levels were analyzed by immunoblotting. CBB staining was used as the loading control. Protein levels were quantified using ImageJ and are shown as the percentage of cells without antimycin A or the compounds. Representative results from two independent experiments are shown. (D) Effect of compound 2 on the levels of GSK3α/β and their phosphorylation in HCT116 cells. Cells were harvested and lysed after treatment with compound 2 (50 ng/mL) for 24 h. GSK3α/β levels and their phosphorylation levels (pS21/9 of GSK3α/β and pT390 of GSK3β) were analyzed by immunoblotting. CBB staining was used as the loading control. Protein levels were quantified using ImageJ and are shown as a percentage of cells treated with DMSO alone. Representative results from two independent experiments are shown.
Figure 4
Figure 4. Compound 2 abrogates the mitochondrial function of HCT116 cells by inhibiting the mitochondrial complex V. (A) Percentage changes in oxygen consumption rate (OCR) and extracellular acidification rate (ECAR) (relative to their respective baseline values) induced by compound 2, oligomycin A (OMA), and antimycin A (AMA) at the concentrations indicated. Each data point represents the mean ± SD (n = 3) at 1.5 h after treatment. A representative experiment from two independent experiments is shown. (B) After the measurement of OCR and ECAR as in (A), the Mito Stress Test was performed, in which OCR values were measured after the addition of oligomycin A (OMA; 1 μM), carbonyl cyanide 4-(trifluoromethoxy)-phenylhydrazone (FCCP; 0.125 μM) and rotenone/antimycin A (R/A; 1 μM each) in a stepwise manner. Data on compound 2 at 1.4, 4.1, or 14 nM treated cells (upper panel) and that of OMA (3 nM)- or AMA (3 nM)-treated cells (lower panel) together with their DMSO control are shown. Each data point represents the mean ± SD (n = 3). A representative experiment from two independent experiments is shown.
Figure 5
Figure 5. Reactive oxygen species (ROS) produced by compound 2 inhibits cell growth. (A) The structure of idebenone. (B) Reduced c-Myc protein levels and pS9/pT390 of GSK3α/β levels by compound 2 were canceled by idebenone in HCT116 cells. Idebenone was added at the indicated concentrations to compound 2 (50 ng/mL) for 24 h, and the cells were harvested and lysed. The c-Myc protein levels, GSK3α/β levels, and their phosphorylation (pS21/9 and pT390) were analyzed by immunoblotting, quantitated by ImageJ, and shown as the percentage of that of control (DMSO) cells. Coomassie brilliant blue (CBB) staining was used as the loading control. (C) HCT116 cells were treated with compound 2 at the indicated concentration with (closed circle; +Ide) or without (open circle) idebenone (3 μM), cultured for 1 h, fixed, and the mitochondrial ROS levels were measured using the INCA. Results are shown as the mean ± SD (n = 3), and a representative result of two independent experiments is shown. (D) HCT116 cells were treated with compound 2 at the indicated concentrations with (closed circle; +Ide) or without (open circle) idebenone (3 μM), cultured for 24 h, fixed, and cell growth was measured by counting the number of nuclei after Hoechst staining. Results are shown as the mean ± SD (n = 3), and a representative result of two independent experiments is shown. ANOVA test, *p < 0.05, **p < 0.01, ***p < 0.001.
Figure 6
Figure 6. Compound 2 promotes c-Myc protein degradation and inhibits cell growth. Compound 2 caused mitochondrial damage, which inhibited cell growth in HCT116 cells. The damaged mitochondria produce reactive oxygen species (ROS) to activate GSK3α through decreased phosphorylation at S21, and GSK3β through decreased phosphorylation at S9 and T390, which lead to increased phosphorylation at T58 of c-Myc to induce degradation.

References

    1. Meyer, N., Penn, L. Z. (2008). Reflecting on 25 years with MYC. Nature Reviews Cancer , 8(12), 976–990. 10.1038/nrc2231; - DOI - PubMed
    1. Grandori, C., Cowley, S. M., James, L. P., Eisenman, R. N. (2000). The Myc/Max/Mad network and the transcriptional control of cell behavior. Annual Review of Cell and Developmental Biology , 16, 653–699. 10.1146/annurev.cellbio.16.1.653; - DOI - PubMed
    1. Patel, J. H., Loboda, A. P., Showe, M. K., Showe, L. C., McMahon, S. B. (2004). Analysis of genomic targets reveals complex functions of MYC. Nature Reviews Cancer , 4(7), 562–568. 10.1038/nrc1393; - DOI - PubMed
    1. Dang, C. V., O’Donnell, K. A., Zeller, K. I., Nguyen, T., Osthus, R. C.et al. (2006). The c-Myc target gene network. Seminars in Cancer Biology , 16(4), 253–264. 10.1016/j.semcancer.2006.07.014; - DOI - PubMed
    1. Graf, T., Beug, H. (1978). Avian leukemia viruses: Interaction with their target cells in vivo and in vitro. Biochimica et Biophysica Acta (BBA)-Reviews on Cancer , 516(3), 269–299. 10.1016/0304-419X(78)90011-2; - DOI - PubMed

LinkOut - more resources