. 2023 Oct 30;42(24):4333-4348.
doi: 10.1002/sim.9864. Epub 2023 Aug 7.

Rank intraclass correlation for clustered data

Affiliations

Rank intraclass correlation for clustered data

Shengxin Tu et al. Stat Med. .

Abstract

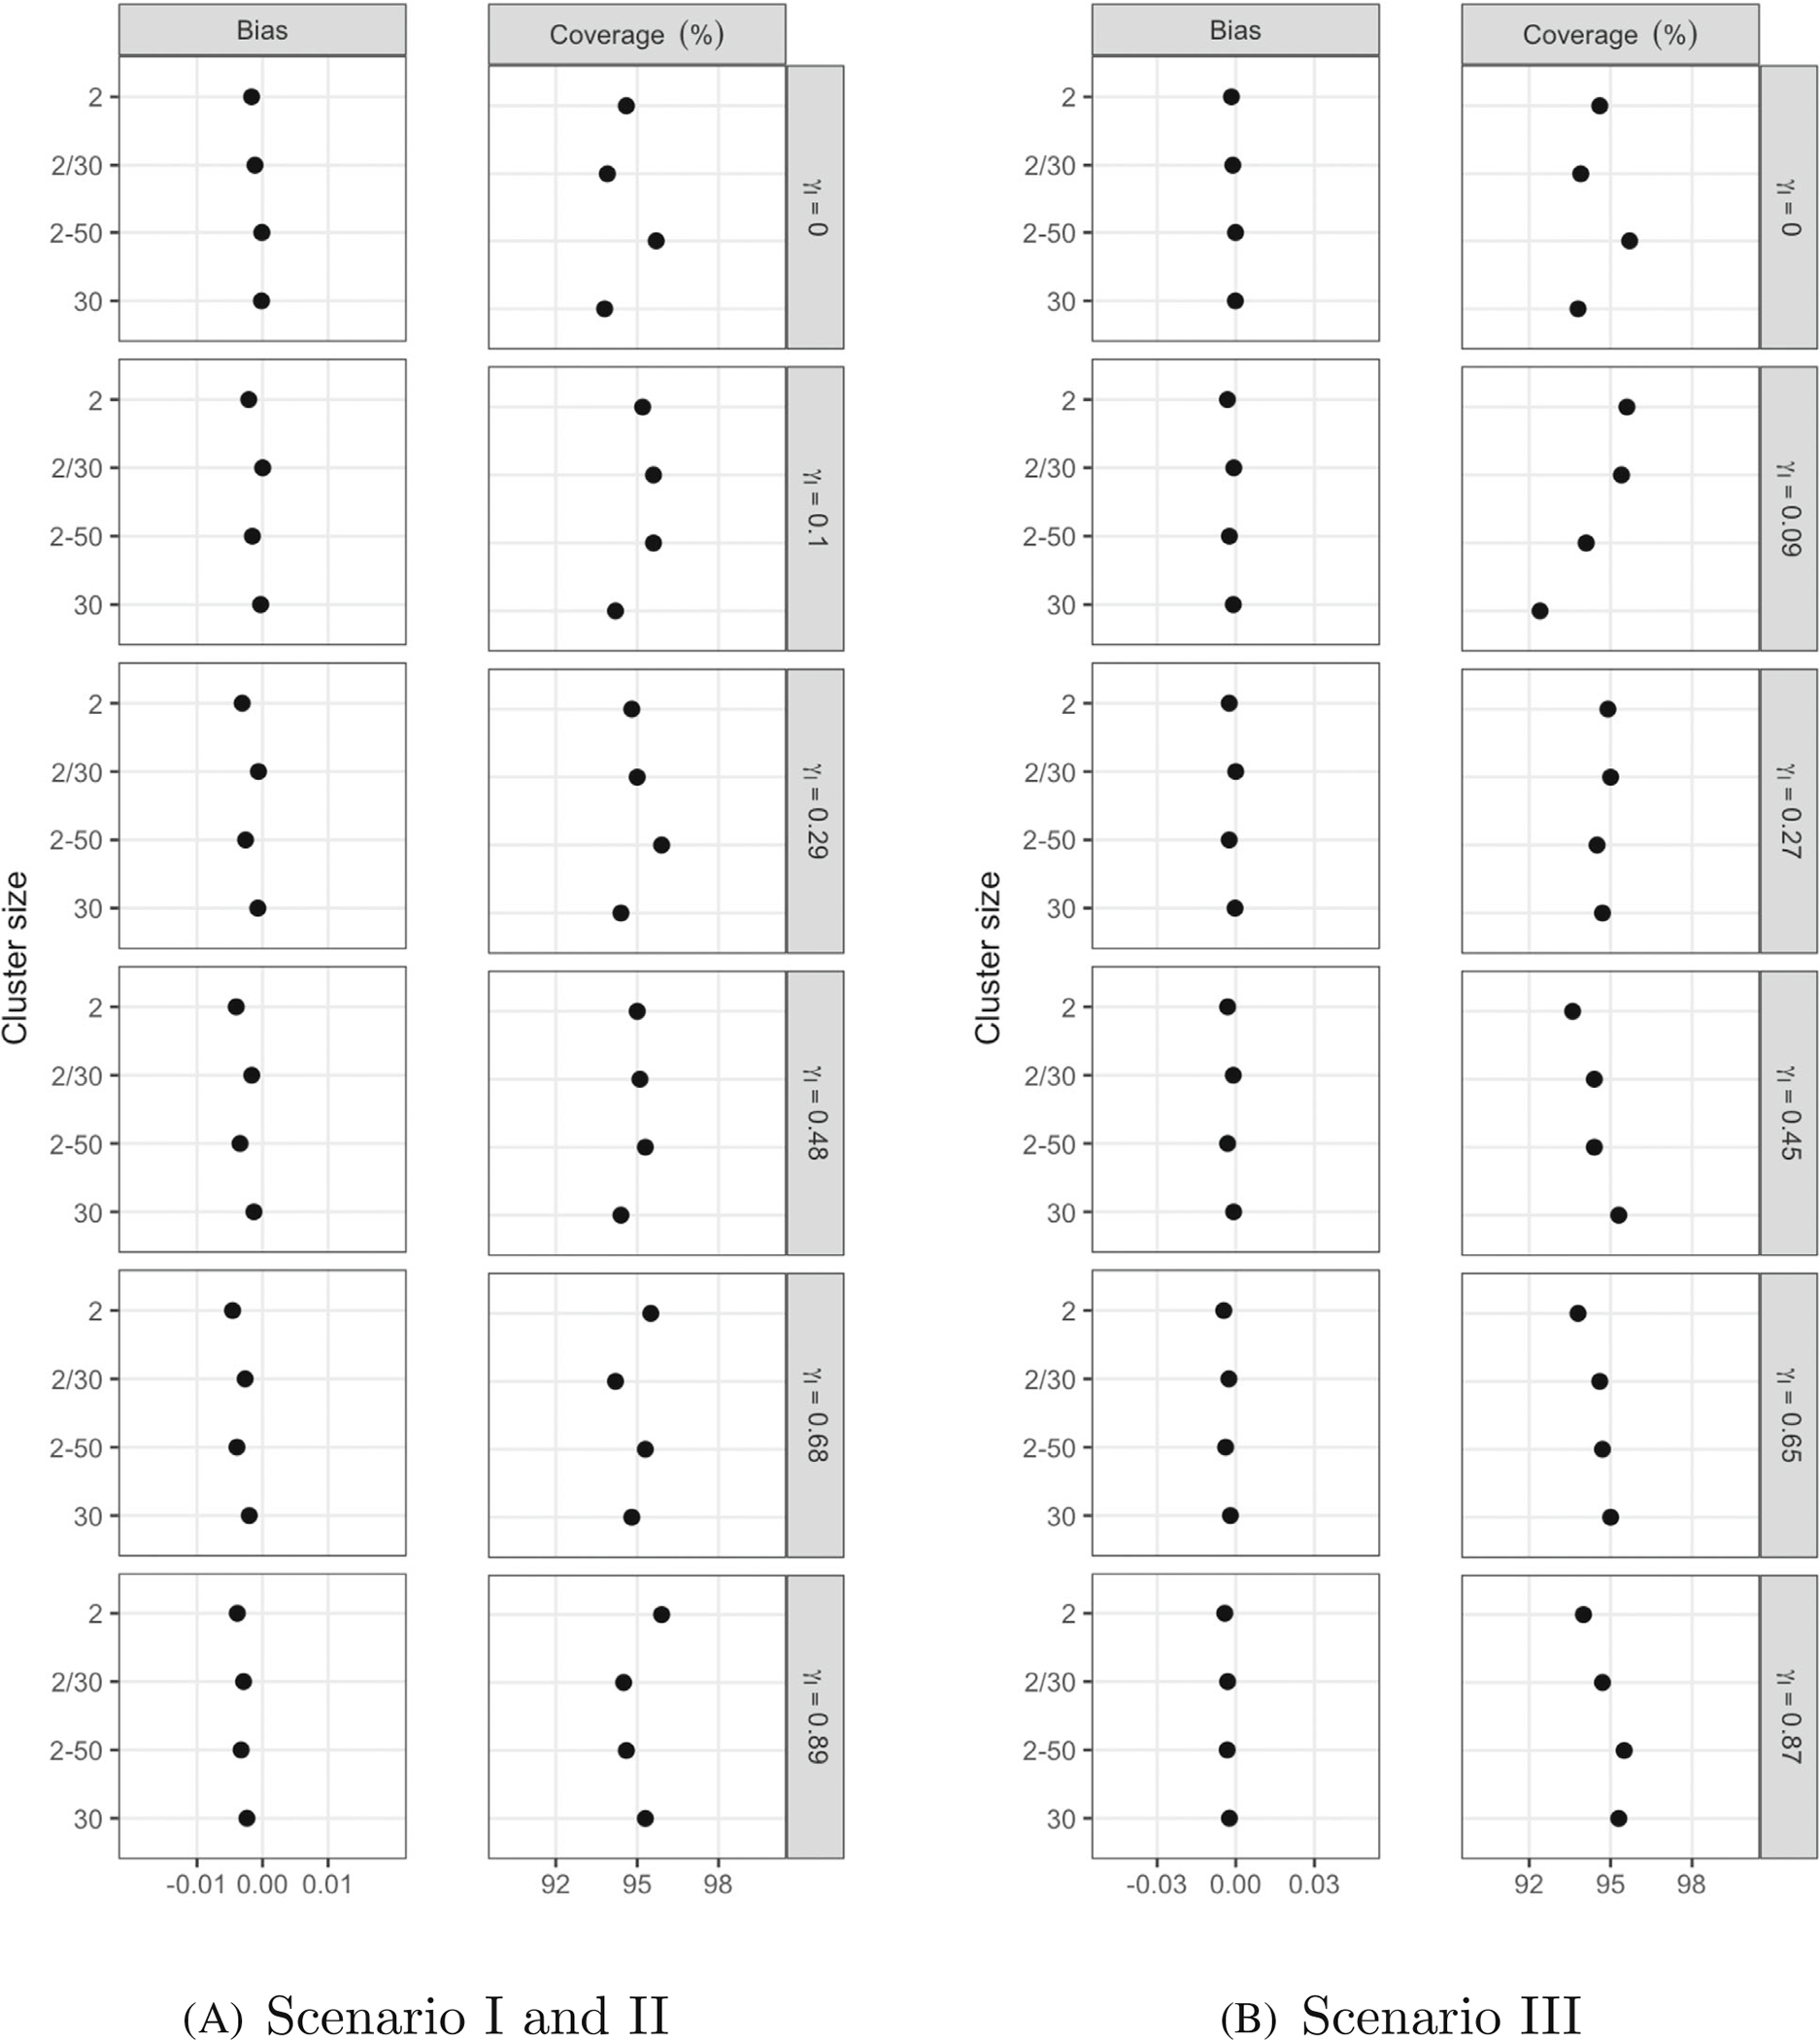
Clustered data are common in biomedical research. Observations in the same cluster are often more similar to each other than to observations from other clusters. The intraclass correlation coefficient (ICC), first introduced by R. A. Fisher, is frequently used to measure this degree of similarity. However, the ICC is sensitive to extreme values and skewed distributions, and depends on the scale of the data. It is also not applicable to ordered categorical data. We define the rank ICC as a natural extension of Fisher's ICC to the rank scale, and describe its corresponding population parameter. The rank ICC is simply interpreted as the rank correlation between a random pair of observations from the same cluster. We also extend the definition when the underlying distribution has more than two hierarchies. We describe estimation and inference procedures, show the asymptotic properties of our estimator, conduct simulations to evaluate its performance, and illustrate our method in three real data examples with skewed data, count data, and three-level ordered categorical data.

Keywords: clustered data; intraclass correlation; rank association measures.


Conflict of interest statement

CONFLICT OF INTEREST STATEMENT

The authors declare no potential conflict of interest.

Figures

FIGURE 1
FIGURE 1
Parameters of rank ICC γI and Fisher’s ICC ρI as a function of the within-cluster correlation (ρ) of Xij under normality (Scenario I) and after exponentiating the data (Scenario II).
FIGURE 2
FIGURE 2
Bias and coverage of 95% confidence intervals for our estimator of γI at different true values of γI and different numbers of clusters under Scenarios I (normality), II (exponentiated outcomes), and III (exponentiated cluster means). The number of observations per cluster was set at 30.
FIGURE 3
FIGURE 3
Bias and coverage of 95% confidence intervals for our estimator of γI at different true values of γI and different cluster sizes under Scenarios I (normality), II (exponentiated outcomes), and III (exponentiated cluster means). The number of clusters was set at 200. “2–50” means the cluster size follows a uniform distribution from 2 to 50, “2/30” means half of the clusters have size 2 and half have 30.
FIGURE 4
FIGURE 4
Bias and coverage of 95% confidence intervals for our estimator of γI at different true positive and negative values of γI when the cluster size in the population was 2. The number of clusters was set at 200.
FIGURE 5
FIGURE 5
Root mean squared error (RMSE), bias, and empirical SE of estimates obtained by the four weighting approaches for our estimator of γI. “Equal clusters” refers to assigning equal weights to clusters, “Equal obs” refers to assigning equal weights to observations, “ESS” refers to the iterative weighting approach based on the effective sample size, and “Combination” refers to the iterative weighting approach based on the linear combination of equal weights for clusters and equal weights for observations. We set the tolerance of the two iterative approaches to 0.00001.
FIGURE 6
FIGURE 6
Parameters of rank ICC γI as a function of the within-cluster correlation (ρ) of Xij when data are continuous or discretized into ordered categorical variables with 3,5, or 10 levels.
FIGURE 7
FIGURE 7
Bias and coverage of 95% confidence intervals for our estimators of γI2 and γI3 at different true values of γI2 and γI3 and different numbers of level-3 units. The number of level-2 units in a level-3 unit was set at 15. The number of level-1 units in a level-2 unit was set at 2.
FIGURE 8
FIGURE 8
Scatter plot of the first and second uACR measurements of each person in the example of albumin-creatinine ratio.
FIGURE 9
FIGURE 9
Histogram of numbers of seizures of children with untreated epilepsy from the 60 primary healthcare centers in the example of status epilepticus.
FIGURE 10
FIGURE 10
Scatter plot of PHQ-9 scores of male and female partners enrolled in the clustered randomized clinical trial in the example of Patient Health Questionaire-9 score.

References

    1. Fisher R. Statistical Methods for Research Workers. Edinburgh: Oliver & Boyd; 1925.
    1. Murray DM, Varnell SP, Blitstein JL. Design and analysis of group-randomized trials: a review of recent methodological developments. Am J Public Health. 2004;94(3):423–432. - PMC - PubMed
    1. Hedges LV, Hedberg EC. Intraclass correlation values for planning group-randomized trials in education. Educ Eval Policy Anal. 2007;29(1):60–87.
    1. Harris JA. On the calculation of intra-class and inter-class coefficients of correlation from class moments when the number of possible combinations is large. Biometrika. 1913;9(3/4):446–472.
    1. Shrout P, Fleiss J. Intraclass correlations: uses in assessing rater reliability. Psychol Bull. 1979;86(2):420–428. - PubMed

Publication types