

Calculation of ATP production rates using the Seahorse XF Analyzer
- PMID: 37548091
- PMCID: PMC10561364
- DOI: 10.15252/embr.202256380
Calculation of ATP production rates using the Seahorse XF Analyzer
Abstract
Oxidative phosphorylation and glycolysis are the dominant ATP-generating pathways in mammalian metabolism. The balance between these two pathways is often shifted to execute cell-specific functions in response to stimuli that promote activation, proliferation, or differentiation. However, measurement of these metabolic switches has remained mostly qualitative, making it difficult to discriminate between healthy, physiological changes in energy transduction or compensatory responses due to metabolic dysfunction. We therefore present a broadly applicable method to calculate ATP production rates from oxidative phosphorylation and glycolysis using Seahorse XF Analyzer data and empirical conversion factors. We quantify the bioenergetic changes observed during macrophage polarization as well as cancer cell adaptation to in vitro culture conditions. Additionally, we detect substantive changes in ATP utilization upon neuronal depolarization and T cell receptor activation that are not evident from steady-state ATP measurements. This method generates a single readout that allows the direct comparison of ATP produced from oxidative phosphorylation and glycolysis in live cells. Additionally, the manuscript provides a framework for tailoring the calculations to specific cell systems or experimental conditions.
Keywords: ATP; ECAR; Seahorse XF Analyzer; glycolysis; oxidative phosphorylation.
© 2023 The Authors. Published under the terms of the CC BY 4.0 license.
Conflict of interest statement
NR, GWR, PS, and AN are currently employees and shareholders of Agilent Technologies. BPD, and DAF were previously employees and shareholders of Agilent Technologies at the time of this study. ASD has previously served as a paid consultant for Agilent Technologies.
Figures
Sample trace of H2SO4 injections to determine buffer capacity of Seahorse experimental medium. Error bars are obscured by the symbol (n = 16 technical replicates from a single experiment).
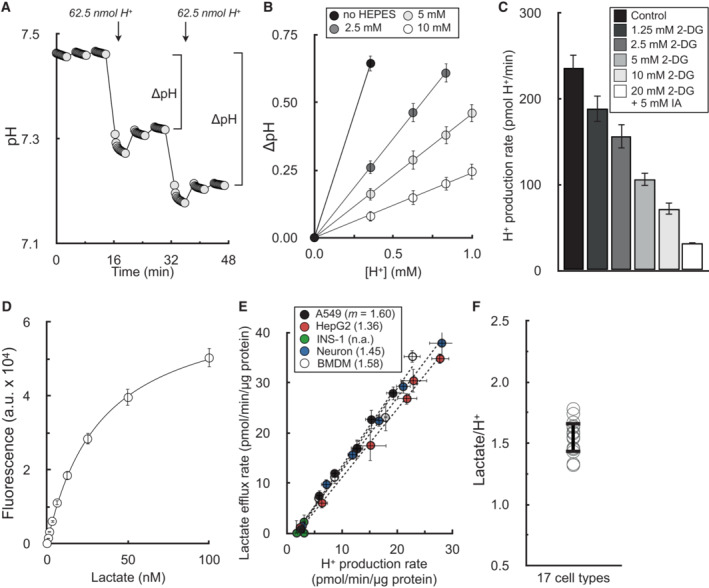
Changes in pH from sequential additions of 62.5 nmol H+ via the injector ports. The experimental medium is DMEM supplemented with 8 mM glucose, 2 mM glutamine, 2 mM pyruvate, and the indicated concentration of HEPES (pH 7.4). The microchamber volume of the 96‐well XF Analyzer is 2.28 μl. Step‐by‐step calculations are available in Dataset EV1 (n = 6 experimental replicates).
The H+ production rate is given for A549 cells treated acutely (20 min prior to assay) with varying concentrations of 2‐deoxyglucose (2DG) or 2DG with iodoacetic acid (IAA) to block glycogenolysis. The experimental medium contains 5 mM glucose with 5 mM HEPES, 200 nM rotenone (complex I inhibitor), 1 μM antimycin (complex III inhibitor), and 2 μM oligomycin (complex V inhibitor to block ‘reverse’ hydrolysis of ATP upon respiratory chain inhibition) (n = 6 biological replicates).
Sample trace of standard curve used to measure lactate collected from experimental medium (n = 3 technical replicates).
Plot of lactate efflux rates measured as in (D) against H+ production rates measured in the Seahorse XF Analyzer. Experimental conditions and titration of the rate with glycolytic inhibitors are as in (C). Parenthetical values given in the key are the fitted slopes for each individual cell type (n = 6 biological replicates).
Aggregate lactate:H+ ratios, calculated as in (E) for 17 different cell types, yielding an average value of 1.53 ± 0.12 (mean ± standard deviation).
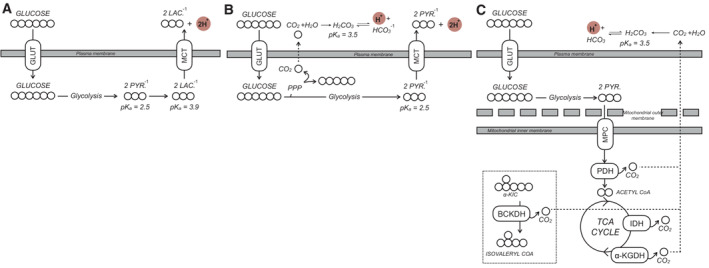
The main driver of extracellular acidification in most cell culture monolayer systems is lactate efflux. Uncharged glucose is taken up by the cell and converted to anionic pyruvate via glycolysis. Subsequent fermentation to lactate and efflux via monocarboxylate transporters causes a net pH change in the experimental medium that is detected by the XF Analyzer. GLUT, glucose transporter; MCT, monocarboxylate transporter; PYR., pyruvate; LAC., lactate.
Other reactions can cause a net pH change in the experimental medium, such as the efflux of glucose‐derived carbon as anionic pyruvate or CO2 evolved from the oxidative pentose phosphate pathway (PPP) that ultimately forms bicarbonate and H+.
CO2 evolution by mitochondrial dehydrogenases also generates bicarbonate that can be detected by ECAR. CO2 is evolved from various mitochondrial enzymes including isocitrate dehydrogenase (IDH) and the three oxoacid dehydrogenases: pyruvate dehydrogenase (PDH), α‐ketoglutarate dehydrogenase (α‐KGDH), and the branched chain keto acid dehydrogenase (BCKDH). α‐KIC, α‐ketoisocaproic acid, the keto acid derivative of leucine.
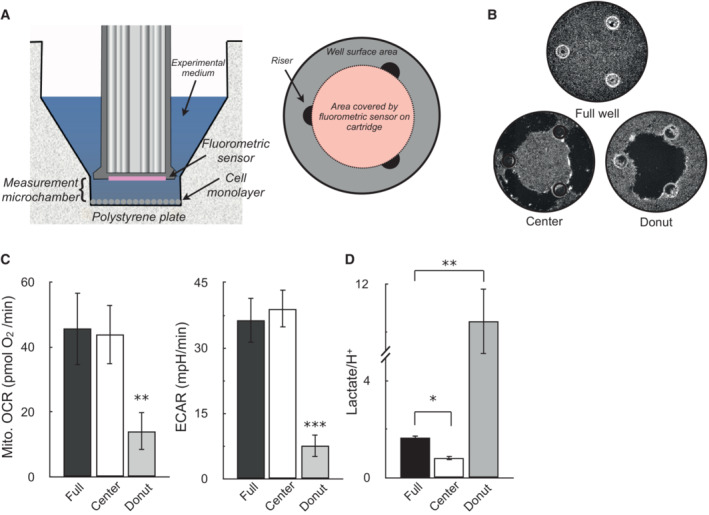
(Left) Cutaway image of Seahorse XF microplate and measurement sensor depicting location of the measurement microchamber, cell monolayer, and fluorometric sensor attached to the measurement cartridge. (Right) Birds‐eye view diagram of the XF microplate well, where the confluent monolayer in drawn in gray, the three plate risers maintaining the uniform volume of the measurement microchamber are drawn in black, and the area covered by the fluorometric sensor is given in pink.
Representative images of wells assayed with an uninterrupted monolayer of cells (“Full well”), wells with cells scraped off the outer rim (“Center”), and wells with cells scraped off the inner portion of the well (“Donut”).
OCR and ECAR in A549 cells for the scraping conditions described in (B) (n = 4 biological replicates).
The ratio of lactate (measured by enzymatic assay) to H+ (measured by the XF Analyzer) for the conditions described in (A and B). Assay medium is as in Fig. 1C (n = 4 biological replicates).
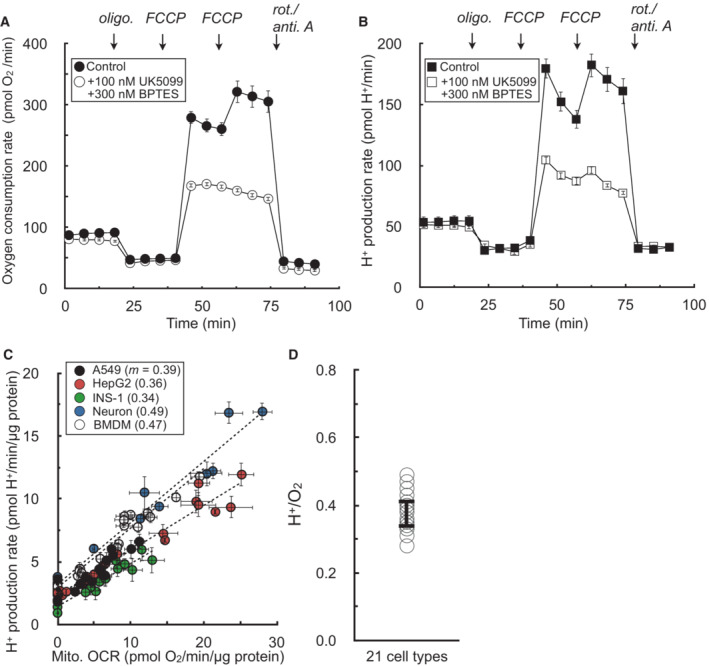
Sample kinetic trace of oxygen consumption in HepG2 cells in medium containing 5 mM pyruvate, 5 mM glutamine, 5 mM HEPES, 2 mM 2‐deoxyglucose, and 50 μM iodoacetate. Where indicated, the respiratory rate was modulated with addition of UK5099 (MPC inhibitor to block pyruvate oxidation) and BPTES (glutaminase inhibitor to block glutamine oxidation) (n = 8 technical replicates from a single experiment).
Sample kinetic trace of H+ production rates measured from (A) (n = 8 technical replicates from a single experiment).
Plot of H+ production rates against oxygen consumption rates for experiments conducted as in (A & B). The rates are titrated with mitochondrial effectors (oligomycin, varying concentrations of FCCP, rotenone/antimycin A) or combined treatment with UK5099 and BPTES. Individual points are taken as the average values for all measurements for a particular treatment (e.g. average of three measurements in response to initial FCCP addition). Parenthetical values given in the key are the fitted slopes for each individual cell type (n = 6 biological replicates).
Aggregate H+:O2 ratios, calculated as in (C) for 21 different cell types, yielding an average value of 0.38 ± 0.05 (mean ± standard deviation).
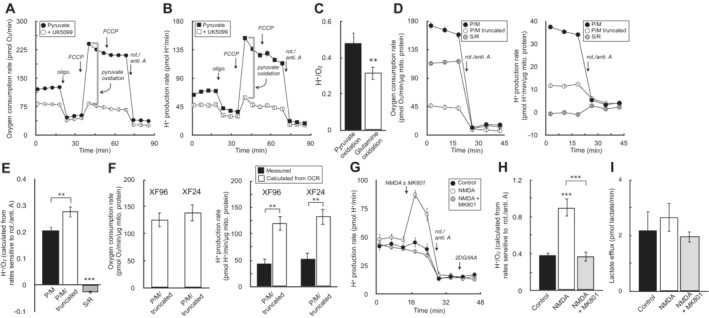
Sample oxygen consumption kinetic trace for HepG2 cells offered 5 mM pyruvate, 5 mM 2‐deoxyglucose (2‐DG), and 50 μM iodoacetate (IAA) in the experimental medium. Where indicated, cells were treated with 1 μM UK5099 for 20 min prior to measurements (n = 10 technical replicates).
Sample H+ production rates for the conditions as in (A) (n = 10 technical replicates).
The H+:O2 ratio is given for pyruvate and glutamine oxidation. Rates of H+ and O2 production for pyruvate oxidation were calculated as the UK5099‐sensitive, maximal rates of respiration & acidification as indicated by the gray brackets in (A and B). Rates for glutamine oxidation were calculated similarly except 5 mM glutamine was offered instead pyruvate in the experimental medium, and the glutaminase inhibitor CB‐839 was used instead of UK5099 (n = 4 biological replicates).
Sample kinetic traces of oxygen consumption (left) and H+ production (right) for rat heart mitochondria offered 10 mM pyruvate with 1 mM malate and 2 mM dichloroacetate (P/M), a substrate and inhibitor mix to run a truncated TCA cycle consisting of P/M supplemented with 60 μM fluorocitrate (to block isocitrate dehydrogenase), 2 mM malonate (to block succinate dehydrogenase), and 1 mM aminooxyacetate (to block transaminase activity) (P/M truncated), or 10 mM succinate with 2 μM rotenone (S/R). All respiration measurements were made in the presence of 2 μM oligomycin and 4 μM FCCP, and background rates were calculated in response to 200 nM rotenone and 1 μM antimycin A (n = 20 technical replicates).
The H+:O2 ratio is calculated for each condition as in (D) (n = 6 biological replicates).
(Left) Oxygen consumption rates in rat heart mitochondria offered conditions as in (D) for P/M truncated assayed in both the XF24 and XF96 assay platforms (n = 5 biological replicates). (Right) Measured H+ production rates for conditions as before (closed bars), compared to the theoretically predicted value assuming every mol of acid is stoichiometrically read by the instrument's H+ sensor (open bars) (n = 5 biological replicates).
Primary cortical neurons are offered 5 mM β‐hydroxybutyrate in aCSF medium supplemented with 5 mM 2‐DG, and 50 μM IAA. Where indicated, cells were acutely treated with 100 μM NMDA or NMDA plus the NMDA receptor inhibitor MK‐801 (10 μM) (n = 10 technical replicates).
The H+:O2 ratio is calculated for each condition as in (F) (n = 4 biological replicates).
The lactate efflux rate as measured by enzymatic assay for neurons treated for 20 min with the conditions as in (F) (n = 3 biological replicates).
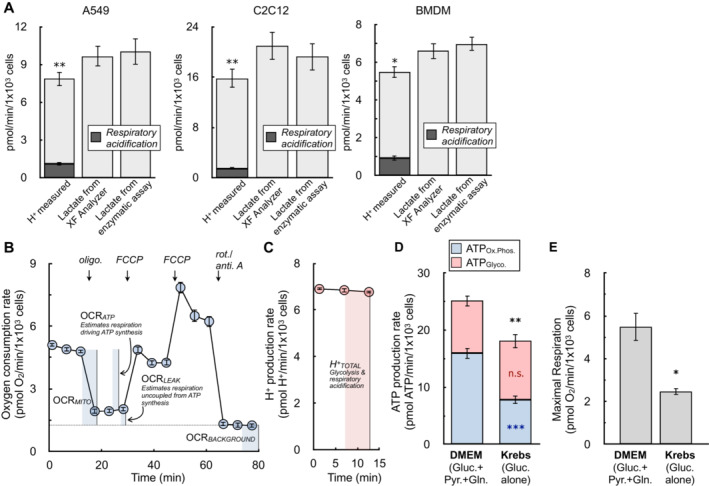
The H+ production rate from the XF Analyzer (left bar in each graph), the calculated lactate efflux rate from the XF Analyzer (center bar), and the lactate efflux rate measured from an enzymatic assay (right bar) are given for A549 cells, C2C12 cells, and primary bone marrow‐derived macrophages (BMDMs). Cells are offered 8 mM glucose, 2 mM pyruvate, and 2 mM glutamine in experimental medium supplemented with 5 mM HEPES. The shaded component of the H+ production rates for each cell type is the calculated contribution from respiratory acidification (n ≥ 4 biological replicates).
The oxygen consumption rate from a representative experiment with A549 cells is presented. Assay medium is as in (A). The parameters needed to calculate the ATP production rate are indicated within the figure (n = 6 technical replicates).
The H+ production rate from the kinetic trace in (B) is presented. Only the initial rates are shown, as these are the only measurements required to calculate the ATP production rate (n = 6 technical replicates).
ATP production rates calculated for A549 cells in DMEM supplemented with 8 mM glucose, 2 mM glutamine, and 2 mM pyruvate and Krebs–Henseleit buffer supplemented with only 10 mM glucose (n = 4 biological replicates).
Maximal respiratory rates measured in response to oligomycin and FCCP for treatments as in (D) (n = 4 biological replicates).
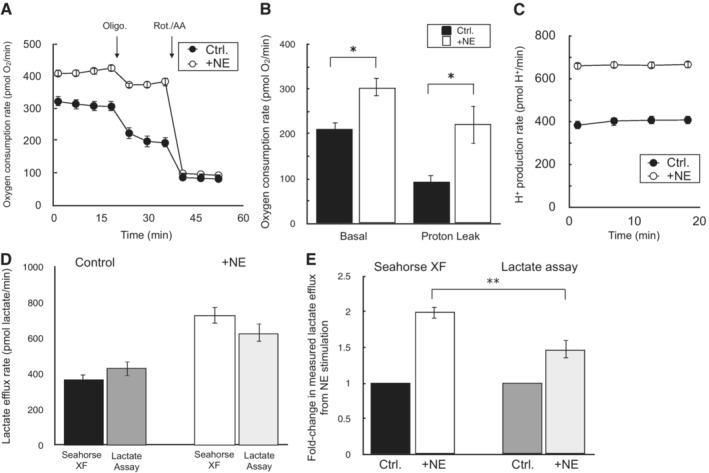
Sample oxygen consumption kinetic trace for iBAT cells offered 10 mM glucose, 2 mM glutamine, and 2 mM pyruvate in the experimental medium. Where indicated, cells were treated with 2 μM oligomycin or 200 nM rotenone with 1 μM antimycin A. NE = 5 μM norepinephrine (n = 10 technical replicates).
Sample kinetic trace of the H+ production rate as in (A) (n = 10 technical replicates).
Rates of basal mitochondrial respiration rates and respiration associated with proton leak for conditions as in (A) (n = 3 biological replicates).
Lactate efflux rates calculated by either the Seahorse XF Analyzer or an enzymatic lactate assay as described in the manuscript methods. NE, as before (n = 3 biological replicates).
Fold‐change in lactate efflux in response to norepinephrine as measured by the Seahorse XF Analyzer or an enzymatic lactate assay. NE, as before (n = 3 biological replicates).
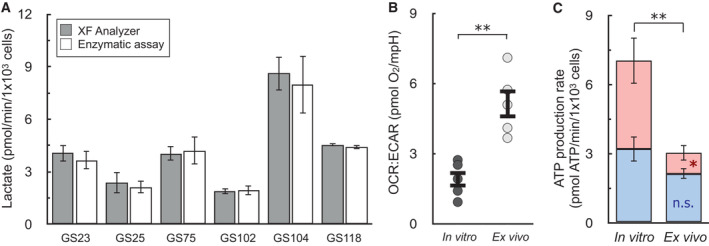
Lactate as measured by the XF Analyzer matches enzymatic lactate measurements for a panel of patient‐derived, gliomasphere (GS) cell lines after in vitro culture (n ≥ 3 biological replicates for each line).
OCR:ECAR ratios for patient‐derived glioblastoma cells cultured in vitro or assayed immediately after harvesting from mouse xenographs (ex vivo). Cell lined used were GS25, GBM39, GS114, GS116, GS122 (n = 5 biological replicates).
ATP Production rates from cell types as in (B) (n = 5 biological replicates).
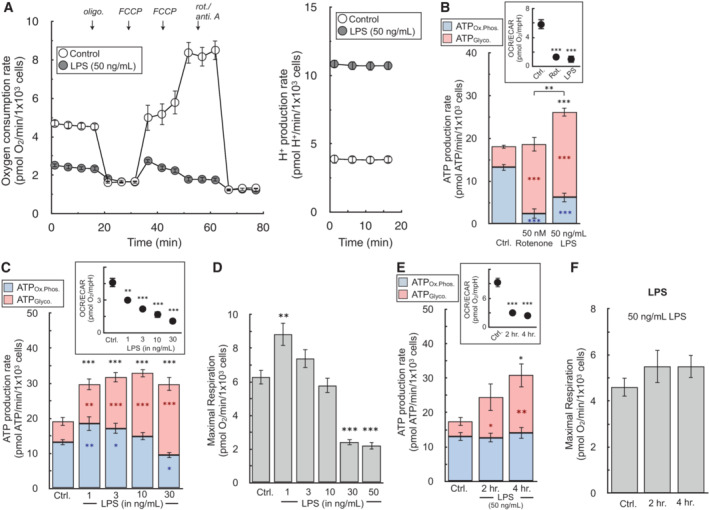
The oxygen consumption rate and H+ production rate from a representative experiment with BMDMs in response to treatment with 50 ng/ml LPS for 24 h (n = 5 technical replicates).
The ATP production rate is calculated for BMDMs in response to 50 ng/ml LPS or 50 nM rotenone for 24 h. (Inset) The OCR:ECAR ratio is presented for each condition (n = 6 biological replicates). Representative images used for cell counts are provided in the supplementary material.
The ATP production rate is calculated for BMDMs in response to varying concentrations of LPS ranging from 1 to 30 ng/ml for 24 h. (Inset) The OCR:ECAR ratio is presented for each condition (n = 5 biological replicates).
FCCP‐stimulated, maximal respiratory rates from treatments as in (C) (n = 5 biological replicates).
The ATP production rate is calculated for BMDMs in response to treatment for 2 or 4 h. with 50 ng/ml LPS. (Inset) The OCR:ECAR ratio is presented for each condition (n = 4 biological replicates).
FCCP‐stimulated, maximal respiratory rates from treatments as in (E) (n = 4 biological replicates).
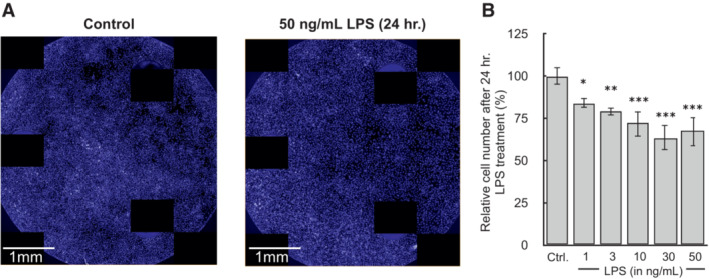
BMDMs were plated at 5 × 10⁴ cells/well treated with 50 ng/ml LPS for 24 h. in Seahorse XF96 well plates. (A) After the assay, cells were fixed overnight with 2% (v/v) paraformaldehyde, stained with Hoescht 33342, and images were captured using the Perkin Elmer Operetta.
Quantification of cell counts after 24 h. treatment with LPS (n = 4 biological replicates).
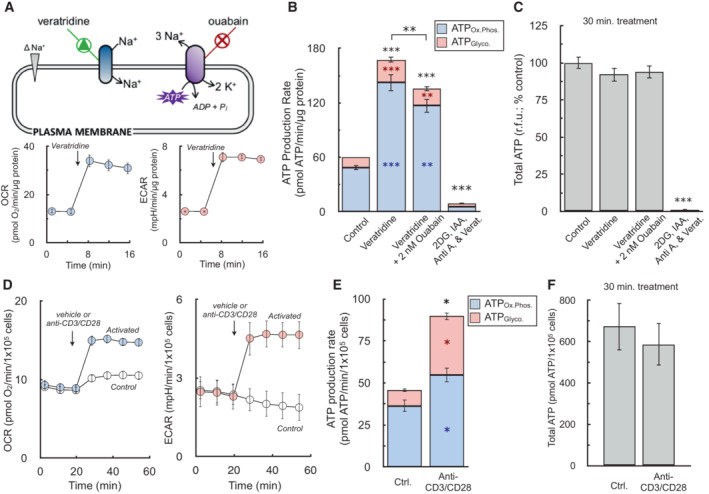
(Top) Schematic depicting increase in Na+/K+‐ATPase activity by veratridine, which will depolarize the plasma membrane by increasing sodium influx, thereby triggering ouabain‐sensitive increases in ATP production. (Bottom) Sample kinetic traces of OCR and ECAR in primary neurons upon acute addition of 1.5 μM veratridine (n = 10 technical replicates).
ATP production rates from oxidative phosphorylation (ATPOx.Phos., blue) and glycolysis (ATPGlyco., red) in response to (left to right) vehicle, 1.5 μM veratridine, veratridine plus 2 nM ouabain to demonstrate sensitivity of the assay, and veratridine plus 1 μM antimycin, 5 mM 2‐deoxyglucose, and 1 mM iodoacetic acid to cause an energy crisis and deplete ATP levels (n = 4 biological replicates).
Total ATP levels measured by luminescence after 15 min treatments as in (B) (n = 4 biological replicates).
Sample kinetic traces of OCR and ECAR in murine T cells acutely activated with anti‐CD3/CD28 (n = 4 technical replicates).
ATP production rates from oxidative phosphorylation and glycolysis in response to anti‐CD3/CD28 (n = 3 biological replicates).
Total ATP levels measured by luminescence after 30 min activation as in (E) (n = 3 biological replicates).
References
-
- Affourtit C, Brand MD (2009) Measuring mitochondrial bioenergetics in INS‐1E insulinoma cells. Methods Enzymol 457: 405–424 - PubMed
-
- van den Bossche J, Baardman J, Otto NA, van der Velden S, Neele AE, van den Berg SM, Luque‐Martin R, Chen HJ, Boshuizen MCS, Ahmed M et al (2016) Mitochondrial dysfunction prevents repolarization of inflammatory macrophages. Cell Rep 17: 684–696 - PubMed
-
- van den Bossche J, O'Neill LA, Menon D (2017) Macrophage immunometabolism: where are we (going)? Trends Immunol 38: 395–406 - PubMed
-
- Brand MD (2005) The efficiency and plasticity of mitochondrial energy transduction. Biochem Soc Trans 33: 897–904 - PubMed
