. 2023 Sep 15;211(6):944-953.
doi: 10.4049/jimmunol.2200721.

Proteolipid Protein-Induced Mouse Model of Multiple Sclerosis Requires B Cell-Mediated Antigen Presentation

Affiliations

Proteolipid Protein-Induced Mouse Model of Multiple Sclerosis Requires B Cell-Mediated Antigen Presentation

Connor R Wilhelm et al. J Immunol. .

Abstract

The pathogenic role B cells play in multiple sclerosis is underscored by the success of B cell depletion therapies. Yet, it remains unclear how B cells contribute to disease, although it is increasingly accepted that mechanisms beyond Ab production are involved. Better understanding of pathogenic interactions between B cells and autoreactive CD4 T cells will be critical for novel therapeutics. To focus the investigation on B cell:CD4 T cell interactions in vivo and in vitro, we previously developed a B cell-dependent, Ab-independent experimental autoimmune encephalomyelitis (EAE) mouse model driven by a peptide encompassing the extracellular domains of myelin proteolipid protein (PLPECD). In this study, we demonstrate that B cell depletion significantly inhibited PLPECD-induced EAE disease, blunted PLPECD-elicited delayed-type hypersensitivity reactions in vivo, and reduced CD4 T cell activation, proliferation, and proinflammatory cytokine production. Further, PLPECD-reactive CD4 T cells sourced from B cell-depleted donor mice failed to transfer EAE to naive recipients. Importantly, we identified B cell-mediated Ag presentation as the critical mechanism explaining B cell dependence in PLPECD-induced EAE, where bone marrow chimeric mice harboring a B cell-restricted MHC class II deficiency failed to develop EAE. B cells were ultimately observed to restimulate significantly higher Ag-specific proliferation from PLP178-191-reactive CD4 T cells compared with dendritic cells when provided PLPECD peptide in head-to-head cultures. We therefore conclude that PLPECD-induced EAE features a required pathogenic B cell-mediated Ag presentation function, providing for investigable B cell:CD4 T cell interactions in the context of autoimmune demyelinating disease.


Figures

Figure 1:
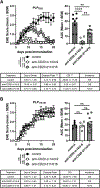
Figure 1:. EAE induced by PLPECD immunization is susceptible to B cell depletion therapy.
WT B6 mice were depleted of B cells by administering two i.p. injections of anti-CD20 mAb pre-immunization (days −14 and −9) or post-immunization (days 11 and 16). Groups of these mice, along with co-housed B cell-sufficient controls, were immunized s.c. on day 0 with either (A) PLPECD/CFA or (B) PLP178–191/CFA. Mice were additionally administered two i.p. injections of pertussis toxin on days 0 and 2. Clinical disease scores were monitored and area under the curve (AUC) values were calculated to display disease progression and severity. Accompanying tables compare disease onset, disease incidence, peak disease score, as well as the cumulative disease index (CDI). Values in each parameter were statistically compared against the control group using the ANOVA test. PLPECD: B cell-sufficient control, n = 13; d-14/−9 anti-CD20, n = 8; d11/16 anti-CD20, n = 10. PLP178–191: B cell-sufficient control, n = 10; d-14/−9 anti-CD20, n = 5; d11/16 anti-CD20, n = 10. Data are representative of four independent experiments. **p<0.01, ***p<0.001, ****p<0.0001
Figure 2:
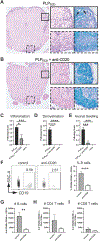
Figure 2:. B cell depletion limits neuroinflammation and demyelination in PLPECD-immunized mice.
WT B6 mice were injected i.p. with anti-CD20 mAb on days −14 and −9 and immunized s.c. on day 0 with PLPECD/CFA for EAE induction. (A-E) Groups of mice were co-housed with B cell sufficient controls and sacrificed on day 20 for histologic analysis of lumbar spinal cord sections (n = 5/group). (F-I) Additional groups of mice were sacrificed on day 20 following i.v. antibody exclusion stain (to discern circulating vs. non-circulating cells) for flow cytometry analysis of recovered lymphocytes from the CNS (pooled brain and spinal cord per mouse; n = 17/group). Representative lumbar spinal cord sections from (A) B cell-sufficient or (B) B cell-depleted EAE mice depicting H&E (left large images and left insets) and LFB staining (right insets). Blinded neuropathologist scoring of inflammation, demyelination, and axonal swelling are shown in (C-E), respectively. (F) Representative plots and summary depicting CD19+ frequencies within the non-circulating CD45hiCD45i.v.- lymphocyte gate. Summaries depicting accumulated numbers of non-circulating (G) B cells, (H) CD4 T cells, and (I) CD8 T cell recovered from day 20 CNS samples are shown. *p<0.05, **p<0.01, ***p<0.001, ****p<0.0001
Figure 3:
Figure 3:. B cells promote PLPECD-driven delayed-type hypersensitivity (DTH).
Co-housed B cell-sufficient or -depleted WT B6 mice were immunized s.c. with either (A) PLPECD/CFA or (B) PLP178–191/CFA on day 0. At day 20 post-immunization, ear pinnae were challenged with cognate antigen (black symbols) in one ear and PBS as a control in the opposite ear (white symbols). Ear swelling was measured at 48h. PLPECD: B cell-sufficient control, n = 5; n = 5 B cell depleted. PLP178–191: B cell-sufficient control, n = 5; anti-CD20, n = 5. Data are representative of two independent experiments. ***p<0.001
Figure 4:
Figure 4:. B cells promote PLPECD-driven CD4 T cell proliferation.
Co-housed B cell sufficient or depleted (125μg 5D2 i.p.) WT B6 mice were immunized s.c. with PLPECD/CFA or CFA alone on day 0. Seven days later, iLNs were harvested and single-cell suspensions were stained with CFSE and cultured for 5 days with PLPECD. Post-culture, cells were stained for flow cytometry analysis. (A) Representative plots depict the frequencies of CFSE-diluted CD4+TCRβ+ cells from stimulated vs. unstimulated culture conditions. (B) Summary of data in A, including CFA only controls. PLPECD: B cell-sufficient, n = 8; anti-CD20, n = 6. CFA only: B cell-sufficient, n = 5; anti-CD20, n = 3. Data are representative of three independent experiments. ****p<0.0001
Figure 5:
Figure 5:. B cells promote PLPECD-driven CD4 T cell activation and proinflammatory cytokine production.
Co-housed B cell-sufficient or -depleted WT B6 mice were immunized s.c. with PLPECD/CFA or CFA alone on day 0. Seven days later, iLNs were harvested and single-cell suspensions were cultured for 3 days with PLPECD. Following culture, cells were stained for flow cytometry analysis. (A) Representative plots of stimulated CD4+TCRβ+ cells from B cell-depleted or control mice depicting CD25 expression post-culture. (B) Summary of data in A, including CFA only controls. (C) Representative plots of stimulated CD4+TCRβ+CD25+ cells from B cell-depleted or control mice depicting IFNγ and IL-17A expression post-culture. (D) Summary of data in C, including CFA only controls. PLPECD: B cell-sufficient, n = 9; anti-CD20, n = 9. CFA only: B cell-sufficient, n = 5; anti-CD20, n = 3. Data are representative of three independent experiments. *p<0.05, **p<0.01, ****p<0.0001
Figure 6:
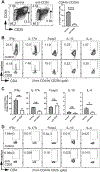
Figure 6:. B cell depletion does not significantly alter Foxp3+ expression or IL-10 production from activated CD4 T cells.
Co-housed B cell-sufficient or -depleted WT B6 mice were immunized s.c. with PLPECD/CFA or CFA alone on day 0. Seven days later, iLNs were harvested and single-cell suspensions were cultured for 3 days with PLPECD. Following culture, cells were stained for flow cytometry analysis. (A) Representative plots of stimulated CD4+TCRβ+ cells from B cell-depleted or control mice depicting CD44 and CD25 expression post-culture. A summary of CD44hiCD25hi double positive population frequency in each group is included (right panel). (B) Representative plots of stimulated CD4+TCRβ+CD44hiCD25+ cells from B cell-depleted or control mice depicting the indicated cytokine or Foxp3 expression post-culture. (C) Summary of data in B. (D) Representative plots of stimulated CD4+TCRβ+CD44hiCD25- cells from B cell-depleted or control mice depicting the indicated cytokine or Foxp3 expression post-culture. n = 5/group. Data are representative of two independent experiments. *p<0.05, **p<0.01, ****p<0.0001
Figure 7:
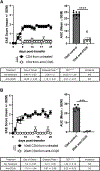
Figure 7:. Pathogenicity of PLPECD-reactive CD4 T cells is dependent on B cells.
Co-housed B cell-sufficient or -depleted donor WT B6 mice were immunized s.c. with PLPECD/CFA. Ten days later, spleens and lymph nodes from each group were harvested and single-cell suspensions were pooled and restimulated with PLPECD for 3 days. CD4 T cells were subsequently isolated and transferred i.v. to naïve recipients (day 0), which were administered two i.p. injections of pertussis toxin on days 0 and 2. Clinical disease scores were monitored and area under the curve (AUC) values were calculated to display disease progression and severity. Accompanying tables compare disease onset, disease incidence, peak disease score, and CDI. (A) 10 million CD4 T cells from each donor group were transferred. (B) 10 million CD4 T cells from the B cell-sufficient control donor group were transferred while 20 million CD4 T cells were transferred from the B cell-depleted donor group. B cell-sufficient transfers (10e6), n = 5–9; B cell-deficient transfers (10e6), n = 6; B cell-deficient transfers (20e6), n = 3. Data are representative of two independent experiments. *p<0.05, **p<0.01, ***p<0.001, ****p<0.0001
Figure 8:
Figure 8:. EAE induction by PLPECD is dependent on B cell receptor engagement.
Co-housed WT B6, MD4, or B cell-depleted MD4 mice were immunized s.c. with PLPECD/CFA on day 0 along with i.p. injections of pertussis toxin on days 0 and 2. Clinical disease scores were monitored and area under the curve (AUC) values were calculated to display disease progression and severity. Accompanying tables compare disease onset, disease incidence, peak disease score, and CDI. Values in each parameter were statistically compared against the WT B6 group using the ANOVA test. WT B6, n = 15; MD4, n = 15; MD4 + anti-CD20, n = 10. Data are representative of three independent experiments. **p<0.01, ***p<0.001, ****p<0.0001
Figure 9:
Figure 9:. PLPECD-induced EAE requires B cell-mediated antigen presentation.
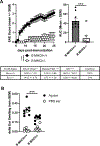
Bone marrow chimeric mice lacking MHC class II expression within the B cell compartment (B MHCII−/−) or co-housed control B MHCII+/+ chimeric mice were immunized s.c. with PLPECD/CFA on day 0 and received two i.p. injections of pertussis toxin on days 0 and 2. (A) Clinical disease scores were monitored and area under the curve (AUC) values were calculated to display disease progression and severity. Accompanying tables compare disease onset, disease incidence, peak disease score, and CDI. (B) On day 25, EAE ear pinnae were challenged with PLPECD (black symbols) in one ear and PBS as a control in the opposite ear (white symbols). Ear swelling was measured at 48h. B MHCII+/+, n = 10; B MHCII −/−, n = 10. Data are representative of four independent experiments. **p<0.01, ***p<0.001, ****p<0.0001
Figure 10:
Figure 10:. B cells are robustly efficient at presenting PLPECD antigen.
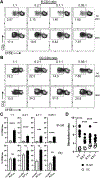
Co-housed WT B6 mice were immunized s.c. with either PLPECD/CFA or PLP178–191/CFA. Nine days later, spleens and iLNs were harvested from each group and single cell suspensions were prepared and pooled. CD4 T cells were isolated from PLP178–191-immune mice and stained with CFSE. 5×10⁵ CFSE-stained CD4s were incubated for 5 days with 20μg/ml PLPECD peptide in the presence of B cells or DCs isolated from day 9 PLPECD-immune mice at varying APC:CD4 ratios. Post-culture, cells were stained for flow cytometry analysis. (A) Representative plots depict CFSE-diluted CD4+TCRβ+ cell frequencies observed from B cell:CD4 cultures. (B) Representative plots depict CFSE-diluted CD4+TCRβ+ cell frequencies observed from DC:CD4 cultures. (C) Summaries of raw CFSE low percentages in each culture condition. (D) Summaries of the stimulation index (stimulated CFSE low %/unstimulated CFSE low %) in each APC:CD4 ratio group are shown. n = 6–8/group. Data are representative of three independent experiments. **p<0.01, ***p<0.001, ****p<0.0001

Similar articles

Cited by

References

    1. Walton C, King R, Rechtman L, Kaye W, Leray E, Marrie RA, Robertson N, La Rocca N, Uitdehaag B, van der Mei I, et al. (2020). Rising prevalence of multiple sclerosis worldwide: Insights from the Atlas of MS, third edition. Mult Scler 26, 1816–1821. 10.1177/1352458520970841. - DOI - PMC - PubMed
    1. Nelson LM, Wallin MT, Marrie RA, Culpepper WJ, Langer-Gould A, Campbell J, Buka S, Tremlett H, Cutter G, Kaye W, et al. (2019). A new way to estimate neurologic disease prevalence in the United States: Illustrated with MS. Neurology 92, 469–480. 10.1212/WNL.0000000000007044. - DOI - PMC - PubMed
    1. Culpepper WJ, Marrie RA, Langer-Gould A, Wallin MT, Campbell JD, Nelson LM, Kaye WE, Wagner L, Tremlett H, Chen LH, et al. (2019). Validation of an algorithm for identifying MS cases in administrative health claims datasets. Neurology 92, e1016–e1028. 10.1212/WNL.0000000000007043. - DOI - PMC - PubMed
    1. Wallin MT, Culpepper WJ, Campbell JD, Nelson LM, Langer-Gould A, Marrie RA, Cutter GR, Kaye WE, Wagner L, Tremlett H, et al. (2019). The prevalence of MS in the United States: A population-based estimate using health claims data. Neurology 92, e1029–e1040. 10.1212/WNL.0000000000007035. - DOI - PMC - PubMed
    1. Duffy SS, Lees JG, and Moalem-Taylor G (2014). The contribution of immune and glial cell types in experimental autoimmune encephalomyelitis and multiple sclerosis. Multiple sclerosis international 2014, 285245. 10.1155/2014/285245. - DOI - PMC - PubMed

Publication types

Substances