. 2023 Aug 16;145(32):18063-18074.
doi: 10.1021/jacs.3c05710. Epub 2023 Aug 7.

Experimental NOE, Chemical Shift, and Proline Isomerization Data Provide Detailed Insights into Amelotin Oligomerization

Affiliations

Experimental NOE, Chemical Shift, and Proline Isomerization Data Provide Detailed Insights into Amelotin Oligomerization

Sai Chaitanya Chiliveri et al. J Am Chem Soc. .

Abstract

Amelotin is an intrinsically disordered protein (IDP) rich in Pro residues and is involved in hydroxyapatite mineralization. It rapidly oligomerizes under physiological conditions of pH and pressure but reverts to its monomeric IDP state at elevated pressure. We identified a 105-residue segment of the protein that becomes ordered upon oligomerization, and we used pressure-jump NMR spectroscopy to measure long-range NOE contacts that exist exclusively in the oligomeric NMR-invisible state. The kinetics of oligomerization and dissociation were probed at the residue-specific level, revealing that the oligomerization process is initiated in the C-terminal half of the segment. Using pressure-jump NMR, the degree of order in the oligomer at the sites of Pro residues was probed by monitoring changes in cis/trans equilibria relative to the IDP state after long-term equilibration under oligomerizing conditions. Whereas most Pro residues revert to trans in the oligomeric state, Pro-49 favors a cis configuration and three Pro residues retain an unchanged cis fraction, pointing to their local lack of order in the oligomeric state. NOE contacts and secondary 13C chemical shifts in the oligomeric state indicate the presence of an 11-residue α-helix, preceded by a small intramolecular antiparallel β-sheet, with slower formation of long-range intermolecular interactions to N-terminal residues. Although none of the models generated by AlphaFold2 for the amelotin monomer was consistent with experimental data, subunits of a hexamer generated by AlphaFold-Multimer satisfied intramolecular NOE and chemical shift data and may provide a starting point for developing atomic models for the oligomeric state.


Conflict of interest statement

The authors declare no competing financial interest.

Figures
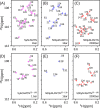
Figure 1
Figure 1
Effect of hydrostatic pressure on the Gly-residue region of the 1H–15N HSQC NMR spectra of uniformly 15N/2H-enriched amelotin (AMTN). (A–C) Full-length protein at concentrations of (A) 5 μM and (B,C) 500 μM in 30 mM sodium acetate buffer (pH 4.6) containing 70 mM NaCl, 97% H2O, 3% D2O, 15 °C, at hydrostatic pressure of (A,B) 1 bar and (C) 2000 bar. (D–F) Analogous spectra on the truncated construct, AMTN25–130, recorded under the same conditions as (A–C). Numbers indicate the Gly residue assignments in the AMTN sequence. Corresponding full HSQC spectra are shown in Figure S3, and chemical shifts are reported in Tables S1 and S2.
Figure 2
Figure 2
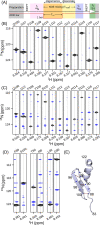
Measurement of 15N relaxation in oligomeric AMTN25–130 at 900 MHz 1H frequency. (A) Simplified pulse diagram. After preparation and nuclear spin equilibration at high pressure (gray), in-phase 15Nz magnetization is efficiently generated by a standard refocused INEPT element,, which immediately precedes a drop to atmospheric pressure. During this 1 bar (orange) block, longitudinal relaxation rates (R1 = 1/T1) and both Hahn-echo R2 and spin-locked (R) transverse relaxation rates are measured before returning the sample to high pressure (yellow) where protein monomerizes. Subsequent 15N evolution (purple) and INEPT transfer of magnetization to 1H for detection (green) are used to generate an 1H–15N HSQC readout. For details, see Figure S4. (B) 15N T1 relaxation times measured at 2 kbar (unshaded circle) and 1 bar (blue shaded circle). T1 values are derived from T1 = [ln(I1.4/I2.8)/1.4]−1 s, where I1.4 and I2.8 are the resonance intensities measured at low pressure durations of 1.4 and 2.8 s, respectively. (C) Overlay of Hahn-echo transverse 15N relaxation rates, R2, at 2 kbar (unshaded circle) and 1 bar (red shaded circle) with spin-locked transverse 15N relaxation rates, R, at 1 bar, measured using 1.0 kHz (green shaded circle) and 2.0 kHz (blue shaded circle) 15N spin lock fields. R rates have been corrected for both the effect of R1(8) and off-resonance effects. Data were collected on 500 μM [15N/2H]-AMTN25–130 in 30 mM sodium acetate buffer (pH 4.6) containing 70 mM NaCl at 15 °C on a 900 MHz spectrometer, using a dissociation delay of 300 ms. Experimental details and relaxation rates are reported in Tables S3 and S4.
Figure 3
Figure 3
Stroboscopic measurement of oligomeric AMTN25–130 chemical shifts. (A) Simplified pulse diagram. The low-pressure chemical shifts are derived from evolution during the κ period at time τo = 299 ms after the pressure drop. Durations, κ, are 0.55, 0.35, and 0.35 ms for 15N, 13Cα, and 13C’, respectively. For pulse sequence details, see Figure S7. (B–D) Deviations of (B) 15N, (C) 13C’, and (D) 13Cα chemical shifts from values measured under pressure-denatured (2 kbar) conditions. Small corrections for the known effect of pressure on random coil chemical shifts−, are accounted for in (B–D). (E) Generalized order parameter (S2) predicted from the secondary chemical shifts with the regions of β-sheet propensity marked by orange arrows and the α-helical region marked by a green cylinder. Data were obtained on a 900 MHz spectrometer with 500 μM [13C/15N/2H]-AMTN25–130 in 30 mM sodium acetate buffer (pH 4.6) and 70 mM NaCl, at 15 °C. See Table S5 for experimental parameters.
Figure 4
Figure 4
Oligomerization and dissociation of AMTN25–130, recorded for a sample under the same conditions as those reported for Figure 3. Secondary 15N shifts measured at (A) oligomerization delays, τo, and (B) dissociation delays (τd) of 15 (blue), 30 (yellow), and 300 ms (red) after jumping to low pressure (A) or to high pressure (D). (B,C) Correlation graphs of secondary 15N chemical shifts at τo = 15 (blue) and 30 ms (yellow) relative to values observed at 300 ms for (B) residues I87–F117 and (C) S35-G48. (E,F) Analogous correlations between deviations from 2 kbar 15N chemical shifts during dissociation for τd = 15 and 30 ms.
Figure 5
Figure 5
Measurement of AMTN25–130 NOEs in the oligomeric state by pressure-jump 3D HMQC-HSQC NOESY. (A) Simplified pulse diagram with a short (100 ms) low pressure delay at the start of the NOE mixing period. For full details, see Figure S9. (B) 1H strips taken through the 3D spectra and (F2,F3) frequencies of residues Q106-F117 at high pressure (TNOE = 150 ms; TLP = 0 ms), showing only weak sequential cross peaks, and (C) with numerous medium-range NOEs when the same TNOE mixing period includes a low pressure interval (TLP = 100 ms). For clarity, cross peaks are shown in blue and diagonal peaks in black, and all have the same sign. (D) Strips showing long-range contacts indicative of intramolecular β-sheets for residues F88-L92 and residues G96-S100. A full set of strips for residues H83-L104 is shown in Figure S10. (E) AlphaFold model for the H83-L122 segment of the monomeric subunit, extracted from a hexameric arrangement generated by AlphaFold-Multimer, which is compatible with intramolecular NOEs and chemical shifts. See Table S6 for experimental parameters.
Figure 6
Figure 6
Intermolecular NOE contacts in oligomeric AMTN25–130. Comparison of 15N strips taken from 900 MHz 3D pressure-jump 15N–15N–1H HMQC-NOESY spectra for samples containing U–15N/2H AMTN25–130 (blue) and a 50/50 mixture of U–15N/2H AMTN25–130 and U–14N/2H AMTN25–130 (green), both recorded with the pulse scheme of Figure 5A, using a 270 ms NOE mixing period, including TLP = 200 ms at low pressure. The decrease in intensity, indicated by arrows, in the mixed label sample suggests that the NOE contact is intermolecular. To account for the lower concentration of the observed species, the spectrum of the mixed sample is shown at 2.0-fold lower contour levels than that of the fully labeled sample.
Figure 7
Figure 7
Monitoring oligomerization on long time scales through cistrans proline isomerization in AMTN25–130. (A) Percentage of the cis-Pro population of pressure-denatured AMTN25–130 at −8 °C. (B–D) Change in cis (red) and trans (blue) populations with time by rapidly unfolding the protein at 2 kbar pressure for three Pro residues, P34, P49, and P62, with their cis fractions measured from neighboring residues S35, D50, and T61, respectively. Before unfolding the protein with 2 kbar pressure, the sample is incubated at 1 bar and 22 °C for 2 h to oligomerize. The schematic time course and data for the remaining eight Pro residues are shown in Figure S14. Data were collected on 750 μM 15N AMTN25–130 in 20 mM sodium acetate buffer (pH 5.6) containing 30 mM NaCl at −8 °C on an 800 MHz spectrometer.

Similar articles

Cited by

References

    1. Ingelsson M. Alpha-Synuclein Oligomers-Neurotoxic Molecules in Parkinson’s Disease and Other Lewy Body Disorders. Front. Neurosci. 2016, 10, 408. - PMC - PubMed
    1. Haataja L.; Gurlo T.; Huang C. J.; Butler P. C. Islet amyloid in type 2 diabetes, and the toxic oligomer hypothesis. Endocr. Rev. 2008, 29 (3), 303–316. 10.1210/er.2007-0037. - DOI - PMC - PubMed
    1. Sahoo B. R.; Cox S. J.; Ramamoorthy A. High-resolution probing of early events in amyloid-beta aggregation related to Alzheimer’s disease. Chem. Commun. 2020, 56 (34), 4627–4639. 10.1039/D0CC01551B. - DOI - PMC - PubMed
    1. Foguel D.; Suarez M. C.; Ferrao-Gonzales A. D.; Porto T. C. R.; Palmieri L.; Einsiedler C. M.; Andrade L. R.; Lashuel H. A.; Lansbury P. T.; Kelly J. W.; Silva J. L. Dissociation of amyloid fibrils of alpha-synuclein and transthyretin by pressure reveals their reversible nature and the formation of water-excluded cavities. Proc. Natl. Acad. Sci. U. S. A. 2003, 100 (17), 9831–9836. 10.1073/pnas.1734009100. - DOI - PMC - PubMed
    1. Nag S.; Sarkar B.; Bandyopadhyay A.; Sahoo B.; Sreenivasan V. K. A.; Kombrabail M.; Muralidharan C.; Maiti S. Nature of the Amyloid-beta Monomer and the Monomer-Oligomer Equilibrium. J. Biol. Chem. 2011, 286 (16), 13827–13833. 10.1074/jbc.M110.199885. - DOI - PMC - PubMed

Publication types