. 2023 Oct 1;34(10):1687-1708.
doi: 10.1681/ASN.0000000000000202. Epub 2023 Aug 7.

Tertiary Lymphoid Tissues Are Microenvironments with Intensive Interactions between Immune Cells and Proinflammatory Parenchymal Cells in Aged Kidneys

Affiliations

Tertiary Lymphoid Tissues Are Microenvironments with Intensive Interactions between Immune Cells and Proinflammatory Parenchymal Cells in Aged Kidneys

Takahisa Yoshikawa et al. J Am Soc Nephrol. .

Abstract

Significance statement: Ectopic lymphoid structures called tertiary lymphoid tissues (TLTs) develop in several kidney diseases and are associated with poor renal prognosis. However, the mechanisms underlying TLT expansion and their effect on renal regeneration remain unclear. The authors report that single-nucleus RNA sequencing and validation experiments demonstrate that TLTs potentially amplify inflammation in aged injured kidneys. Lymphocytes within TLTs promote proinflammatory phenotypes of the surrounding proximal tubules and fibroblasts within the TLTs via proinflammatory cytokine production. These proinflammatory parenchymal cells then interact with immune cells by chemokine or cytokine production. Such cell-cell interactions potentially increase inflammation, expand TLTs, and exacerbate kidney injury. These findings help illuminate renal TLT pathology and suggest potential therapeutic targets.

Background: Ectopic lymphoid structures called tertiary lymphoid tissues (TLTs) develop in several kidney diseases and are associated with poor renal prognosis. However, the mechanisms that expand TLTs and underlie exacerbation of kidney injury remain unclear.

Methods: We performed single-nucleus RNA sequencing (snRNA-seq) on aged mouse kidneys with TLTs after ischemia-reperfusion injury. The results were validated using immunostaining, in situ hybridization of murine and human kidneys, and in vitro experiments.

Results: Using snRNA-seq, we identified proinflammatory and profibrotic Vcam1+ injured proximal tubules (PTs) with NF κ B and IFN-inducible transcription factor activation. VCAM1 + PTs were preferentially localized around TLTs and drove inflammation and fibrosis via the production of multiple chemokines or cytokines. Lymphocytes within TLTs expressed Tnf and Ifng at high levels, which synergistically upregulated VCAM1 and chemokine expression in cultured PT cells. In addition, snRNA-seq also identified proinflammatory and profibrotic fibroblasts, which resided within and outside TLTs, respectively. Proinflammatory fibroblasts exhibited STAT1 activation and various chemokine or cytokine production, including CXCL9/CXCL10 and B cell-activating factor, contributing to lymphocyte recruitment and survival. IFN γ upregulated the expression of these molecules in cultured fibroblasts in a STAT1-dependent manner, indicating potential bidirectional interactions between IFN γ -producing CXCR3 + T cells and proinflammatory fibroblasts within TLTs. The cellular and molecular components described in this study were confirmed in human kidneys with TLTs.

Conclusions: These findings suggest that TLTs potentially amplify inflammation by providing a microenvironment that allows intense interactions between renal parenchymal and immune cells. These interactions may serve as novel therapeutic targets in kidney diseases involving TLT formation.


Conflict of interest statement

T. Kobayashi reports Consultancy: Astellas Pharma, Janssen Pharma; Research Funding: Astellas Pharma, Chugai Pharmaceutical, MSD; and Honoraria: Astellas Pharma, Bayer, Janssen Pharma, and MSD. Y. Murakawa reports the following: Employer: RIKEN; Ownership Interest: Revorf; and Research Funding: K.K. DNAFORM, and Revorf. Y. Sato reports Employer: Mitsubishi Tanabe Pharmaceutical company. M. Yanagita received research grants from Boehringer Ingelheim and Mitsubishi Tanabe Pharma. M. Yanagita also reports Honoraria: Astellas, Chugai, Kyowa Kirin, and others for lecture honoraria; and Speakers Bureau: AstraZeneca, Astellas, Kyowa Kirin, and others for lecture honoraria. T. Yoshikawa reports Honoraria: Kyowa Kirin. All remaining authors have nothing to disclose.

Figures

None
Graphical abstract
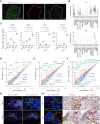
Figure 1
Figure 1
snRNA-seq revealed injured PT cells and various immune cells emerged in aged injured kidneys with TLTs. (A) Summary of snRNA-seq workflow. snRNA-seq was performed on individual kidneys 30 days after sham surgery or 45-minute Uni-IRI. The illustrations were used from the homepage of 10X Genomics (https://www.10xgenomics.com/jp) with permission. (B) PAS staining of murine kidneys 30 days after sham surgery and IRI, which were used for snRNA-seq. Scale bars=100 μm. PAS staining, Masson-Trichrome staining, and immunofluorescence for the sham-treated and IRI kidneys are displayed in Supplemental Figure 5. (C) UMAP plots of a kidney 30 days after sham surgery, which were classified into 19 clusters, and dot plots displaying gene expression patterns of representative marker genes for each cluster. (D) UMAP plots of the integrated IRI kidney dataset, which were classified into 21 clusters, and dot plots displaying expression patterns of representative marker genes for each cluster. (E) A left panel displayed UMAP plots of the integrated dataset of the sham-treated and three IRI kidneys, which were classified into 23 clusters. A right panel showed the UMAP plots separated by sample types, sham (blue dots) and IRI (red dots). Red lines encircled clusters mainly composed of the nuclei derived from the IRI kidneys (cluster 1, 17–23). (F) Feature plots showing high gene expression of Havcr1 encoding KIM1 in cluster 1 and Ptprc encoding CD45, an immune cell marker, in clusters 17–23 in the integrated dataset of a sham-treated and three IRI kidneys. CD, collecting duct; CNT, connecting tubule; DCT, distal convoluted tubule; EC, endothelial cell; IC, intercalated cell; PAS, Periodic acid–Schiff; PB/PC, plasmablast/plasma cell; PC, principal cell; PEC, parietal epithelial cell; Prolif., proliferating; PT, proximal tubule; S1/S2, S1 segment/S2 segment; S2/S3, S2 segment/S3 segment; snRNA-seq, single-nucleus RNA sequencing; TAL, thick ascending limbs of the loop of Henle; tLOH, thin limbs of the loop of Henle; TLT, tertiary lymphoid tissues; UMAP, Uniform Manifold Approximation and Projection; Uni-IRI, unilateral ischemia-reperfusion injury; VSMC, vascular smooth muscle cell.
Figure 2
Figure 2
Subset analysis of PT clusters in the ischemia-reperfusion injury kidneys showed proinflammatory and profibrotic injured PTs interacting with immune cells and fibroblasts. (A) UMAP plots displaying the reclustering of the PT cell subset in the integrated IRI kidney dataset and dot plots showing expression patterns of the representative marker genes for each PT cluster. Clusters 1 and 2, which expressed Havcr1 (encoding KIM1), were annotated as injured PT-1 and injured PT-2, respectively. (B) Enrichment analysis on the marker genes of injured PT-1 was performed. Top six KEGG pathways and GO terms are shown in the bar graphs. Significance was expressed as −log10(adjusted P-value). (C) Violin plots showing the gene expression patterns of adhesive molecules (Vcam1 and Icam1), profibrotic ligands (Tgfb2, Pdgfb, and Pdgfd), and chemokines or cytokines (Ccl2, Cxcl2, Cxcl10, Cxcl16, and Il34) across the PT clusters in the IRI kidneys. (D, E) A heatmap showing selected ligand-receptor interactions between (D) injured PT-1 and each immune cell type and (E) injured PT-1 and fibroblasts in the IRI kidney dataset. The color of the cell types (red or blue) corresponds to the color of the ligands or receptors expressed by the cell types. In each ligand-receptor pair name, the molecule at the root of the arrow is a ligand and the molecule at the arrowhead is a receptor. The dot size indicates the −log10(P-value) calculated using CellphoneDB, and the dot color indicates the log scaled mean expression of the ligand and receptor. (F) Gene regulatory network analysis was performed on each PT cluster in aged injured kidneys. The heatmap showed the average regulon activity across the four PT clusters. Representative TFs activated in each cluster were highlighted. The number of predicted target genes was shown following each TF's name. IRI, ischemia-reperfusion injury; PT, proximal tubule; TF, transcription factor; UMAP, Uniform Manifold Approximation and Projection.
Figure 3
Figure 3
Proinflammatory and profibrotic VCAM1+ injured PTs are preferentially localized around TLTs. (A) Representative immunofluorescence images of LTL (green), VCAM1 (red), and KIM1 (gray) and immunohistochemistry images staining for VCAM1 (brown) and megalin (pink) in the kidneys 30 days after 45-minute severe IRI (upper panels) and 18-minute mild IRI (lower panels). The areas enclosed by rectangles in the left panel are enlarged in the right panel in each staining. Images of severely injured kidneys showed that most of the KIM1+ injured PTs expressed VCAM1. In mild IRI kidneys, VCAM1+ PT cells were preferentially localized around TLTs. In some PTs, VCAM1 staining was observed only in the cells adjacent to TLTs in the same tubules (red arrows in the magnified image located in the lower right). Scale bars=100 μm. (B, C) Quantification of the percentages of VCAM1+ PT cells among (B) all KIM1+ PT cells and (C) PT cells adjacent to TLTs or PT cells not adjacent to TLTs, in each ROI in mild IRI model, using three ROIs including TLTs per kidney section (n=5, total of 15 ROIs). Approximately 84% of KIM1+ injured PT cells expressed VCAM1. VCAM1+ PT cells were significantly more prevalent around TLTs than in the other area (P = 0.001). Data are shown as the median and interquartile range. Mann-Whitney test was used to analyze the difference in (C). The representative images used for counting VCAM1+ or KIM1+ PT cells are shown in Supplemental Figure 3. (D) A combination of ISH with RNAscope (Tgfb2 [red]) and immunofluorescence (LTL [green], VCAM1 [gray], DAPI [blue]) showed more intense Tgfb2 expression in VCAM1+ injured PTs (encircled by yellow solid lines) adjacent to TLTs than in VCAM1 PTs (encircled by light blue solid lines) in aged injured kidney 30 days after 45-minute IRI. Scale bars=20 μm. (E) A combination of ISH with RNAscope (Ccl2 [upper panel, red] or Cxcl10 [lower panel, red]) and immunofluorescence (LTL [green], VCAM1 [gray], and DAPI [blue]) for aged injured kidneys 30 days after 18-minute mild IRI showed Ccl2 or Cxcl10 expression in the VCAM1+ injured PT cells adjacent to TLTs. The areas enclosed by rectangles are magnified in the right panels. Scale bars=20 μm. (F) Immunohistochemistry images staining for VCAM1, p105/p50, and p65 (brown), and megalin (pink) (upper panels) and VCAM1, STAT1, and IRF1 (brown) and megalin (pink) (lower panels) in serial sections of aged injured kidneys 30 days after 18-minute mild IRI. Expression and nuclear translocation of these transcription factors were upregulated in the VCAM1+ PTs surrounding TLTs. Scale bars=50 μm. Immunofluorescence images for p105/p50 and STAT1 in aged injured kidneys are also shown in Supplemental Figure 15. (G) A combination of ISH (Cxcl10 [red] and Stat1 [gray]) and immunofluorescence (LTL [green] and DAPI [blue]) displayed high Cxcl10 and Stat1 expression in the same PT cells surrounding TLTs (arrows). The area enclosed by a square was magnified in the lower panels. PTs are enclosed by yellow solid lines. Scale bars=20 μm. TLT borders are displayed as white dashed lines in immunofluorescence images and yellow dashed lines in immunohistochemistry images in (A and D–G). IRI, ischemia-reperfusion injury; ISH, in situ hybridization; PT, proximal tubule; ROI, region of interest; TLT, tertiary lymphoid tissue.
Figure 4
Figure 4
Increased production of TNFα and IFNγ within TLTs may promote the proinflammatory phenotype of surrounding injured PTs in murine and human kidneys. (A) A combination of ISH (Tnf [red] and Ifng [gray]) and immunofluorescence (p75NTR [green], a marker for fibroblasts within TLTs) showed the cells highly expressing Tnf and Ifng accumulated within TLTs in aged injured kidneys. Scale bars=50 μm. (B) Violin plots showing Tnf and Ifng expression patterns in the integrated IRI kidney dataset, showing that macrophages, T cells, and B cells expressed higher Tnf levels than the other populations and T cells expressed higher Ifng levels than the other populations. (C) The representative results of quantitative real-time PCR for HK2 cells, a human PT cell line, treated with vehicle (as a control), TNFα, IFNγ, or both for 24 hours were displayed (n=3/group). Relative VCAM1, ICAM1, CCL2, and CXCL10 mRNA expressions were shown. The expression levels were normalized to those of GAPDH. Values were shown as mean±SEM. Statistical significance was determined using a one-way ANOVA followed by the Tukey-Kramer post hoc test (*P < 0.05, **P < 0.01, and ***P < 0.001). (D–F) Scatter plots showing differentially expressed genes between HK-2 cells treated with vehicle and (D) TNFα, (E) IFNγ, or (F) both cytokines. Each axis showed the log2 scale of average transcripts per million (tpm) with the addition of 0.25. Colored dots indicated transcripts with log2 fold change >0.5 or < −0.5 and adjusted P-value < 0.05. Genes that were significantly upregulated and downregulated in the HK-2 cells treated with the cytokines were shown as light red and light blue dots, respectively. Genes upregulated and downregulated both in injured PT-1 in our snRNA-seq dataset and in the HK-2 cells treated with the cytokines were shown as red and blue dots, respectively. Genes encoding ligands in those upregulated genes were shown as green dots and named in green characters. Representative downregulated genes of injured PT-1 were named in blue characters. (G) Representative immunofluorescence images for human transplanted kidneys from two cases. Immunofluorescence image staining for CD20 (green), CD3ε (red), and DAPI (blue) displayed TLTs that consisted of aggregates of both B and T cells (left panels). Immunofluorescence images for VCAM1 (green), megalin (red), and DAPI (blue) showed VCAM1+ injured PTs surrounding TLTs (right panels). Scale bars=50 μm. Clinical profiles of the two cases were shown in Supplemental Table 3. (H) Magnified immunofluorescence images in the areas enclosed by rectangles in (G) staining for VCAM1 (green), megalin (red), and DAPI (blue) showed VCAM1+ injured PTs surrounding TLTs in human transplanted kidneys of two cases. In the same regions, immunostaining for transcription factors (p65 and pSTAT1) (brown) and megalin (pink) were shown. p65 and pSTAT1 were translocated into nuclei in the VCAM1+ PTs surrounding TLTs. Scale bars=50 μm. TLT borders are shown as dashed lines (A, G, and H). CD, collecting duct; CNT, connecting tubule; DCT, distal convoluted tubule; EC, endothelial cell; IC, intercalated cell; ISH, in situ hybridization; PB/PC, plasmablast/plasma cell; PC, principal cell; PEC, parietal epithelial cell; Prolif., proliferating; PT, proximal tubule; S1/S2, S1 segment/S2 segment; S2/S3, S2 segment/S3 segment; TAL, thick ascending limbs of the loop of Henle; tLOH, thin limbs of the loop of Henle; TLT, tertiary lymphoid tissue; VSMC, vascular smooth muscle cell.
Figure 5
Figure 5
Analysis of fibroblasts in aged injured kidneys revealed transcriptomics of profibrotic fibroblasts and proinflammatory fibroblasts. (A) UMAP plots displaying five clusters in the fibroblast subset in the integrated IRI kidney dataset and dot plots showing expression patterns of the representative marker genes for each fibroblast cluster. The marker gene names for the profibrotic and proinflammatory fibroblast clusters are displayed in light blue and purple characters, respectively. The categories of the genes are shown above the dot plot (ECM, extracellular matrix; SLO, secondary lymphoid organ). Expression patterns of these marker genes are also shown in violin plots in Supplemental Figure 20. (B) Top six GO terms significantly enriched in the profibrotic (cluster 4) and proinflammatory (cluster 5) fibroblast clusters in aged injured kidneys. Significance was shown as −log10(adjusted P-value). The KEGG pathways enriched in these fibroblast clusters are shown in Supplemental Figure 19. (C) Gene regulatory network analysis was performed on the fibroblast clusters in aged injured kidneys. A heatmap displayed the average regulon activities in each of the five fibroblast clusters. The representative TFs were highlighted on the right of the heatmaps. The number of predicted target genes was shown following each TF's name. (D) Violin plots showing expression patterns of the selected genes encoding TFs (Runx1, Creb3l2, Stat1, and Irf1) across five fibroblast clusters. (E) UMAP plots showed that the integrated data from fibroblast subsets of sham-treated and IRI kidney datasets was classified into five clusters. (F) Pseudotime trajectory analysis was performed on the integrated fibroblast dataset using Monocle2. The trajectory plots were colored by cluster identity (left panel) and by sample type, sham (blue dots), and IRI (red dots) (right panel). All cells were divided into three cell states. States 1 and 2 were defined as the roots of fibroblast differentiation after kidney injury because they included most of the nuclei derived from the sham-treated kidney dataset. The nuclei included in the state 3 (encircled by red dashed lines) were reanalyzed (G). (G) Reanalysis of the nuclei included in the state 3 of the trajectory plots in (F). The trajectory tree bifurcated into two branches along the distinct fibroblast subtypes from the branch point (node number 2). Right trajectory plots show the pseudotime along the trajectory tree depending on the shade of blue. (H) A heatmap showing gene expression changes of the differentially expressed genes identified by branched expression analysis modeling (q-value <0.001) between two fibroblast subtypes, proinflammatory, and profibrotic fibroblasts. The pseudotime starting point in the middle of the heatmap was the branch point (node number 2) in (G). Representative gene names are highlighted. IRI, ischemia-reperfusion injury; TF, transcription factor; UMAP, Uniform Manifold Approximation and Projection.
Figure 6
Figure 6
Distinct localization of profibrotic fibroblasts and proinflammatory fibroblasts outside and within TLTs. (A) Immunofluorescence images staining for ECM proteins (type 1 collagen, tenascin-C, and fibronectin) (green), αSMA (red), and DAPI (blue) showed that these ECM accumulated in the interstitial space outside TLTs. Scale bars=50 μm. (B) Immunofluorescence images staining for RUNX1 (green), αSMA (red), and DAPI (blue) showed that RUNX1 was expressed in the nuclei of αSMA+ myofibroblasts (arrows) around TLTs in aged injured kidneys. A magnified view of the areas enclosed by a rectangle in the left panel is shown in the right panel. Scale bars=20 μm. (C) Representative immunofluorescence images staining for the selected markers for proinflammatory fibroblasts (CXCL9, CXCL10, IL33, and C3 [green], PDGFRβ [red], p75NTR [red], and DAPI [blue]) showed that these markers were expressed in the fibroblasts within TLTs. Magnified views of the area enclosed by rectangles in the left panels are shown in the right panels. Scale bars=20 μm. (D) A combined immunofluorescence (p75NTR [green] and DAPI [blue]) and in situ hybridization (Tnfsf13b [red] and Pdgfrb [gray]) showed that fibroblasts within TLTs expressed Tnfsf13b more intensely than fibroblasts in the other area. The areas enclosed by squares are displayed in a magnified view in the upper right of the panels, and they show that Tnfsf13b and Pdgfrb are expressed in the same p75NTR+ fibroblast. Scale bars=10 μm. (E) Immunofluorescence images staining for markers of secondary lymphoid organ stromal cells (podoplanin and MFGE8) (green) and p75NTR (red) in TLTs. Podoplanin and MFGE8 expression merged with p75NTR expression in the fibroblasts within TLTs. Scale bars=50 μm. (F) A heatmap showing selected ligand-receptor interactions between the proinflammatory fibroblasts and lymphocytes (T and B cells) in aged injured kidneys. The cell type color (red or blue) corresponds to the colors of the ligands or receptors expressed by the cell types. In the ligand-receptor pair name, the molecule at the root of the arrow is a ligand and the molecule at the arrowhead is a receptor. The dot size indicates −log10(P-value) calculated using CellPhoneDB, and the dot color indicates the log scaled mean expression of the ligand and receptor. TLT borders are shown as dashed lines (A–E). ECM, extracellular matrix; TLT, tertiary lymphoid tissue.
Figure 7
Figure 7
IFNγ/STAT1 signaling potentially promotes the proinflammatory phenotype of the fibroblasts within TLTs in murine and human kidneys. (A, B) A combination of immunofluorescence (p75NTR [green]) and ISH (Stat1 [red]) showed high Stat1 expression within TLT areas indicated by the presence of p75NTR+ fibroblasts (A) in low magnification in murine aged injured kidneys (Scale bars=300 μm). (B) The magnified image within TLTs showed that p75NTR+ fibroblasts expressed Stat1 (Scale bars=20 μm). (C) Immunofluorescence images staining for pSTAT1 (green), p75NTR (red), and DAPI (blue) showed that pSTAT1 was expressed in the nuclei of the fibroblasts within TLTs in murine aged injured kidneys. TLT borders are displayed as dashed lines. A magnified view of the areas enclosed by a rectangle in the left panel is shown in the right panel. Scale bars=20 μm. (D) Western blotting for STAT1 and GAPDH in WT and STAT1 KO C3H10T1/2 cells showed complete loss of STAT1 protein in all KO cells. Sanger sequences for a part of Stat1 exon4 in representative WT cells and STAT1-KO cells showed double peaks starting from the downstream of PAM sequence only in STAT1-KO cells, indicating successful DNA deletions at the target sequence (red line, PAM sequence; black arrow, sgRNA sequence). (E) Representative relative Cxcl9, Cxcl10, and Tnfsf13b mRNA expression levels in WT and STAT1-KO C3H10T1/2 treated with vehicle or IFNγ for 24 hours (n=3/group). The expression levels were normalized to those of Gapdh. Values are shown as the mean±SEM. Statistical significance was determined using a one-way ANOVA followed by the Tukey-Kramer post hoc test (**P < 0.01, ***P < 0.001). (F) Immunofluorescence images of TLTs in a human transplanted kidney (Case 1 in Supplemental Table 3). The immunofluorescence image staining for CD20 (green), CD3ε (red), and DAPI (blue) displayed the B-cell zone (encircled by yellow dashed lines) and the T-cell zone in the TLT surrounded by white dashed lines. Scale bars=20 μm. (G) A combination of immunofluorescence (p75NTR [red], pSTAT1 [gray], and DAPI [blue]) and ISH (CXCL9 [green]) showed high CXCL9 and pSTAT1 expression in the T-cell zone outside the B-cell zone (encircled by yellow dashed lines) in TLTs (encircled by white dashed lines) in the human transplanted kidney. The area enclosed by a solid square is magnified at the right lower bottom of each image, showing a p75NTR+ fibroblast expressing CXCL9 with pSTAT1 nuclear translocation. Scale bars=10 μm. ISH, in situ hybridization; KO, knockout; PAM, protospacer adjacent motif; WT, wild type.
Figure 8
Figure 8
Schemes showing cell-cell interactions between immune cells and renal parenchymal cells in aged injured kidneys with TLTs. (A) A scheme showing cell-cell interactions between PT cells and immune cells in the microenvironment around TLTs. VCAM1+ injured PTs are preferentially localized around TLTs. Proinflammatory cytokines, TNFα and IFNγ, are excessively produced by immune cells within TLTs and potentially promote the adhesive and proinflammatory phenotype of the surrounding PT cells. These VCAM1+ injured PT cells with activated NFκB and IFN-inducible transcription factors recruit and activate macrophages and dendritic and T cells via the production of proinflammatory cytokines or chemokines, such as CCL2 and CXCL10, which may further promote inflammation and TLT expansion. VCAM1+ injured PTs further activate fibroblasts via TGFβ2 and PDGF production, resulting in fibrosis around TLTs. (B) A scheme showing the interactions between proinflammatory fibroblasts and lymphocytes within TLTs. IFNγ produced by CXCR3+ T cells promotes the proinflammatory phenotype of the fibroblasts within TLTs in a STAT1-dependent manner. The STAT1-activated fibroblasts contribute to CXCR3+ T-cell recruitment and retention by producing CXCL9 and CXCL10 and also contribute to B-cell survival and proliferation by producing B cell–activating factor. These interactions further promote TLT expansion. PT, proximal tubule; TLT, tertiary lymphoid tissue.

Comment in

References

    1. Luo S, Zhu R, Yu T, Fan H, Hu Y, Mohanta SK. Chronic inflammation: a common promoter in tertiary lymphoid organ neogenesis. Front Immunol. 2019;10:2938. doi:10.3389/fimmu.2019.02938 - DOI - PMC - PubMed
    1. Bombardieri M, Lewis M, Pitzalis C. Ectopic lymphoid neogenesis in rheumatic autoimmune diseases. Nat Rev Rheumatol. 2017;13(3):141–154. doi:10.1038/nrrheum.2016.217 - DOI - PubMed
    1. Sautès-Fridman C, Petitprez F, Calderaro J, Fridman WH. Tertiary lymphoid structures in the era of cancer immunotherapy. Nat Rev Cancer. 2019;19(6):307–325. doi:10.1038/s41568-019-0144-6 - DOI - PubMed
    1. Sato Y, Tamura M, Yanagita M. Tertiary lymphoid tissues: a regional hub for kidney inflammation. Nephrol Dial Transplant. 2021;38(1):26–33. doi:10.1093/ndt/gfab212 - DOI - PubMed
    1. Sarwal M, Chua MS, Kambham N, Hsieh SC, Satterwhite T, Masek M. Molecular heterogeneity in acute renal allograft rejection identified by DNA microarray profiling. N Engl J Med. 2003;349(2):125–138. doi:10.1056/NEJMoa035588 - DOI - PubMed

Publication types

LinkOut - more resources