. 2023 Aug 7;19(8):e1011306.
doi: 10.1371/journal.pcbi.1011306. eCollection 2023 Aug.

Effective mechanical potential of cell-cell interaction explains three-dimensional morphologies during early embryogenesis

Affiliations

Effective mechanical potential of cell-cell interaction explains three-dimensional morphologies during early embryogenesis

Hiroshi Koyama et al. PLoS Comput Biol. .

Abstract

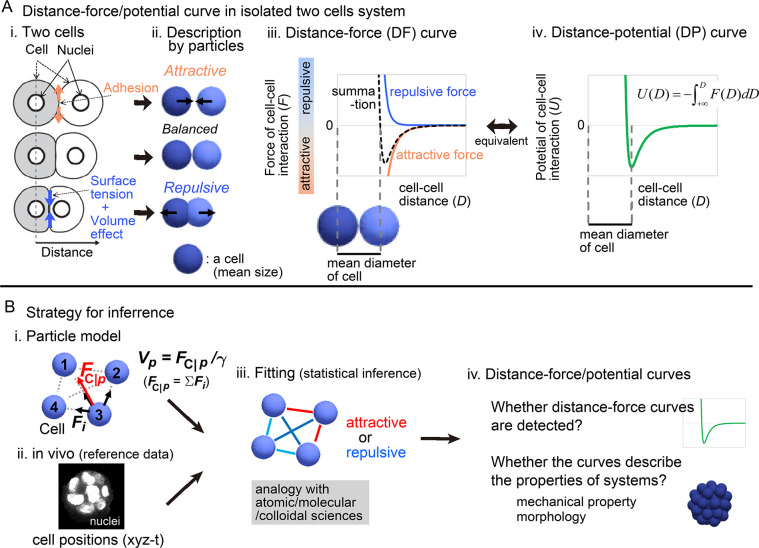
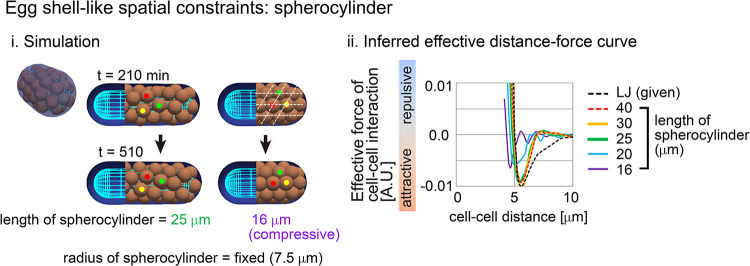
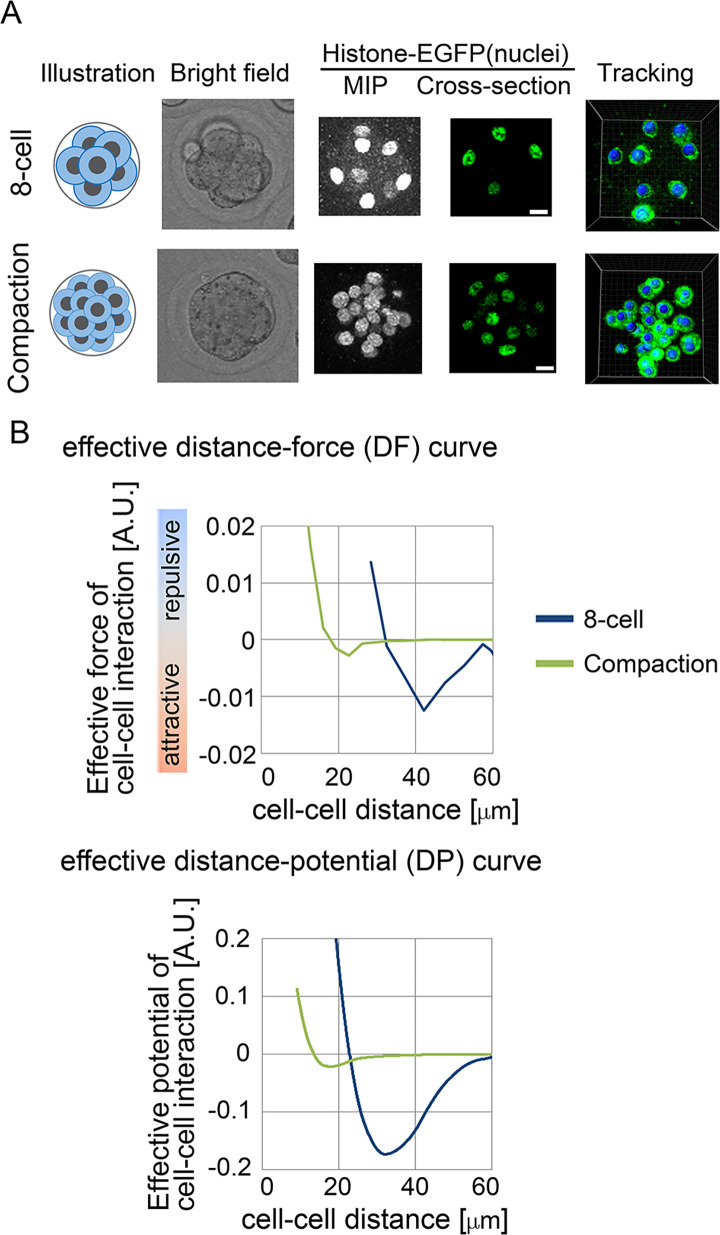
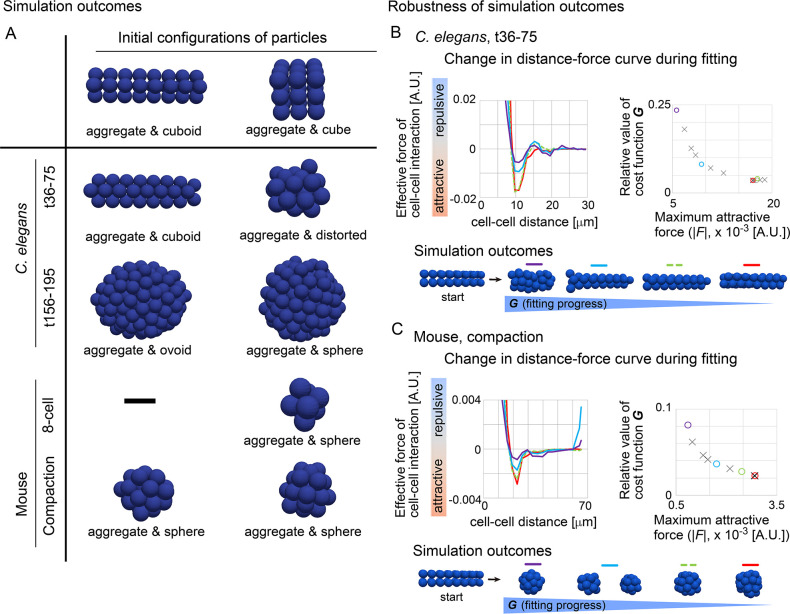
Mechanical forces are critical for the emergence of diverse three-dimensional morphologies of multicellular systems. However, it remains unclear what kind of mechanical parameters at cellular level substantially contribute to tissue morphologies. This is largely due to technical limitations of live measurements of cellular forces. Here we developed a framework for inferring and modeling mechanical forces of cell-cell interactions. First, by analogy to coarse-grained models in molecular and colloidal sciences, we approximated cells as particles, where mean forces (i.e. effective forces) of pairwise cell-cell interactions are considered. Then, the forces were statistically inferred by fitting the mathematical model to cell tracking data. This method was validated by using synthetic cell tracking data resembling various in vivo situations. Application of our method to the cells in the early embryos of mice and the nematode Caenorhabditis elegans revealed that cell-cell interaction forces can be written as a pairwise potential energy in a manner dependent on cell-cell distances. Importantly, the profiles of the pairwise potentials were quantitatively different among species and embryonic stages, and the quantitative differences correctly described the differences of their morphological features such as spherical vs. distorted cell aggregates, and tightly vs. non-tightly assembled aggregates. We conclude that the effective pairwise potential of cell-cell interactions is a live measurable parameter whose quantitative differences can be a parameter describing three-dimensional tissue morphologies.


Conflict of interest statement

The authors have declared that no competing interests exist.

Figures

Fig 1
Fig 1. Overview of strategy for inferring the effective potential of cell–cell interactions.
A. Relationship between microscopic forces and attractive/repulsive forces in isolated two cell systems. i) Microscopic forces are exemplified. ii) The microscopic forces are approximated as attractive/repulsive forces where cells are described as particles with the mean size. iii) Both the repulsive and attractive forces are provided as cell–cell distance–dependent functions, and the summation (black broken line) is the distance–force curve of the two particles. The relationship between the curve and the mean diameters of the cells is shown. iv) A distance–potential curve is shown where the mean diameters of cells correspond to the distance at the potential minimum. B. Strategy for inferring effective forces of cell–cell interactions. i) Particle model. A blue sphere corresponds to a cell. Attractive or repulsive force between the particles (blue spheres #1–4), was considered; vectors of cell–cell interaction forces (Fi) are illustrated by black arrows in the case of particle #3. The net force (FC|p) of particle #3 is shown by a red vector. The summation of Fi results in FC|p which determines the velocity (VC|p) of pth particle. ii) Nuclear tracking data were obtained and used as a reference data during the inference. iii) Effective forces of cell–cell interactions were inferred by fitting. Red line, attractive; blue line, repulsive. iv) From the inferred effective forces, we examined whether distance–force/potential curves are detected. Related figure: S1 Fig (inference method).
Fig 2
Fig 2. Validation of inference method using simulation data. Simulations were performed on the basis of a distance–force (DF) curve obtained from the Lenard–Jones potential (LJ).
The DF curve is shown in A–i. The simulation conditions contain “Assembling process” (A), “Steady state” (B), and “Cell proliferation” (C). For A–C, snapshots of the simulations are shown where the particles are of the mean size of cells (i). In A–ii, the procedure of data analyses is exemplified, where a colored heat map representing the frequencies of the data points (Frequency index (FI)). Averaged values of the forces are shown in yellow (binned average). In A–iii, B–ii, and C–ii, the resultant effective DF curves are shown with the DF curves from the LJ potential. Normalized L2 norms = {Finferred(D)–FLJ(D)}2 / (FLJ_max)2 were calculated along D, and then the mean values along D were calculated; FLJ_max is the maximum attractive force in the LJ potential, and the range of D was set that the absolute values of attractive forces at D are ≥ (0.1×|FLJ_max|). The normalize L2 norms are: in A–iii, 0.035 (0%), 0.034 (10%), 0.033 (100%), and 0.024 (1000%); in B–ii, 0.032 (1min), 0.046 (3min), and 0.15 (5min); in C–ii, 0.068 (1min), 0.035 (3min), and 0.095 (10min). Related figures: S2 and S3 Figs (in the case of other given potential and random walk).
Fig 3
Fig 3. Influence of external constraints to effective forces of cell–cell interaction.
Spherocylindrical constraints corresponding to eggshells are assumed in the particle model used in Fig 2 i) An example of simulations with labeling three cells (red, yellow, and green). For the condition of the spherocylindrical length = 16μm ("compressive”), the array of particles is marked by broken lines. ii) Inferred DF curves. The normalize L2 norms defined in Fig 2 are: 0.062 (40μm), 0.066 (30μm), 0.077 (25μm), 0.16 (20μm), and 0.29 (16μm). Related Figures: S4 (inference under spherical constraints) and S5 (inference in spherocylindrical constraints) Figs.
Fig 4
Fig 4. Inference of effective force of cell–cell interaction in C.elegans embryos.
A. Snapshot of the nuclear positions in the C.elegans embryo with cell lineages at time frame = 76. B. Mean diameters of cells at each time frame estimated from cell numbers. Given that the volume of the embryos is constant (= Vol) during embryogenesis, the mean diameters were estimated from the cell numbers (Nc) at each time frame as follows: mean diameter =[Vol/{(4/3)πNc}]1/3. The diameters relative to that at time frame = 16 are shown with cell numbers. The sizes of the circles reflect the diameters, whose colors roughly correspond to the colors in the graph in F. C. Snapshots with inferred effective forces with the force values described by colored lines at t = 16, 76, and 195. Forces are depicted in arbitrary units (A.U.); 1 A.U. of the force can move a particle at 1μm/min. The nuclear tracking data were obtained from a previous report [31]. D. Uniqueness of solution of effective force inference was examined. The minimizations of the cost function G were performed from different initial force values as described in the x–and y–axes, and the inferred values of each cell–cell interaction were plotted by crosses. E. The inferred effective forces of cell–cell interactions were plotted against the distance of cell–cell interactions with binned averages at t = 76–115. F. Inferred DF and DP curves at various time frames. G. DP curves normalized by the distances at the potential minima at various time frames. Related figure: S6 (uniqueness of solution was examined), S7 (the inferred DP curves were fitted by previously used frameworks such as the Morse potential), and S8 (inferred potentials under the relative velocity–based model) Figs. Related movies: S1 (tracking data) and S2 (force map) Movies.
Fig 5
Fig 5. Inference of the effective force of cell–cell interaction in mouse pre–implantation embryos.
A. Eight–cell and compaction stages of mouse embryo are illustrated, and their confocal microscopic images are shown: bright field, maximum intensity projection (MIP) and cross–section of fluorescence of H2B–EGFP. Snapshots of nuclear tracking are also shown; blue spheres indicate the detected nuclei. Scale bars = 15μm. B. Inferred DF and DP curves. Related figures: S9 (data from other embryos) and S10 (DF and DP curves in the outer and inner cells in the compaction stage) Figs. Related movies: S3, S4 (tracking data), S5 and S6 (force maps) Movies.
Fig 6
Fig 6. Outcomes of simulations based on inferred distance–force curves.
A. Simulations results under the DF curves derived from C. elegans and mouse embryos are exemplified. B and C. DF curves sampled before reaching the minima of G, and simulation outcomes. DF curves, left panels; the values of G and the maximum attractive forces in the DF curves, right panels; simulation outcomes for each DF curve with the initial configuration ("start”), bottom panels. The values of G are relative to that in the case of all forces = 0. The colors in each three panels in B and C correspond each other. In the right panels, the numbers of the data points are 14 and 12 in B and C, respectively, and the representative ones (colored circles) are selected for presenting the DF curves and the simulation outcomes.
Fig 7
Fig 7. Inference of effective potentials of cell–cell interaction in compaction–inhibited mouse embryos.
A. Microscopic images of embryos under chemicals. CytoD, cytochalasin D; Bleb, blebbistatin. B. Inferred DP curves in the drug–treated embryos. N = 6~10 for each condition. C. Quantitative differences in the DP curves. Distances at the potential minima in the DP curves, left panel; Distances providing 10% energy of the potential minima as the relative value to the distances at the potential minima, right panel. Mann–Whitney–Wilcoxon tests were performed and the resultant p–values for “No Drugs” vs. “EDTA”, vs. “CytoD”, and vs. “Bleb” are 0.011, 0.23, and 0.00040, respectively, in the left panel. In the right panel, distances providing other % energies instead of 10% are shown in S14B Fig. D. Confocal microscopic images of cell shapes. Cell shapes were visualized by staining F–actin or E–cadherin. E. The embryonic and cellular shapes illustrated based on D. Related figures: S11 (experimental design), S12 (enlarged view of DP curves), S13 (histological images of other embryos), and S14 (details of quantification of DP curves) Figs.
Fig 8
Fig 8. Simulations under inferred distance–potential curves in drug–treated embryos, and identification of parameters explaining morphological transition.
A. Simulation results for the drug–treated embryos. All simulation data are provided in S15A Fig, and the representative results which nearly showed the mean values of the sphericities for each condition are chosen here. B. Sphericities in the simulations of the drug–treated embryos (left panel), and the sphericities plotted against the distances at the potential minima calculated in Fig 7C. Mann–Whitney–Wilcoxon tests were performed: p–values for “No Drugs” vs. “EDTA”, vs. “CytoD”, and vs. “Bleb” are 0.011, 1.0, and 0.00080, respectively. C. Aspect ratios in simulations of the drug–treated embryos (left panel), and the aspect ratios plotted against the relative distances providing 10% energy of the potential minima calculated in Fig 7C. Mann–Whitney–Wilcoxon tests were performed: p–values for “No Drugs” vs. “EDTA”, vs. “CytoD”, and vs. “Bleb” are 0.21, 0.97, and 0.33, respectively. Related figures: S15 Fig (all simulation outcomes).

Similar articles

Cited by

References

    1. Steinberg MS. Differential adhesion in morphogenesis: a modern view. Curr Opin Genet Dev. 2007;17: 1281–286. doi: 10.1016/j.gde.2007.05.002 - DOI - PubMed
    1. Guillot C, Lecuit T. Mechanics of epithelial tissue homeostasis and morphogenesis. Science (80–). 2013;340: 1185–9. doi: 10.1126/science.1235249 - DOI - PubMed
    1. Fletcher AG, Osterfield M, Baker RE, Shvartsman SY. Vertex models of epithelial morphogenesis. Biophys J. 2014;106: 2291–2304. doi: 10.1016/j.bpj.2013.11.4498 - DOI - PMC - PubMed
    1. Maître J–L, Berthoumieux H, Krens SFG, Salbreux G, Jülicher F, Paluch E, et al.. Adhesion Functions in Cell Sorting by Mechanically Coupling the Cortices of Adhering Cells. Science (80–). 2012;338: 253–256. doi: 10.1126/science.1225399 - DOI - PubMed
    1. Bazellières E, Conte V, Elosegui–artola A, Serra–picamal X, Bintanel–morcillo M, Roca–cusachs P, et al.. Control of cell–cell forces and collective cell dynamics by the intercellular adhesome. Nat Cell Biol. 2015;17: 409–420. doi: 10.1038/ncb3135 - DOI - PMC - PubMed

Publication types