. 2023 Aug 7;18(8):e0289657.
doi: 10.1371/journal.pone.0289657. eCollection 2023.

Cross-frequency coupling between slow harmonics via the real brainstem oscillators: An in vivo animal study

Affiliations

Cross-frequency coupling between slow harmonics via the real brainstem oscillators: An in vivo animal study

Yoshinori Kawai. PLoS One. .

Abstract

Brain waves of discrete rhythms (gamma to delta frequency ranges) are ubiquitously recorded and interpreted with respect to probable corresponding specific functions. The most challenging idea of interpreting varied frequencies of brain waves has been postulated as a communication mechanism in which different neuronal assemblies use specific ranges of frequencies cooperatively. One promising candidate is cross-frequency coupling (CFC), in which some neuronal assemblies efficiently utilize the fastest gamma range brain waves as an information carrier (phase-amplitude CFC); however, phase-phase CFC via the slowest delta and theta waves has rarely been described to date. Moreover, CFC has rarely been reported in the animal brainstem including humans, which most likely utilizes the slowest waves (delta and theta ranges). Harmonic waves are characterized by the presence of a fundamental frequency with several overtones, multiples of the fundamental frequency. Rat brainstem waves seemed to consist of slow harmonics with different frequencies that could cooperatively produce a phase-phase CFC. Harmonic rhythms of different frequency ranges can cross-couple with each other to sustain robust and resilient consonance via real oscillators, notwithstanding any perturbations.


Conflict of interest statement

The authors have declared that no competing interests exist.

Figures

Fig 1
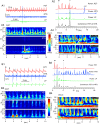
Fig 1. Peripheral cardiorespiratory rhythms detected non-invasively as bodily-vibrations.
A, PZT signals had two kinds of periodical peaks (closed and open circles), which corresponded to respiration and heartbeat cycles, respectively. B, Respiration is ranged ~0.5–2 Hz (delta range), while heart rate is ~ 4–8 Hz (theta range). The slope of heartbeat/respiration (r) was ~2. Under stable anesthesia, respiration was more than 1 Hz (blue circles). C, The ratios of heartbeat / respiration (~4–8). Under more stable anesthesia (blue circles), the values are small with smaller variance, while deeper or unstable anesthesia often resulted in slower respiration and large ratios (heartbeat / respiration) with larger variance (red circles). The values of heartbeat and respiration calculated from 10 sec epochs of PZT recordings. D, FFT (fast Fourier transform) based continuous wavelet transform (CWT) of 6 examples (#1- #6) of 10 sec epochs of PZT signals from the same individual’s recording of over ~2 hrs. Note regular continuous horizontal bands of strong power signals over delta frequency range (0.5–4 Hz) and vertical over theta range (4–8 Hz). E, FFT-based power spectra of #1–6 (10 sec epochs of recording) over delta (δ: ~0.5–4 Hz) and theta (θ: ~4–8 Hz) frequency ranges. Note fundamental (closed circles and underlined values) and overtone (x2–7) respiratory frequencies and fundamental cardiac frequencies (open circles and underlined values). Fundamental cardiac frequencies with red rectangles indicate a multiple relationship of cardiac / respiratory frequency ratios. Note that power of cardiac oscillations is much smaller than respiratory ones. F, Power spectra of peripheral cardiorespiratory rhythms (PZT) of 10-sec (colored) and 100-sec (black) epoch recordings. In shorter epochs of recordings (in color), oscillation powers seem to be conspicuous in delta and theta ranges as harmonic waves with no clear differentiations of respiration and heartbeat components. In contrast, oscillation powers analyzed with longer recordings emerge to differentiate into not only fundamental and overtone components but distinct respiration and heartbeat rhythms, indicating an existence of harmonic two different oscillators. The power peak of respiration oscillation resides in the second overtone (not fundamental) frequency. a.u.: arbitrary unit.
Fig 2
Fig 2. Central delta and theta rhythms recorded as multi-unit activities with glass electrodes.
A, A long-epoch multi-unit activity (MUA) recording of over 1000 sec by a glass electrode. B, Power spectra of 100 sec epochs (a–e; also, in A). Closed circles indicate fundamental frequencies of respiratory oscillation, all of which reside in delta (δ) frequency range (grey rectangle: δ), followed by several overtones extending beyond a delta range. Open circles indicate fundamental cardiac oscillations (grey rectangle: θ) and their overtones (x2, x3 of the fundamental frequencies). Note that height peaks of respiratory power often reside in the overtones. Vertical bars in B indicate relative powers with respect to a common arbitrary unit.
Fig 3
Fig 3. Coherence of peripheral cardiorespiratory and central delta-theta rhythms.
A, B, Two examples of theta and delta temporarily dominant coherence of oscillations (~10 sec epoch recordings), respectively, recorded simultaneously from the NTS (central) and peripheral PZT. A1 and B1, Simultaneous records of PZT (in red), NTS (in blue) and the low-pass filtered (LP in green) signals. Scale bars of the amplitude height apply only to NTS signals, others were arbitrarily scaled. A2 and B2, Power spectra of PZT, NTS, LP signals of ~10 sec epochs of records. Bottom; Coherence spectra between PZT vs NTS. The heights of power and coherence spectra are arbitrary. Closed and open circles in PZT indicate respiratory and cardiac rhythms, respectively (A1, A2, B1, and B2). The first overtone of cardiac oscillation frequency is indicated by an open circle followed by x2 (A2). A3 and B3, Time-resolved power spectra (continuous wavelet transform: CWT) of PZT, NTS, and LP signals of ~10 sec records. A4 and B4, Time-resolved coherence spectra (wavelet coherence: WCoh) between LP (NTS) and PZT signals of ~10 sec records. Coherence was conspicuous as robust horizontal bands ranging delta frequency (0.5–4 Hz) and vertical ranging theta and over (5–20 Hz). Note the interruption of delta horizontal robust coherence indicated by arrows (A3 and A4).
Fig 4
Fig 4. A long record of simultaneous peripheral cardiorespiratory and central rhythmic activities beyond a cessation of apparent oscillation.
A, Simultaneous records of seven 10-sec epochs (a–g) over 80 min of central (NTS) and peripheral (PZT) rhythms beyond an apparent cessation of oscillatory activity. Apparent respiratory and cardiac rhythmic activities (indicated by solid and open circles) are evident in PZT signals. B, Amplitudes (Amp) of the central and peripheral rhythmic activities. The record epochs for the central (NTS) and peripheral (PZT) activities (B1), and frequencies (Freq) of the PZT rhythms (B2) are shown. C, Simultaneous records of PZT (in grey) and NTS (in black) activities from 10-sec epochs ((a)–(g) in B1). A grey bar in B1 indicates a period of an apparent cessation of the peripheral rhythmic activity (PZT). Note distinct signal [up to several mV in (a)–(c)] and noise [up to ~100 μV in (a)–(f)] activities. A summation (d2) of PZT peak triggered NTS and PZT activities (a closed circle in d1) reveals small slow waves of NTS oscillation (an arrowhead) in accordance with the respiration rhythm. An apparent cessation of both PZT and NTS activities is noted in (g). The amplitudes (mV; mean ± standard deviation (SD) of the NTS signals were 0.28 ± 0.14 [n = 17, (a)], 0.86 ± 1.24 [n = 18 (b)], 0.07 ± 0.01 [n = 18 (c)], and 0.04 ± 0.01 [n = 16 (d)]. The amplitudes (V) of PZT signals were (Fig 4B) were 0.115 ± 0.012 (n = 18 (a)), 0.124 ± 0.027 [n = 18, (b)], 0.109 ± 0.009 [n = 18, (c)], and 0.075 ± 0.008 [n = 16, 8d)]. The respiration frequencies (Hz) of PZT were 0.76 ± 0.09 [n = 27, (a)], 0.65 ± 0.15 [n = 21, (b)], 0.89 ± 0.04 [n = 28, (c)], 0.58 ± 0.05 [n = 26, (d)] and 1.11 ± 0.45 [n = 33, (e)]. The cardiac frequencies (Hz) of PZT were 4.66 ± 0.21 [n = 36, (a)], 4.66 ± 0.29 [n = 35, (b)], 5.45 ± 0.22 [n = 36, (c)], and 5.12 ± 0.19 [n = 36, (d)]. The ratios of heartbeat to respiration were 6.13 (a), 7.17 (b), 6.12 (c), and 8.82 (d).
Fig 5
Fig 5. Time-resolved coherence between peripheral cardiorespiratory and central delta-theta rhythms.
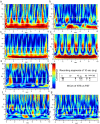
Time-resolved wavelet coherence (WCoh) analyses between PZT and NTS oscillations. Time series recording scheme of 7 epochs (each 10 sec duration; black bars designated by (a)–(g)) is shown with a grey bar indicating a period of an apparent cessation of the peripheral rhythmic activity. In each WCoh scalogram, two representative frequency range zones (delta δ and theta θ) are indicated by dotted white lines. Time-resolved coherence spectra (WCoh) between NTS and PZT signals reveal coherence is conspicuous as robust horizontal bands ranging delta frequency (0.5–4 Hz; δ) and vertical ranging theta and over (4–10 Hz; θ) in (a)–(d). Note an interruption of delta horizontal robust coherence signals in (b) and a complete discontinuation of robust coherence signals between delta and theta range in (d). With minor peripheral and central activities of a noise level, robust signals of delta and theta range and their CFC coherence almost disappear as shown in (f)–(g).
Fig 6
Fig 6. Time-resolved coherence between peripheral cardiorespiratory and central delta-theta rhythms during an apparent cessation of oscillatory activities.
A, Simultaneous records of peripheral and central oscillations (a 10-sec epoch PZT in red and NTS in blue) just before an apparent cessation of bodily oscillatory activity (Fig 4Ae, 4Cd1 and 4Cd2), with a digitally low-pass filtered signal (LP in green) of the NTS signal. Amplitudes of PZT and LP signals are arbitrary. Apparent respiratory and cardiac rhythmic activities are indicated by solid and open circles in PZT signals, respectively. The frequencies of respiratory (closed circles) and cardiac (open circles) rhythms are 0.58 ± 0.05 Hz (n = 26) and 5.12 ± 0.19 Hz (n = 36), respectively. B, The PZT peak (indicated by a closed circle) triggered signals of NTS and LP. A grey bar indicates a period of inspiratory phase of respiratory cycles. C, Power spectra (Power) of PZT, NTS, and LP signals, and a coherence spectrum (Coh) between NTS and PZT signals. Note that the cardiac or theta (θ) rhythms assume harmonics with fundamental frequency (indicated by an open circle) followed by overtones (indicated by x2 and x3), while respiratory or delta (δ) oscillations lack apparent harmonic components. D, Time-resolved power (continuous wavelet transform: indicated by PZT and LP) and coherent (wavelet coherence: WCoh) analyses of PZT and LP signals. Note that frequency-coupling between delta (δδ) and theta (θ) oscillations breaks irrespective apparent persistent strong signals of each frequency (WCoh).
Fig 7
Fig 7. Local field potentials of central delta-theta rhythms and the cross-frequency coupling.
A1, A long (~1 hr) record of local field potentials (LFPs) from a certain site of a simultaneous multi-site recording silicon electrode. A2, An amplitude of LFPs reaches several millivolts (mV) from the noise level activity of hundred μV. B, Three epochs of the records ((a)–(c) in A1) are arranged in tandem (with an arbitrary amplitude scale, B1) or in superimposition (B2). C1, Fast-Fourier transform power spectra of records (a)–(c). Delta (δ) rhythms with fundamental frequencies (x1) and overtones (x2, x3, x4…) are noted in (a)–(c). Theta (θ) rhythms are indicated by open circles (arrows, fundamental and overtones (x2, x3)) in records (a), but unnoticeable in (b) or (c). a.u., arbitrary unit with relative amplifications (1, 50, 100). A red line in (c) is an averaged spectrum. C2, Time-resolved power spectra (continuous wavelet transform, CWT) of records (a)–(c). Note moderate signals aligned horizontally and perpendicularly in delta and theta frequency ranges, respectively. Relative power scale (a)-(c) of arbitrary unit is applied to this set of CWT scalograms. D, A multiple-site silicon electrode for LFP recordings inserted in the NTS, the nucleus of the tractus solitarius in the dorsomedial medulla oblongata. ap, area postrema; cc, central canal; dmnX, dorsal motor nucleus of the vagus; Gr, gracilis nucleus; TS, the tractus solitarius; XII, hypoglossal nerve. A scale indicates a distance in μm. E, Time-resolved coherence spectrum (wavelet coherence, WCoh) between peripheral cardiorespiratory rhythms (PZT) and central delta-theta rhythms of LPFs shows robust coherence signals aligned horizontally in the delta (δ) frequency range, and perpendicularly in the theta (θ) range. The robust theta signals behave as a sinusoidal oscillation of ~ 1.5 Hz that corresponds with delta rhythm frequency. F, Time-resolved of coherence (WCoh) of LFPs ((a)–(c)) recorded simultaneously between two separate sites according to differences in their distance (nearest 50 μm vs most distant 350 μm) and signal amplitude (x1 ~ x100, B1(a)–(c)). Robust coherence is confirmed consistently between different recording sites [(a)–(c)] in the delta frequency range irrespective of signal amplitude, while the distribution of robust coherence varies to a large extent according to the distance of recording sites or signal amplitude. For example, frequency ranges of robust coherence far beyond the delta are recognized when the signal amplitude increases even between distant sites (c). Note that frequency ranges of robust coherence are restricted in the delta and theta range when signal amplitudes are relatively small, and that as signal amplitudes become larger frequency ranges of robust coherence become rather far wider (c).
Fig 8
Fig 8. Slow harmonics of peripheral and central oscillations, and their cooperative interaction through phase adaptions.
A, A summarized scheme illustrating power spectra of the harmonics generated by delta and theta oscillators. The harmonics are characterized by a presence of unique fundamental frequencies (closed and open circles in gray-shaded delta (δ) and theta (θ) frequency ranges) and their several overtones, multiples of each fundamental frequency (delta overtones in blue and theta ones in red). Robust powers of cardiorespiratory (PZT) and central (NTS) harmonics are seen with fairly specific patterns in delta (δ) and theta (θ) frequency ranges, respectively. Delta power is largest in the fundamental frequency (a closed circle in PZT), while theta power in the fundamental frequency (an open circle in NTS (MUA)). Note the largest power is often seen in the first overtone, not fundamental frequency in a case of LFP [NTS (LFP)]. Power scales apply to NTS MUA and LFP in arbitrary unit (a.u.). LFP, local field potential; MUA, multi-unit activity, PZT, piezoelectric transducer activity. B, The two oscillators (delta and theta, in blue and red, respectively) often stochastically form a relationship in which one delta overtone frequency coincides with the theta fundamental one (shorter record). Resonant harmonics ensue. The cooperative phase adaptation between the two oscillators could coordinate frequency of the harmonics (indicated by a double-headed curved arrow) to certain combinations of the multiple relationship (3:1 ~ 6:1) between the delta and theta fundamental frequencies.

Similar articles

Cited by

References

    1. Buzsaki G. Rhythms of the Brain. New York: Oxford University Press, Inc.; 2006.
    1. Coleman WM. On the correlation of the rate of heart beat, breathing, bodily movement and sensory stimuli. J Physiol. 1920;54(4):213–7. Epub 1920/12/07. doi: 10.1113/jphysiol.1920.sp001920 - DOI - PMC - PubMed
    1. Barman SM. 2019 Ludwig Lecture: Rhythms in sympathetic nerve activity are a key to understanding neural control of the cardiovascular system. Am J Physiol Regul Integr Comp Physiol. 2020;318(2):R191–r205. Epub 2019/10/31. doi: 10.1152/ajpregu.00298.2019 - DOI - PMC - PubMed
    1. Canolty RT, Knight RT. The functional role of cross-frequency coupling. Trends Cogn Sci. 2010;14:506–15. doi: 10.1016/j.tics.2010.09.001 . - DOI - PMC - PubMed
    1. Dhingra RR, Dick TE, Furuya WI, Galan RF, Dutschmann M. Volumetric mapping of the functional neuroanatomy of the respiratory network in the perfused brainstem preparation of rats. J Physiol. 2020;598(11):2061–79. Epub 2020/02/27. doi: 10.1113/JP279605 . - DOI - PubMed