. 2023 Aug 15;120(33):e2304394120.
doi: 10.1073/pnas.2304394120. Epub 2023 Aug 7.

Multitasking via baseline control in recurrent neural networks

Affiliations

Multitasking via baseline control in recurrent neural networks

Shun Ogawa et al. Proc Natl Acad Sci U S A. .

Abstract

Changes in behavioral state, such as arousal and movements, strongly affect neural activity in sensory areas, and can be modeled as long-range projections regulating the mean and variance of baseline input currents. What are the computational benefits of these baseline modulations? We investigate this question within a brain-inspired framework for reservoir computing, where we vary the quenched baseline inputs to a recurrent neural network with random couplings. We found that baseline modulations control the dynamical phase of the reservoir network, unlocking a vast repertoire of network phases. We uncovered a number of bistable phases exhibiting the simultaneous coexistence of fixed points and chaos, of two fixed points, and of weak and strong chaos. We identified several phenomena, including noise-driven enhancement of chaos and ergodicity breaking; neural hysteresis, whereby transitions across a phase boundary retain the memory of the preceding phase. In each bistable phase, the reservoir performs a different binary decision-making task. Fast switching between different tasks can be controlled by adjusting the baseline input mean and variance. Moreover, we found that the reservoir network achieves optimal memory performance at any first-order phase boundary. In summary, baseline control enables multitasking without any optimization of the network couplings, opening directions for brain-inspired artificial intelligence and providing an interpretation for the ubiquitously observed behavioral modulations of cortical activity.

Keywords: decision-making; mean field theory; multitasking; recurrent neural networks; reservoir computing.


Conflict of interest statement

The authors declare no competing interest.

Figures

Fig. 1.
Fig. 1.
Summary of main results. (A) Random neural network where the baseline input current bi to the i-th neuron is drawn from a normal distribution with mean and variance μ and σ2. (B) Network phase diagram for varying μ and σ2 shows four phases: fixed point (blue); chaos (cyan); bistable phase with coexistence of two fixed points (green); bistable phase with coexistence of fixed point and chaos (brown). (C) Neural hysteresis: Adiabatic changes in baseline variance σ(t)2 lead to discontinuous transitions crossing over phase boundaries, retaining memory of the previous phase (blue: network simulations; red: exact DMFT calculation; y-axis: mean activity M). (D) Optimal memory capacity is achieved by varying σ across a phase boundary where the largest Lyapunov exponent (LLE) crosses zero. (E) Baseline control of multitasking. The two bistable network phases (chaos/fixed-point and double fixed-point phases: brown and green, respectively; see B) can be harnessed by a reservoir network to perform two different tasks: a delayed two-alternative forced-choice task (2AFC) in the double FP phase and a delayed go/no-go task (G/NG) in the chaos/FP phase. Bottom: Six trials, alternating 2AFC and G/NG blocks (green and red lines represent task rule onset), where in each block, stimuli from two classes are presented (blue/cyan and orange/brown color-shaded intervals represent the two classes for each task). After a delay, the decision outcome is read out (dot-dashed lines; pink lines: representative activity of four neurons).
Fig. 2.
Fig. 2.
Baseline control of the network dynamical phase. (A) Random neural network where the baseline input current bi to the i-th neuron is drawn from a normal distribution N(μ,σ2) (red). (B) Left: Network phase diagram, obtained by varying the mean μ and variance σ2 of the baseline input, shows four phases: fixed point (blue); chaos (cyan); bistable phase with coexistence of two fixed points (green); bistable phase with coexistence of fixed point and chaos (brown). Top Right: Multicritical point. Bottom Right: Schematic of the Landau potential along a phase space trajectory (black arrow in Inset) from a stable phase with a single fixed point (blue circle), to a bistable phase with coexistence of fixed point and chaos (blue and cyan circles), to a stable phase with chaos (cyan circle). (C) Positive (Left) and negative (Right) largest Lyapunov exponents (in the bistable phases both LLE coexist); (D) Order parameters in each phase: Mean network activity (Top); autocorrelation (Middle); local stability (Bottom). Representative network activity in the different phases. Insets: Order parameters (Autocovariance C0,C and mean activity M). Network parameters: J0=0.5,g=5,θ0=1.
Fig. 3.
Fig. 3.
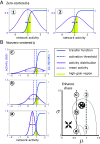
Noise-driven modulations of chaos. (A) When the transfer function input is zero-centered (i.e., the baseline mean μ equals the threshold θ0). The chaotic phase 1) occurs when a large fraction of the synaptic input distribution (pink curve) lies within the high gain region (yellow-shaded area, where ϕ(x)2O(1)) of the transfer function (blue curve). Increasing the input quenched variance 2) reduces this fraction, suppressing chaos. (B) When the transfer function is nonzero-centered (μ<θ0), for low (a) and high (c) quenched input variance network activity is at a fixed point because the high-gain region receives a small synaptic input fraction; this fraction is maximized at intermediate quenched input variance (b), enhancing chaos. Network parameters: g=5,θ0=1,J0=0. Panel A: ϕ(x)=tanh(xθ0),μ=1; cases (1, 2) σ=(0.1,0.6). Panel B: ϕ(x)=1/(1+exp(2g(xθ))=(1+tanh(g(xθ)))/2,μ=0.5; case (a, b, c): σ=(0.2,0.4,0.9).
Fig. 4.
Fig. 4.
Ergodicity breaking in the bistable phase. (A) Top: Representative trials from initial conditions leading to the fixed point (Right) or chaotic attractor (Left) within the bistable chaos/fixed point phase. Bottom: 10 representative trajectories of network activity in the same bistable phase starting from different initial conditions (five leading to the chaotic attractor, black circles; five leading to the fixed point, black crosses; only three initial conditions per phase are shown; dashed circles represent the positions of the chaotic and fixed point attractors, respectively). The first two principal components of the set of all trajectories (PCs) are shown. The activity in both examples is captured by the mean and variance as shown in Fig. 2D). (B) For increasing values of σ, a cross-over from a monostable fixed point phase (Left) to a bistable phase fixed point/chaos (Middle) to a monostable chaotic phase (Right) is revealed by the order parameters (LLE: largest Lyapunov exponent; M: mean activity; C: mean autocorrelation; 1S: 1-replica stability). In the bistable phase, the fixed point and chaotic branches exhibit different order parameters. (C) Average distance between replica trajectories <d> reveals ergodicity breaking: in the monostable fixed point (blue) and chaotic (cyan) phases <d> asymptotes to C, but in the bistable phase (brown) it asymptotes to a value larger than C, representing the average distance between the basins of attraction of the two branches. (D) Example of a cross-over from a monostable fixed point phase (blue), to a bistable phase fixed point/chaos (brown) to a bistable weak/strong chaos phase (red), to a monostable chaotic phase (cyan), as revealed by the order parameters (same as panel B). Neural hysteresis. (E) Slow changes in baseline variance σ(t) lead to discontinuous transitions in the network order parameters M,C (left: temporal profile of M,C,σ). (F) Crossing-over phase boundaries by a time-varying σ(t) retains memory of the previous phase (blue: network simulations; red: exact DMFT calculation). Network parameters: panel A: J0=0.5,θ0=1,μ=0.54,g=5,σ=0.1; panel B: J0=0.5,g=6,θ0=1,μ=0.5; panel C: same as Fig. (2B) and μ=0.5,0.6,0.7; panel D: J0=0.5,θ=1,μ=0.5,g=18; panels E and F: J0=0.5,g=12,θ0=1,μ=0.5,σ(t)=σ0+σ1sin(πt/T) with T=2048,σ0=0.17,σ1=0.025.
Fig. 5.
Fig. 5.
Baseline control of multitasking. (A) The two bistable network phases (chaos/fixed-point and double fixed-point phases: brown and green, respectively; same as Fig. 2B) can be harnessed by a reservoir network to perform two different tasks: a delayed two-alternative forced-choice task (2AFC) in the double FP phase and a delayed go/no-go task (G/NG) in the chaos/FP phase. (B) Top: Experimental design for two representative trials of the G/NG task: Task rules are implemented by sustained values of task-specific baseline μ,σ. Stimuli are represented by transient changes in baseline mean μ during a short sample epoch (100 ms). Following a delay epoch (200 ms), the network decision outcome is extracted via a linear readout z (the z-scored mean activity). Bottom: Neural mechanism of decision-making along the hysteresis loop (circles and letters mark time points in the two representative trials at the top, projected onto the plane with LLEs as functions of the momentary input baseline). (C) Representative session with eight trials, alternating 2AFC and G/NG blocks (green and red lines represent task rule onset). In each block, stimuli from two classes are presented (blue/cyan and orange/brown color-shaded intervals represent the two classes for each task). After a delay, the decision outcome is read out (dot-dashed lines). Top: Representative activity of four neurons. Bottom: Network readout reports the stimulus class in either task from network activity in 2AFC and G/NG tasks: Positive or negative readout values represent sR,sL or sG,sNG stimulus classes, respectively. An additional linear readout reports task rule from network activity (positive and negative values for G/NG and 2AFC tasks, respectively; linear discriminant between task rules). (D) Readouts during the task. (E) Baseline values during the task (see panel A for comparison). (F) Network activity mean and variance (see Fig. 2D for comparison). Network parameters as in Fig. 2.
Fig. 6.
Fig. 6.
Baseline control of optimal memory capacity. (A) Two representative trajectories in baseline (μ,σ) space (Left: green and orange lines) allow to reach a phase transition where the LLE crosses zero (Top) and memory capacity is optimized (Bottom). (B) In a transition between bistable phases, memory capacity is optimized by a baseline trajectory whose branch exhibits an LLE that crosses zero at the phase boundary (orange curve); the branch with positive LLE (blue curve) does not maximize memory capacity. Network parameters: Panel A, same as Fig. 2A; panel B, same as Fig. 4D.

Similar articles

Cited by

References

    1. McGinley M. J., et al. , Waking state: Rapid variations modulate neural and behavioral responses. Neuron 87, 1143–1161 (2015). - PMC - PubMed
    1. Mazzucato L., La Camera G., Fontanini A., Expectation-induced modulation of metastable activity underlies faster coding of sensory stimuli. Nat. Neurosci. 22, 787–796 (2019). - PMC - PubMed
    1. Niell C. M., Stryker M. P., Modulation of visual responses by behavioral state in mouse visual cortex. Neuron 65, 472–479 (2010). - PMC - PubMed
    1. Stringer C., et al. , Spontaneous behaviors drive multidimensional, brain-wide population activity. bioRxiv [Prerpint] (2018). 10.1101/306019 (Accessed 4 January 2023). - DOI
    1. Musall S., Kaufman M. T., Juavinett A. L., Gluf S., Churchland A. K., Single-trial neural dynamics are dominated by richly varied movements. bioRxiv [Preprint] (2019). 10.1101/308288 (Accessed 4 January 2023). - DOI - PMC - PubMed

Publication types

LinkOut - more resources