Review
. 2023 Aug 15;120(33):e2304663120.
doi: 10.1073/pnas.2304663120. Epub 2023 Aug 7.

Enumerating soil biodiversity

Affiliations
Review

Enumerating soil biodiversity

Mark A Anthony et al. Proc Natl Acad Sci U S A. .

Abstract

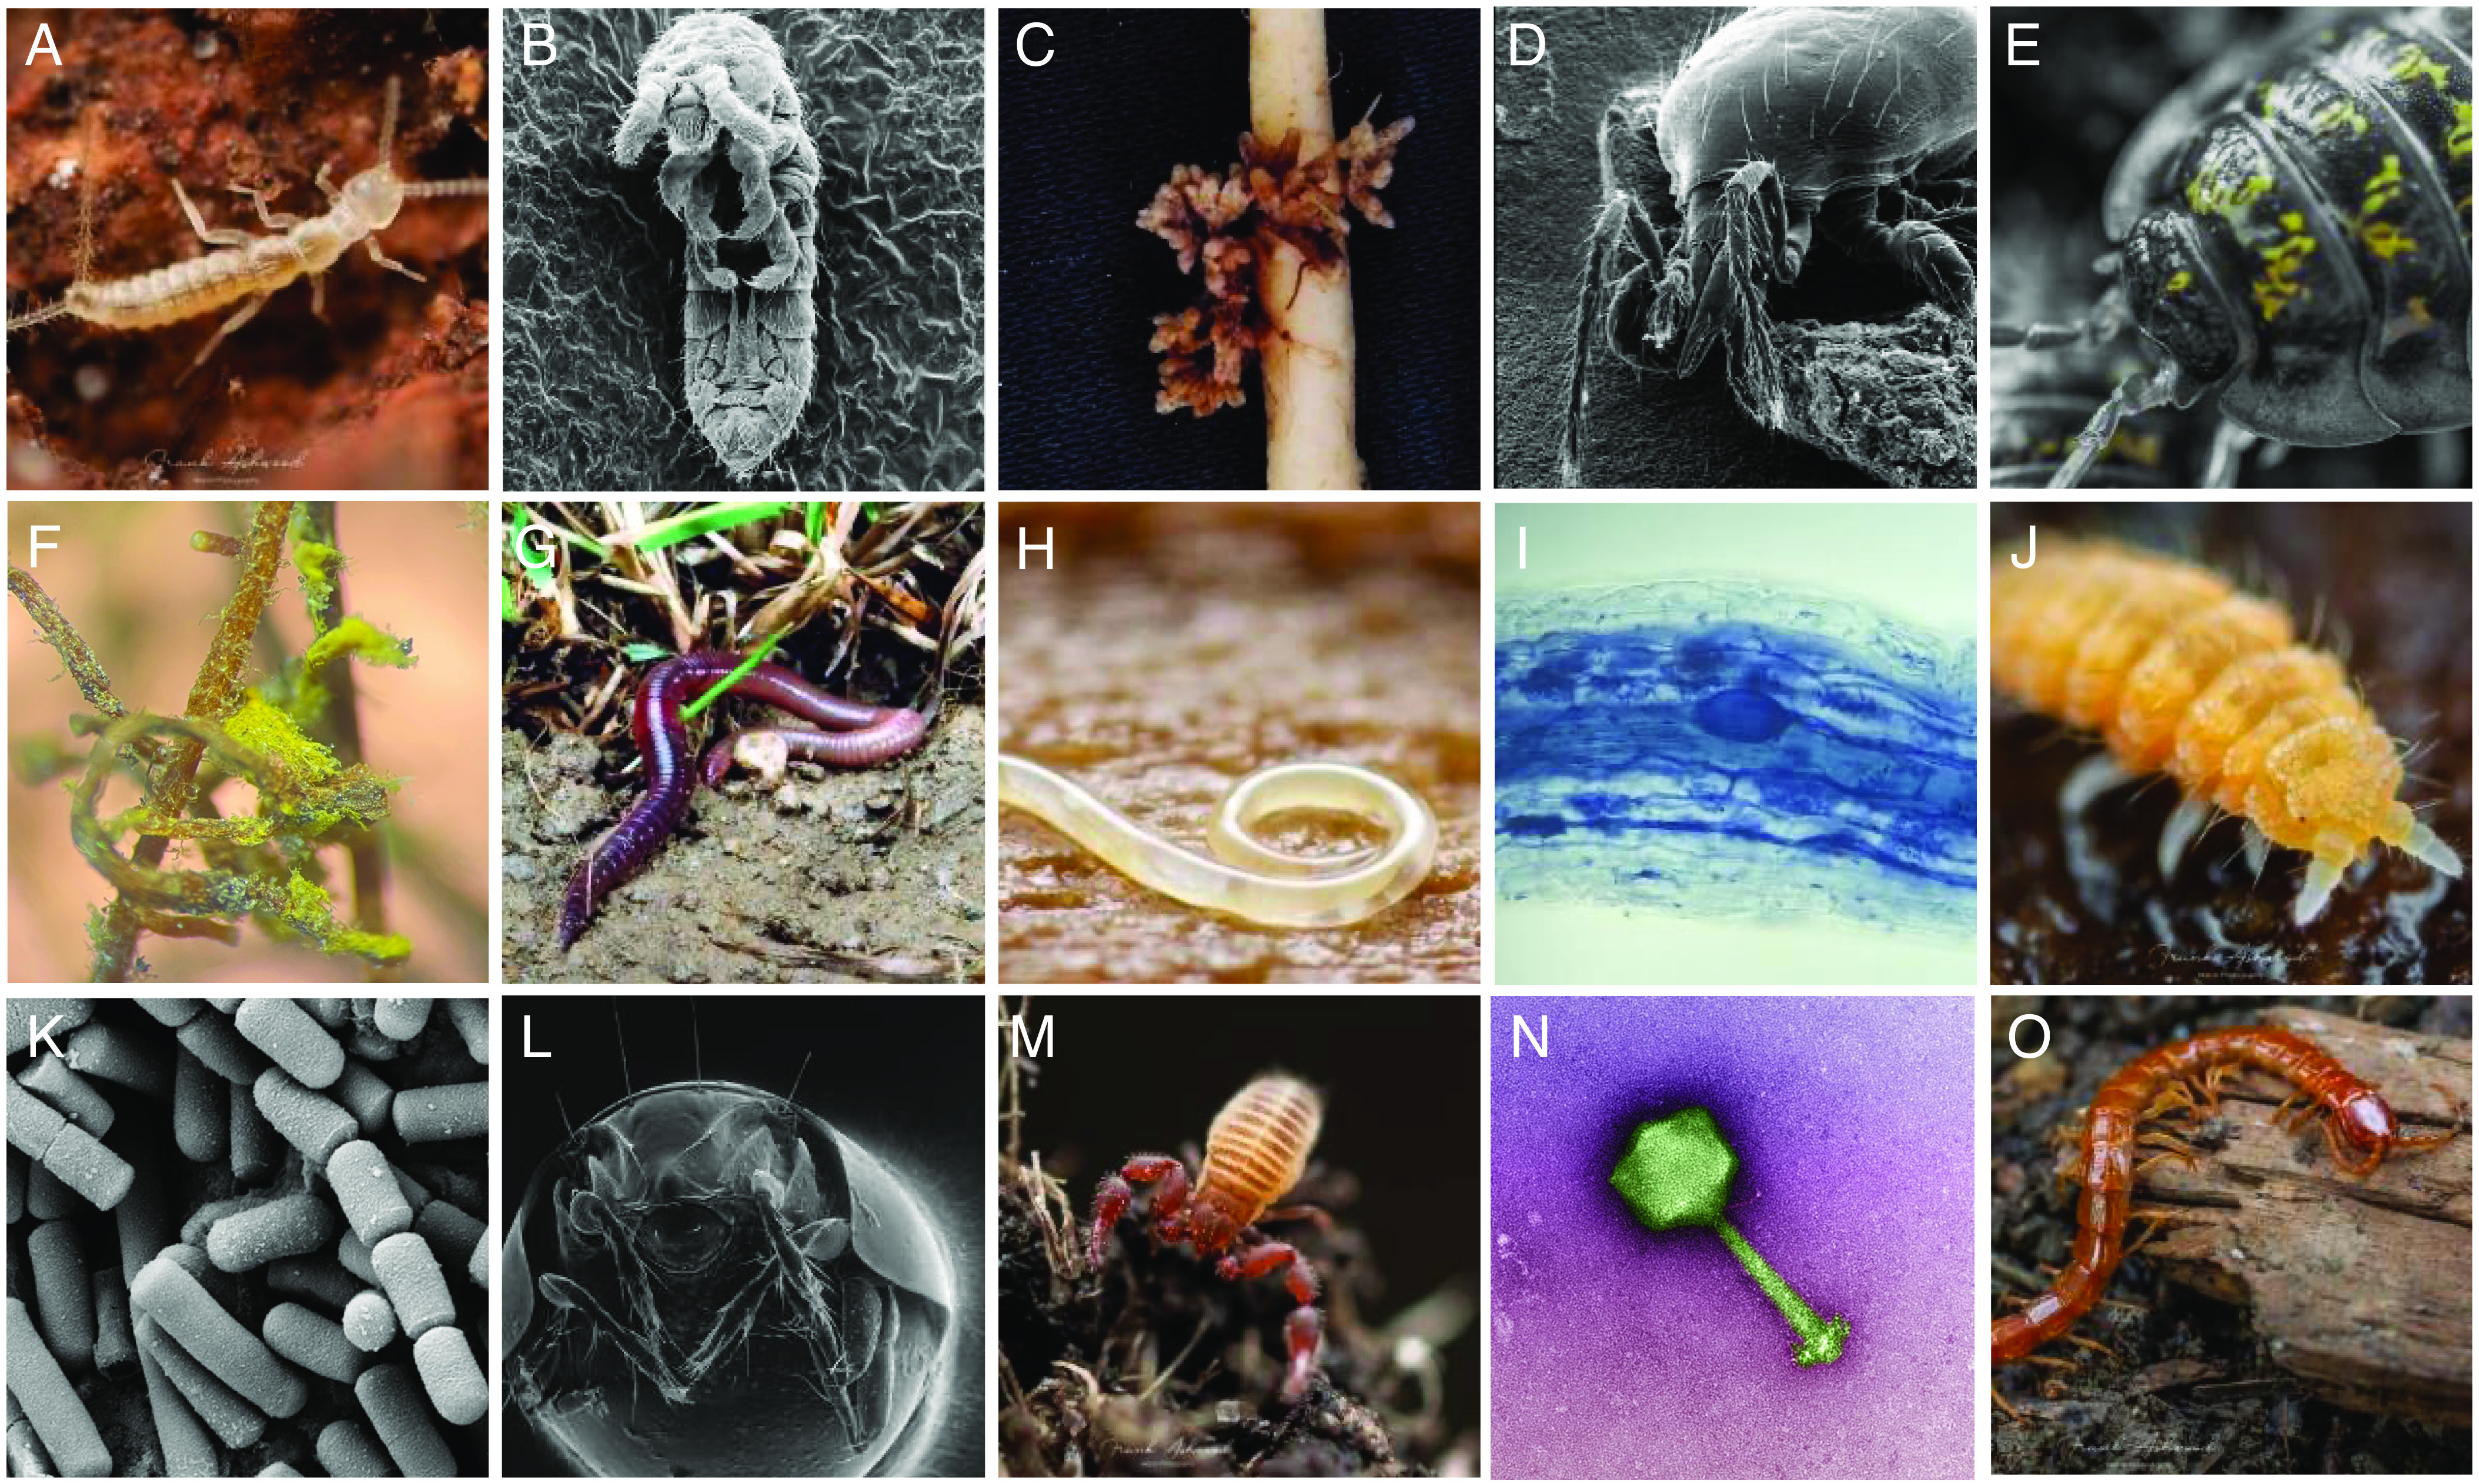
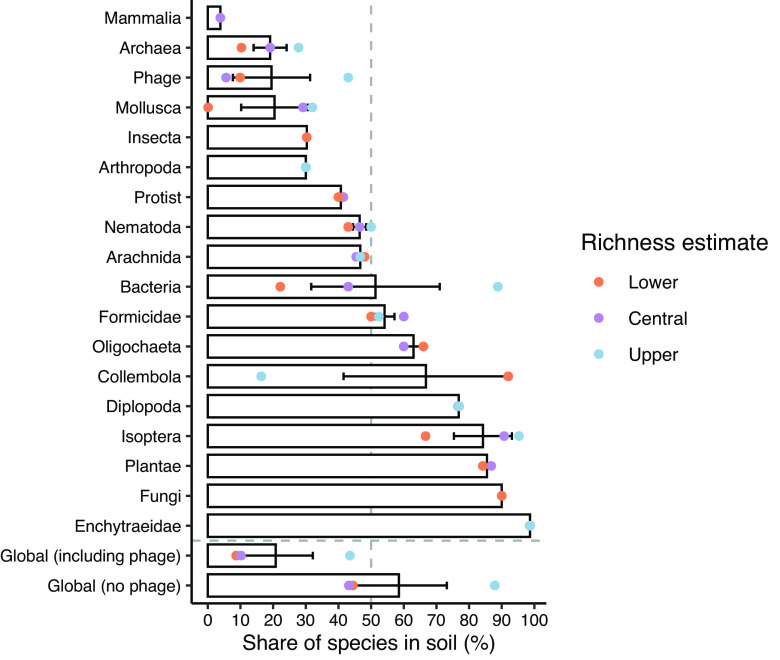
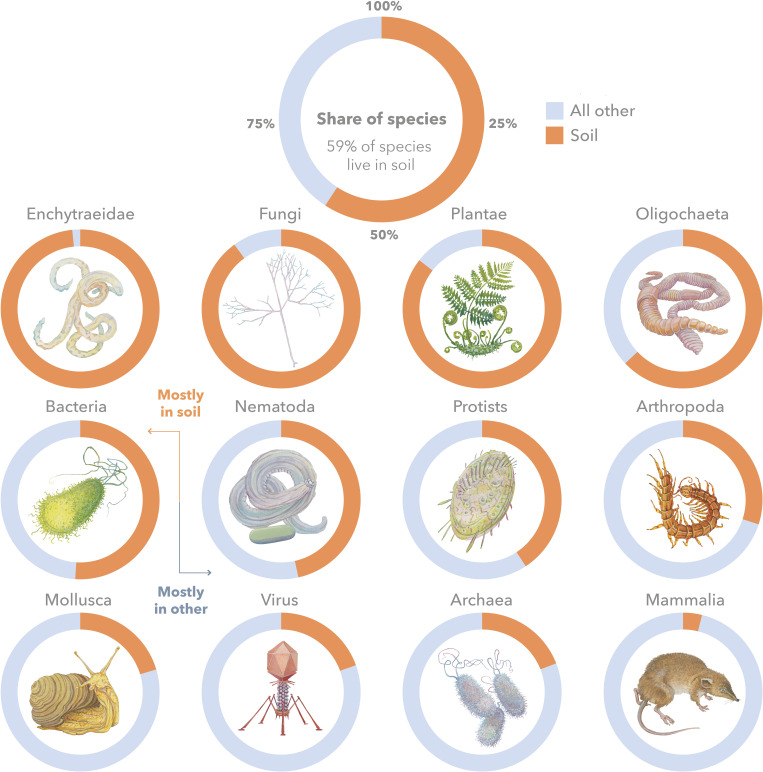
Soil is an immense habitat for diverse organisms across the tree of life, but just how many organisms live in soil is surprisingly unknown. Previous efforts to enumerate soil biodiversity consider only certain types of organisms (e.g., animals) or report values for diverse groups without partitioning species that live in soil versus other habitats. Here, we reviewed the biodiversity literature to show that soil is likely home to 59 ± 15% of the species on Earth. We therefore estimate an approximately two times greater soil biodiversity than previous estimates, and we include representatives from the simplest (microbial) to most complex (mammals) organisms. Enchytraeidae have the greatest percentage of species in soil (98.6%), followed by fungi (90%), Plantae (85.5%), and Isoptera (84.2%). Our results demonstrate that soil is the most biodiverse singular habitat. By using this estimate of soil biodiversity, we can more accurately and quantitatively advocate for soil organismal conservation and restoration as a central goal of the Anthropocene.

Keywords: biodiversity; diversity; soil biodiversity; soil diversity.


Conflict of interest statement

The authors declare no competing interest.

Figures

Fig. 1.
Fig. 1.
Diversity of the major life forms found in soil. (A) bristletail (© F. Ashwood), (B) springtail (© H. Conrad), (C) nitrogen-fixing bacteria-containing nodules on clover root (© M. van der Heijden), (D) predatory mite (© H. Conrad), (E) isopod (© F. Ashwood), (F) scots pine root colonized by ectomycorrhizal fungi (yellow) (© M. Anthony), (G) earthworm (© G. Brändle), (H) nematode (© A. Murray), (I) corn root colonized by arbuscular mycorrhizal fungi (blue) (© F. Bender), (J) springtail (© F. Ashwood), (K) a common soil bacterium Bacillus (Creative Commons Attribution-Share license, photo by M. Das Murtey and P. Ramasamy), (L) horned mite (© H. Conrad), (M), pseudoscorpion (© F. Ashwood), (N) phage infecting a soil bacterium (© T. de Carvalho), (O) centipede (© F. Ashwood).
Fig. 2.
Fig. 2.
Percentages of different groups of life on Earth that live in soil. Species that live in, on, or complete part of their life cycle in soil were classified as “species in soil”. The global percent of species in soil, including or excluding phage, summarized across all groups is also shown. Bars represent the mean and error bars are plus or minus one SE (where >1 prediction was available) of the lower, central, and upper estimates (e.g., for bacteria, we estimate 22.2, 43, and 88.8% for the lower, central, and upper estimates, respectively, for an average of 51 ± 20%). Note that some groups do not have a lower, central, and upper species richness estimate (e.g., Mammalia; see Table 1), and there are no error bars for these groups. See Table 1 for an estimate of the total number of taxa on Earth and those living in soil for each taxonomic group as well as our confidence in each prediction.
Fig. 3.
Fig. 3.
Graphical overview of the share of species living in soil. Doughnuts reflect the percentage of species in soil versus all other ecosystems combined (e.g., marine, freshwater, built environment, host organisms such as humans). The larger doughnut on top shows the total share of species, and smaller doughnuts show individual shares for the most speciose and well-known groups ordered from greatest to least specialized in soil. Illustrations by Michael Dandley ©.

Comment in

  • The hidden majority in soil.
    Bardgett RD. Bardgett RD. Proc Natl Acad Sci U S A. 2023 Sep 12;120(37):e2312358120. doi: 10.1073/pnas.2312358120. Epub 2023 Aug 30. Proc Natl Acad Sci U S A. 2023. PMID: 37647365 Free PMC article. No abstract available.

References

    1. Elewa A. M., “Mass extinction-a general view” in Mass Extinction (Springer, 2008), pp. 1–4.
    1. Wake D. B., Vredenburg V. T., Are we in the midst of the sixth mass extinction? A view from the world of amphibians Proc. Natl. Acad. Sci. U.S.A. 105, 11466–11473 (2008). - PMC - PubMed
    1. Wilcove D. S., Rothstein D., Dubow J., Phillips A., Losos E., Quantifying threats to imperiled species in the United States: Assessing the relative importance of habitat destruction, alien species, pollution, overexploitation, and disease. BioScience 48, 607–615 (1998).
    1. Gurevitch J., Padilla D. K., Are invasive species a major cause of extinctions? Trends Ecol. Evol. 19, 470–474 (2004). - PubMed
    1. Bardgett R. D., van der Putten W. H., Belowground biodiversity and ecosystem functioning. Nature 515, 505–511 (2014). - PubMed

Publication types

LinkOut - more resources