. 2023 Aug 15;120(33):e2303809120.
doi: 10.1073/pnas.2303809120. Epub 2023 Aug 7.

Astrocyte-targeting therapy rescues cognitive impairment caused by neuroinflammation via the Nrf2 pathway

Affiliations

Astrocyte-targeting therapy rescues cognitive impairment caused by neuroinflammation via the Nrf2 pathway

Akiko Nakano-Kobayashi et al. Proc Natl Acad Sci U S A. .

Abstract

Neuroinflammation is a common feature of neurodegenerative disorders such as Alzheimer's disease (AD). Neuroinflammation is induced by dysregulated glial activation, and astrocytes, the most abundant glial cells, become reactive upon neuroinflammatory cytokines released from microglia and actively contribute to neuronal loss. Therefore, blocking reactive astrocyte functions is a viable strategy to manage neurodegenerative disorders. However, factors or therapeutics directly regulating astrocyte subtypes remain unexplored. Here, we identified transcription factor NF-E2-related factor 2 (Nrf2) as a therapeutic target in neurotoxic reactive astrocytes upon neuroinflammation. We found that the absence of Nrf2 promoted the activation of reactive astrocytes in the brain tissue samples obtained from AD model 5xFAD mice, whereas enhanced Nrf2 expression blocked the induction of reactive astrocyte gene expression by counteracting NF-κB subunit p65 recruitment. Neuroinflammatory astrocytes robustly up-regulated genes associated with type I interferon and the antigen-presenting pathway, which were suppressed by Nrf2 pathway activation. Moreover, impaired cognitive behaviors observed in AD mice were rescued upon ALGERNON2 treatment, which potentiated the Nrf2 pathway and reduced the induction of neurotoxic reactive astrocytes. Thus, we highlight the potential of astrocyte-targeting therapy by promoting the Nrf2 pathway signaling for neuroinflammation-triggered neurodegeneration.

Keywords: Nrf2; neuroinflammation; neurotoxic reactive astrocytes.


Conflict of interest statement

The authors declare no competing interest.

Figures
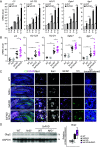
Fig. 1.
Fig. 1.
Neurotoxic reactive astrocytes in 5xFAD AD mouse model. (A) mRNA levels of reactive astrocyte marker genes in the hippocampal tissue samples of 5xFAD mice at 3, 6, 9, and 12 mo of age and corresponding WT mice. Two-month-old mice served as control. N = 3 for WT, N = 3 for 5xFAD at 3-mo-old, and N = 6 for 6-, 9-, and 12-mo-old 5xFAD mice. Error bars indicate SEM. ***P < 0.001 (compared between corresponding age groups, Student’s t test). (B) Quantification of mRNA expression of neurotoxic reactive astrocyte marker genes in the hippocampal-tissue samples of 5xFAD/Nrf2 KO mice. Age: 8-mo-old; WT: N = 7; Nrf2KO: N = 7; 5xFAD: N = 11; 5xFAD/Nrf2KO: N = 14. *P < 0.05, **P < 0.01, ***P < 0.001, and +P < 0.1 (Tukey–Kramer multiple comparison test). Error bars indicate SEM. (C) Representative images of the hippocampal-tissue samples of 5xFAD/Nrf2 KO. The regions indicated with white squares in the subiculum are enlarged on the Right. To visualize the fluorescent intensity, C3 staining is shown in pseudocolored on the Right side. (Scale bars: 400 µm and 20 µm.) (D) Western blotting analysis of hippocampal tissue samples using the indicated antibodies. Tissues from three animals were analyzed for each genotype. The box plots on the Right indicate the protein expression levels.
Fig. 2.
Fig. 2.
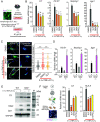
Nrf2 regulates gene expression of reactive astrocytes. (A) Experimental scheme: Primary astrocytes were isolated and stimulated with Il-1α/TNFα/C1q, followed by gene expression analysis using RT-qPCR or immunofluorescence. A representative image of cultures is shown on the Left. (Scale bar, 50 µm.) (B) Quantification of the relative mRNA level of each gene in astrocytes stimulated with Il-1α/TNFα/C1q and DMSO or Nrf2-inducing compounds for 4 h. *P < 0.05 and ****P < 0.0001 compared to unstimulated control; #P < 0.05 and ##P < 0.01 compared to stimulated/DMSO-treated control (Tukey–Kramer multiple comparison test). Error bars indicate SEM. (C, Left) Representative images of primary astrocytes stained with anti-C3 and anti-GFAP antibodies. Right panel: pseudocolored C3 to visualize the intensity of C3 protein expression. (Scale bar, 10 µm.) The quantitative box plots are shown on the Right. ***P < 0.001. (D) Quantification of the relative mRNA level of each gene expression in astrocytes prepared from WT or Nrf2 KO (−/−) mice, stimulated with IL-1α/TNF-α/C1q for 4 h. *P < 0.05 and ***P < 0.001 versus unstimulated control in each genotype; #P < 0.05 and ##P < 0.01 versus the stimulated WT control (Tukey–Kramer multiple comparison test). Error bars stand for SEM. (E) Western blot analysis of protein isolated from astrocytes prepared from WT or Nrf2−/− mice after Il-1α/TNFα/C1q stimulation for 24 h. The protein size marker is indicated on the Right. The bands corresponding to full-length C3 are marked with an asterisk (*). The bands at 110 kDa and at 70 kDa correspond to α chain of C3 and iC3b, respectively. (F, Left) Experimental scheme. Astrocyte cultures were generated for assays from human iPSCs. A representative image stained with astrocyte markers S100β and GFAP is shown. (Scale bar, 100 µm.) Right: Quantification of the relative mRNA level of each gene in human iPSCs-derived astrocytes stimulated with Il-1α/TNFα/C1q and indicated Nrf2-inducing compounds for 24 h. *P < 0.05 and ***P < 0.001 versus unstimulated control; ##P < 0.01 and ###P < 0.001 compared to stimulated/DMSO-treated control (Tukey–Kramer multiple comparison test). Error bars indicate SEM.
Fig. 3.
Fig. 3.
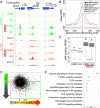
Nrf2 counteracts the NF-κB pathway and regulates the conversion of reactive astrocytes. (A) ChIP-seq profiles at the TSS site of indicated genes. Exons are shown as navy-blue squares, and box arrows represent the direction of transcription. inflamm stands for Il-1α/TNFα/C1q stimulation. (B) Aggregate plots of indicated peaks at the p65 binding motif. (C) The box plots of p65-binding peaks at regions where p65 peaks overlapped with enhancers (H3K27Ac+) in each condition. *P < 0.05. (D) The scatter plot of the common peaks of p65 and Nrf2 binding based on “binding ratio” calculated as SLF.inflamm over DMSO.inflamm and SLF.inflamm over SLF.NT, respectively. Red lines indicate zero. The genes surrounded with a green square were used for Fig. 3E. (E) GO analysis of the genes with p65-binding ratio less than zero and Nrf2-binding ratio more than 0.8 (a green square in Fig. 3D).
Fig. 4.
Fig. 4.
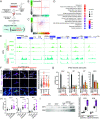
Gene expression profiles in neuroinflammatory astrocytes. (A) Experimental scheme: Nascent transcripts in stimulated astrocytes were labeled with EU during the stimulation with Il-1α/TNFα/C1q (inflammatory stimuli, inflamm), followed by pulled-down and seq. The nascent RNA ratio was calculated based on the RPKM value under the SLF.inflamm condition compared to those under the DMSO.inflamm condition. (B) Nascent RNA ratio was plotted based on the p65-binding ratio (Fig. 3D). Down- and up-regulated genes in the top five percentiles are colored in red and in blue, respectively. Red lines indicate zero. (C) Scatter plot comparing Nrf2- and p65-binding ratio (Fig. 3D) was replotted with color indication of five percentiles determined using the nascent RNA ratio. Red lines indicate zero. (D) KEGG pathway analysis of the five percentile genes less transcribed under the SLF.inflamm condition (indicated in red color) compared to those under the DMSO.inflamm condition. (E) Examples of the profiles of p65 ChIP-seq and nascent RNA-seq of less transcribed genes under the SLF.inflamm condition. Exons are shown as navy-blue squares, and box arrows represent the direction of transcription. inflamm stands for Il-1α/TNFα/C1q stimulation. (F) Representative images of astrocytes stained with anti-PKR and anti-GFAP antibodies. The Bottom panels show pseudocolored PKR. (Scale bar = 50 μm.) Quantification of the signal intensity of PKR fluorescence in astrocytes is shown on the Right. (G) Quantification of indicated mRNA expression in iPSC-derived astrocytes. ***P < 0.001, ****P < 0.0001, ***P < 0.001 (compared to the unstimulated condition), ##P < 0.01, ###P < 0.001, and ####P < 0.0001 (compared to the stimulated control) (Tukey–Kramer multiple comparison test) Error bars indicate SEM. (H) Quantification of the mRNA level in the hippocampal tissues of indicated mice. WT; N = 7, KO; N = 7, 5xFAD; N = 11, 5xFAD/KO; N = 14. Error bars indicate SEM. +P < 0.1 (Tukey–Kramer multiple comparison test). (I) Western blot analysis (re-probed from Fig. 1D) using the indicated antibodies in the hippocampal tissues of indicated animals. The box plots on the right indicate the protein expression levels.
Fig. 5.
Fig. 5.
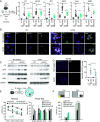
Potentiating the Nrf2 pathway can suppress the neuroinflammation-triggered neurotoxic astrocytes and relieve impaired brain function in AD mouse model. (A, Left) Experimental scheme; 5xFAD mice were orally administered ALG2 daily since the age of 3 mo. Behavioral tests were performed at the age of 8 mo, followed by biochemical and pathological assessment. Right: Quantification of gene expression in the hippocampal tissues of ALG2-administered mice. Error bars indicate SEM. *P < 0.05, ** P < 0.01, ***P < 0.001, and ***P < 0.0001 (Tukey–Kramer multiple comparison test) Age: 10 mo; NT-WT: N = 10, NT-5xFAD: N = 12, ALG2-WT: N = 12, ALG2-5xFAD: N = 19. (B) Representative images of the hippocampal tissues from 5xFAD mice with or without ALG2-treatment. (Scale bar, 20 μm.) (C) Hippocampal tissues were subjected to western blot analysis using the indicated antibodies. Box plots at right indicate the quantification of the band intensities. (D, Left) Representative images of the subiculum from 5xFAD mice treated with or without ALG2. (Scale bar, 100 μm.) Right: Evaluation of the number of FJC puncta in the subiculum area. ***P < 0.001, ***P < 0.0001, and +P = 0.10 (Tukey–Kramer multiple comparison test). (E, Upper) Experimental scheme for the Morris water test. Lower: The latency to reach the goal was assessed from the training session. The probe test was performed for 60 s without a goal, and the time to stay in the quadrant containing the goal was measured. (F, Upper) Experimental scheme of the passive avoidance test. Day 1: mice underwent the foot shock when they entered the dark room. Day 2: the time to enter the dark room was measured. Lower: Evaluation of latency to enter the dark room. *P < 0.01 and ***P < 0.001.
Fig. 6.
Fig. 6.
Mode of action of astrocyte-targeting therapy. Top: In neuroinflammatory conditions such as neurodegenerative disorders, cytokines released from activated microglia induce neurotoxic reactive astrocytes via NF-κB, resulting in impaired brain functions. Bottom: Treatment with ALGERNON2 can suppress reactive astrocyte conversion through Nrf2 potentiation, leading to rescued cognitive impairment in 5xFAD mice.

References

    1. Sofroniew M. V., Astrocyte reactivity: Subtypes, states, and functions in CNS innate immunity. Trends Immunol. 41, 758–770 (2020). - PMC - PubMed
    1. Liddelow S. A., et al. , Neurotoxic reactive astrocytes are induced by activated microglia. Nature 541, 481–487 (2017). - PMC - PubMed
    1. Guttenplan K. A., et al. , Knockout of reactive astrocyte activating factors slows disease progression in an ALS mouse model. Nat. Commun. 11, 3753 (2020). - PMC - PubMed
    1. Yun S. P., et al. , Block of A1 astrocyte conversion by microglia is neuroprotective in models of Parkinson’s disease. Nat. Med. 24, 931–938 (2018). - PMC - PubMed
    1. Park J. S., et al. , Blocking microglial activation of reactive astrocytes is neuroprotective in models of Alzheimer’s disease. Acta Neuropathol. Commun. 9, 78 (2021). - PMC - PubMed

Publication types