. 2023 Oct:52:203-218.
doi: 10.1016/j.jare.2023.08.003. Epub 2023 Aug 5.

Auricularia auricula polysaccharides attenuate obesity in mice through gut commensal Papillibacter cinnamivorans

Affiliations

Auricularia auricula polysaccharides attenuate obesity in mice through gut commensal Papillibacter cinnamivorans

Xin Zong et al. J Adv Res. 2023 Oct.

Abstract

Introduction: Auricularia auricula is a well-known traditional edible and medical fungus with high nutritional and pharmacological values, as well as metabolic and immunoregulatory properties. Nondigestible fermentable polysaccharides are identified as primary bioactive constituents of Auricularia auricula extracts. However, the exact mechanisms underlying the effects of Auricularia auricula polysaccharides (AAP) on obesity and related metabolic endpoints, including the role of the gut microbiota, remain insufficiently understood.

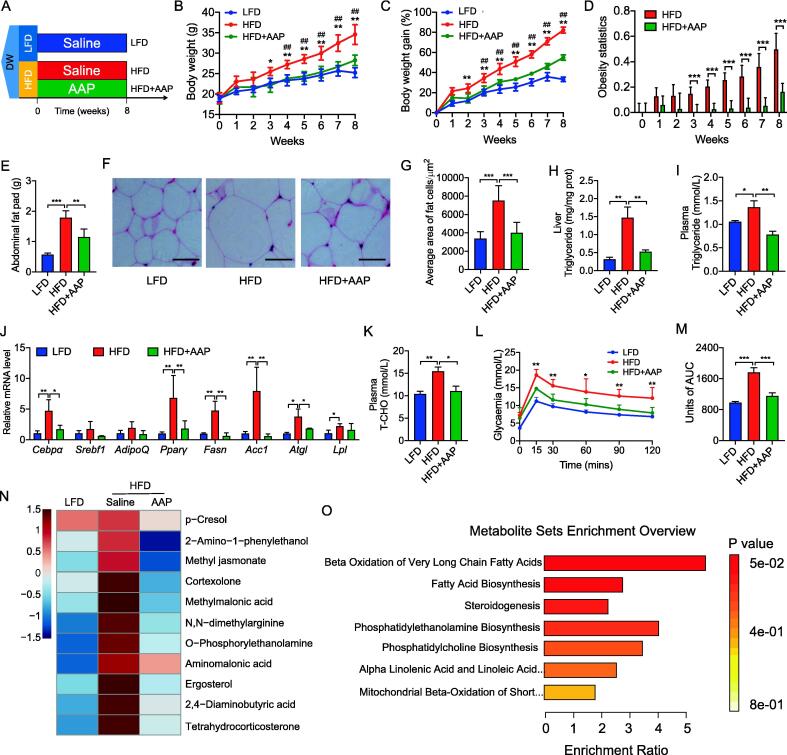
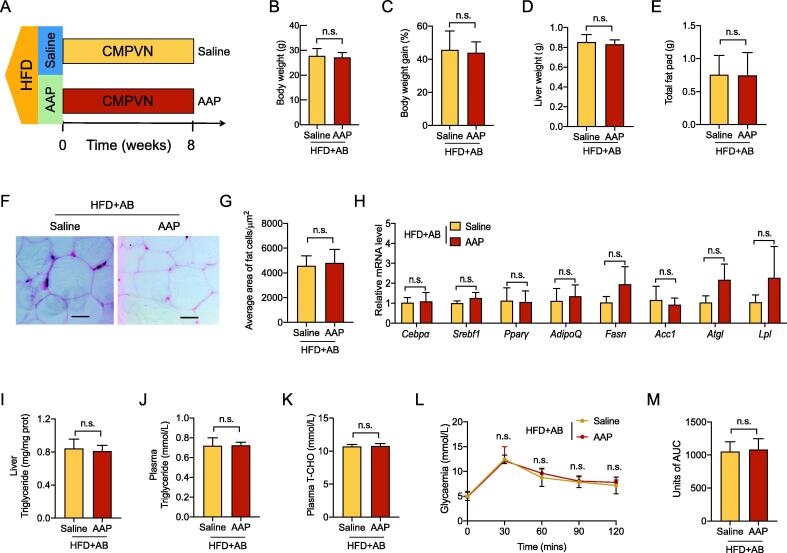
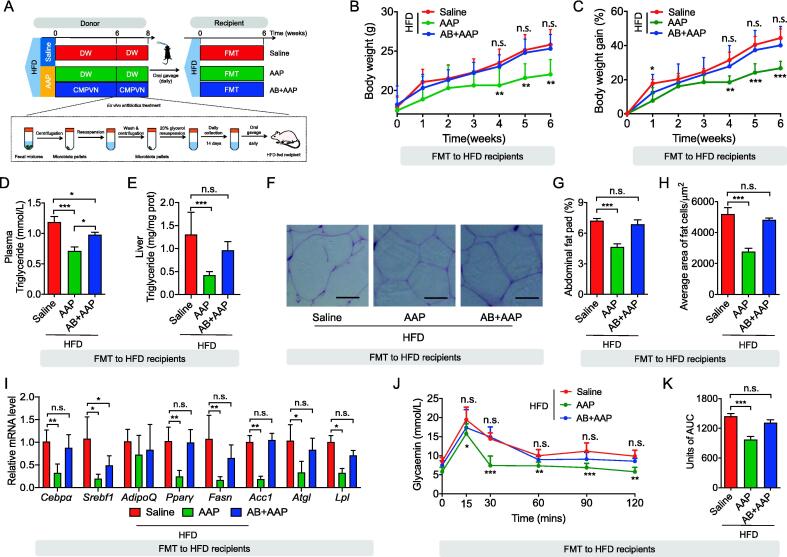
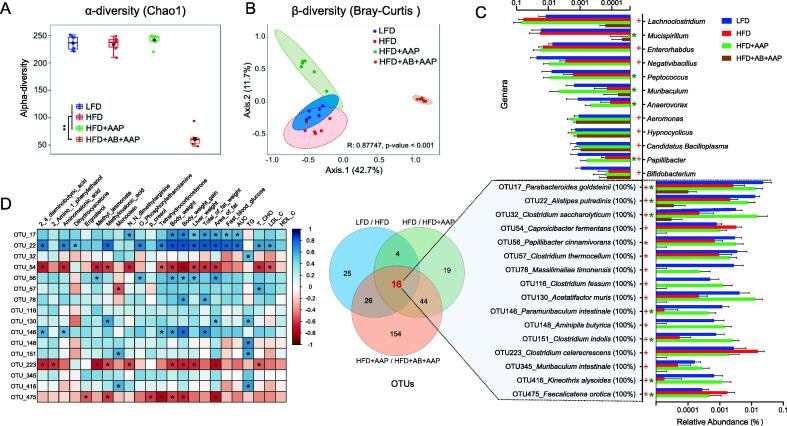
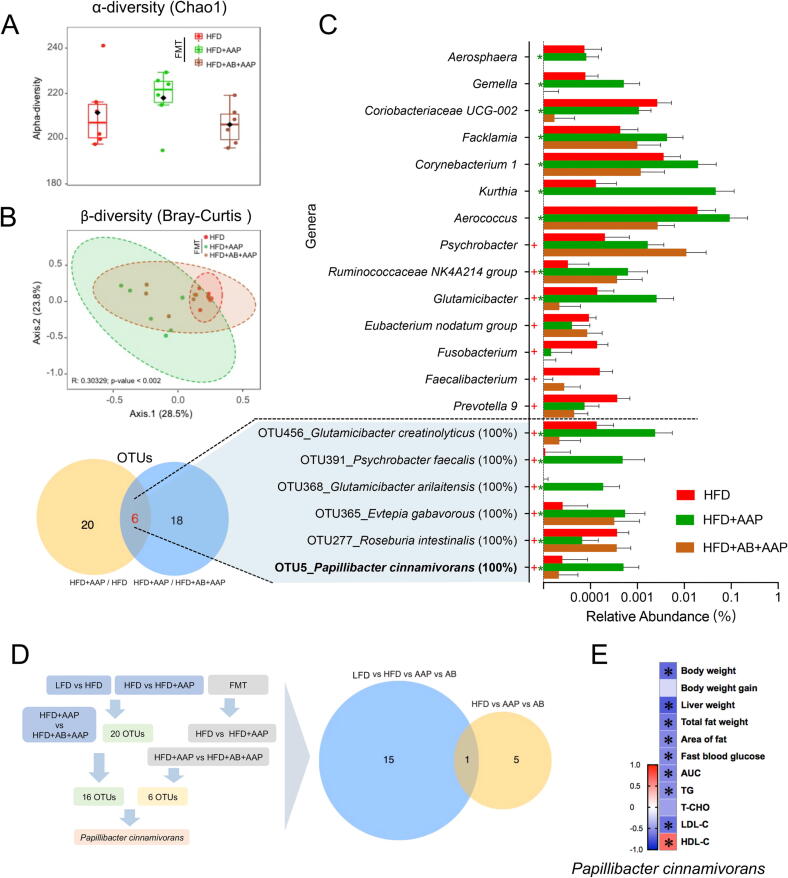
Methods: The effects of AAP on obesity were assessed within high-fat diet (HFD)-based mice through obesity trait analysis and metabolomic profiling. To determine the mechanistic role of the gut microbiota in observed anti-obesogenic effects AAP, faecal microbiota transplantation (FMT) and pseudo-germ-free mice model treated with antibiotics were also applied, together with 16S rRNA genomic-derived taxonomic profiling.

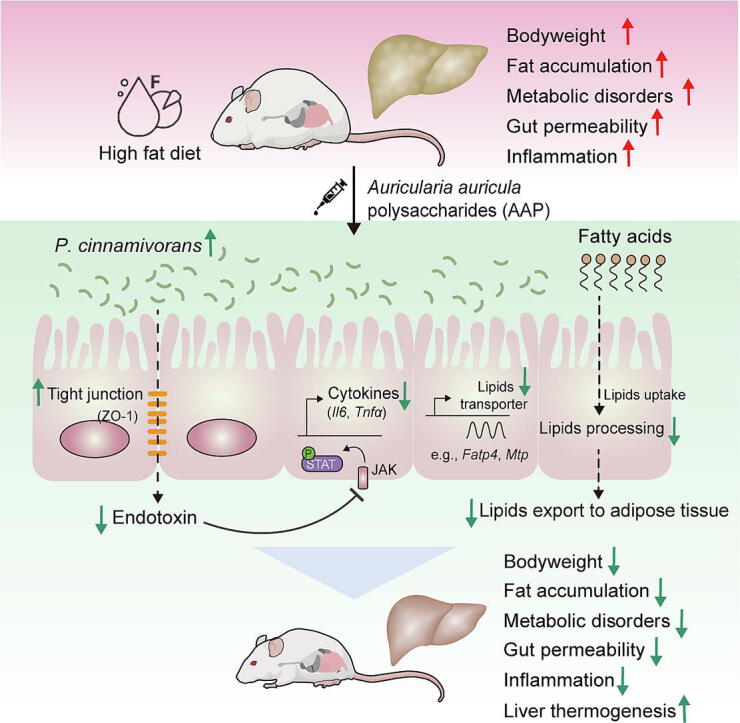
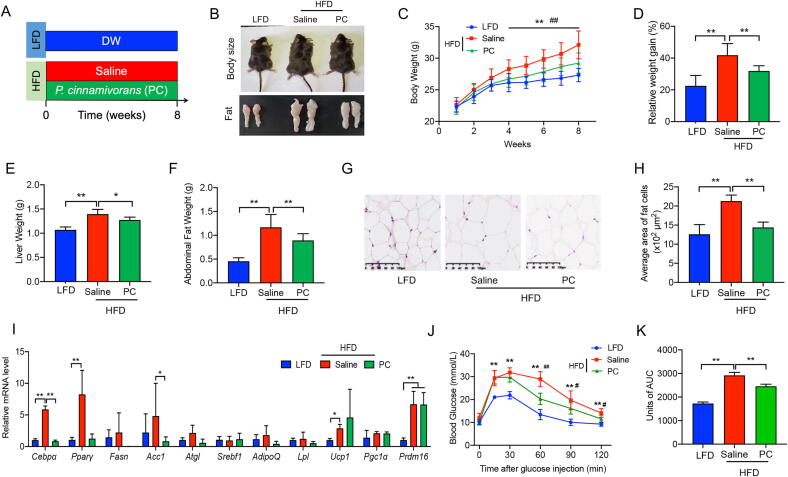
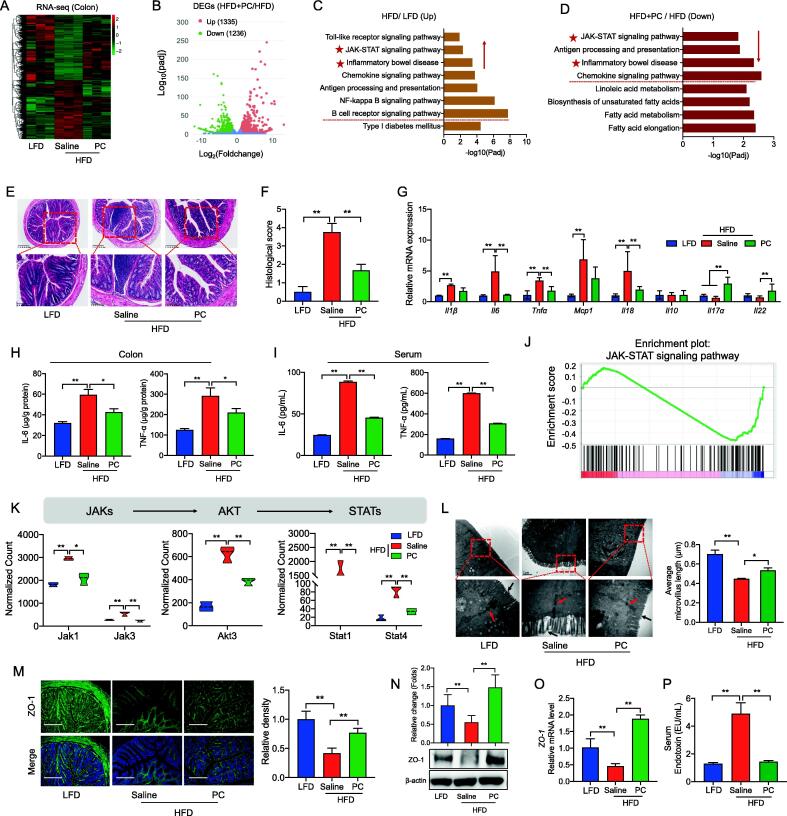
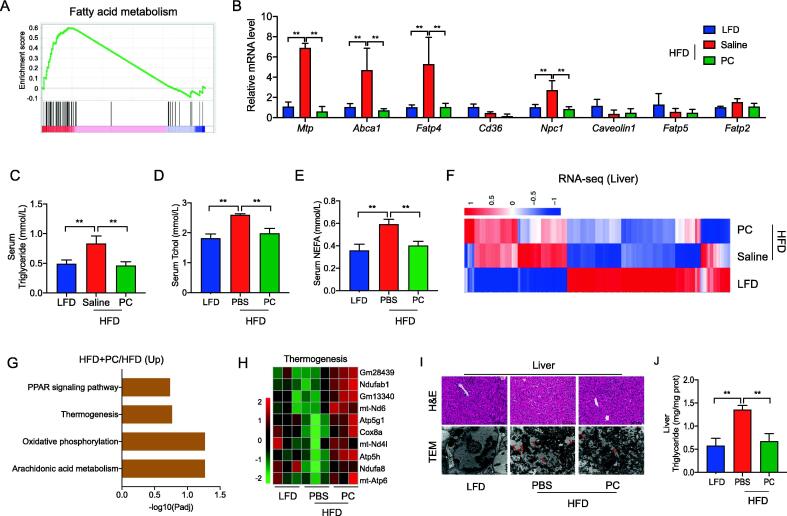
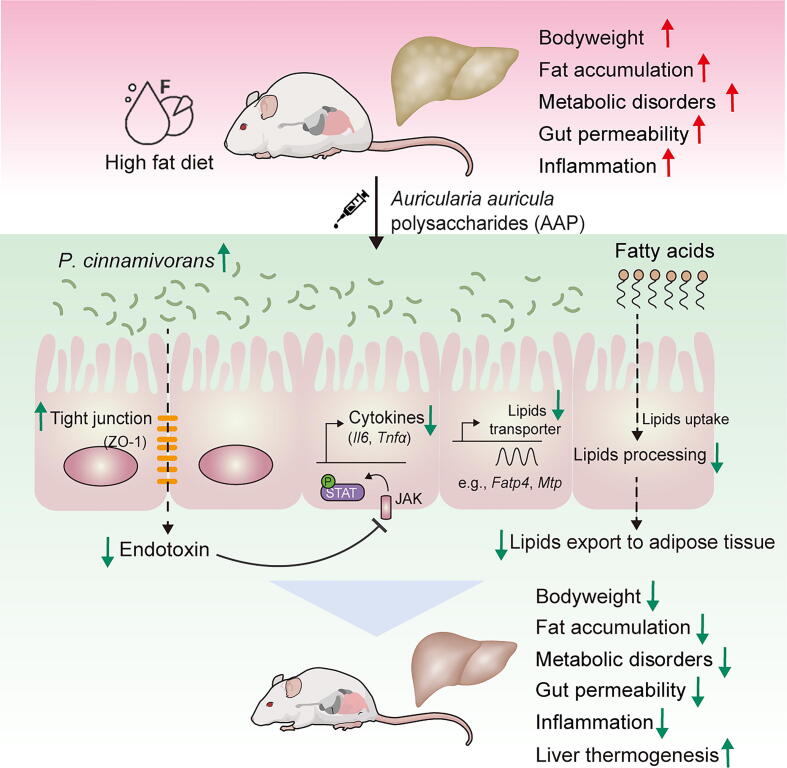
Results: High-fat diet (HFD) murine exposure to AAP thwarted weight gains, reduced fat depositing and enhanced glucose tolerance, together with upregulating thermogenesis proteomic biomarkers within adipose tissue. Serum metabolome indicated these effects were associated with changes in fatty acid metabolism. Intestine-dwelling microbial population assessments discovered that AAP selectively enhanced Papillibacter cinnamivorans, a commensal bacterium with reduced presence in HFD mice. Notably, HFD mice treated with oral formulations of P. cinnamivorans attenuated obesity, which was linked to decreased intestinal lipid transportation and hepatic thermogenesis. Mechanistically, it was demonstrated that P. cinnamivorans regulated intestinal lipids metabolism and liver thermogenesis by reducing the proinflammatory response and gut permeability in a JAK-STAT signaling-related manner.

Conclusion: Datasets from the present study show that AAP thwarted dietary-driven obesity and metabolism-based disorders by regulating intestinal lipid transportation, a mechanism that is dependent on the gut commensal P. cinnamivorans. These results indicated AAP and P. cinnamivorans as newly identified pre- and probiotics that could serve as novel therapeutics against obesity.

Keywords: Auricularia auricula; Gut microbiota; Obesity; Papillibacter cinnamivorans; Polysaccharides.


Conflict of interest statement

Declaration of Competing Interest The authors declare that they have no known competing financial interests or personal relationships that could have appeared to influence the work reported in this paper.

Figures

None
Graphical abstract
Fig. 1
Fig. 1
Oral administration of AAP circumvented dietary-driven obesity and metabolic disorders. (A) Mice were maintained on either a low-fat diet (LFD) or a high-fat diet (HFD) and exposed to daily AAP dosing for 8 weeks, n = 10 per treatment group. (B-D) Bodyweight (B), bodyweight gain (C), and bodyweight changes relative to the LFD reflected as obesity statistics (D). (E) Abdominal fat pad weight. (F) H&E-staining abdominal adipose tissue imaging. Scale-bar, 50 μm. (G) Adipocyte size in abdominal adipose tissues was determined from five microscopy fields for each murine using Adiposoft (Image J). (H) Hepatic triglyceride content. (I) Circulating triglycerides levels. (J) qPCR analysis of adipogenesis and lipogenesis mRNA expression in abdominal fat. (K) Circulating T-CHO levels. (L, M) OGTT and the corresponding area under the curve (AUC). (N) Heatmap of metabolites with significant variation according to the serum metabolome of HFD mice with and without AAP treatment, and of LFD mice. (O) Summary of metabolite set enrichment pathway analyses. Datasets reflected mean ± SEM. DW, distilled water. Line graphs were analyzed by two-way ANOVA, and histograms were analyzed by ordinary one-way ANOVA followed by Tukey’s post hoc test. # significant difference between LFD and HFD groups; * significant difference between HFD and HFD + AAP groups, * or #, P < 0.05, ** or ##, P < 0.01.
Fig. 2
Fig. 2
The intestinal microbiota was crucial for AAP against obesity. (A) HFD mice were exposed to an antibiotic combination of clindamycin, metronidazole, penicillin, vancomycin and neomycin (CMPVN) and either saline or AAP throughout all 8 weeks, n = 10 per group. (B-C) Bodyweight (B), bodyweight gain (C). (D) Liver weight. (E) Abdominal fat pad weight. (F) H&E-staining abdominal adipose tissue imaging. Scale-bar, 50 μm. (G) Adipocyte size in abdominal adipose tissues was determined from five microscopy fields for each murine using Adiposoft (Image J). (H) qPCR analysis of adipogenesis and lipogenesis mRNA expression within abdominal fat, expressed relative to the housekeeping mRNA, Gapdh. (I) Hepatic triglyceride content. (J-K) Circulating triglycerides and T-CHO levels. (L, M) OGTT and the corresponding AUC. Datasets reflected mean ± SEM. DW, distilled water. Line graphs were analyzed by two-way ANOVA, and histograms were analyzed by t-test. ** P < 0.01.
Fig. 3
Fig. 3
FMT from AAP-exposed mice diminished obesity and metabolic disorders within HFD mice. (A) Fecal microbiota from HFD mice given saline or AAP with/without antibiotics were transplanted into HFD recipients, n = 10 per group. (B-C) Bodyweight (B), bodyweight gain (C). (D) Hepatic triglyceride content. (E) Circulating triglycerides level. (F) H&E-staining abdominal adipose tissue imaging. Scale-bar, 50 μm. (G) Abdominal fat pad weight. (H) Adipocyte dimensions in abdominal adipose tissue were determined through five microscopy fields for each murine using Adiposoft (Image J). (I) qPCR analysis of adipogenesis and lipogenesis mRNA expression in abdominal fat, expressed relative to the housekeeping mRNA, Gapdh. (J, K) OGTT and corresponding AUC. Datasets reflected mean ± SEM. DW, distilled water. Line graphs were analyzed by two-way ANOVA, and histograms were analyzed by ordinary one-way ANOVA followed by Tukey’s post hoc test. * P < 0.05, ** P < 0.01 and *** P < 0.001.
Fig. 4
Fig. 4
Alternation of intestinal microbiota in obese mice treated with AAP. (A) α-diversity assessed through Chao1 index. (B) β-diversity analysis by PCoA on Bray-Curtis distance. (C) Differentially abundant genera and operational taxonomic units (OTUs) from 16S rRNA genomic-derived fecal microbiota assessment using LEfSe analysis. (D) Correlation analysis for all 16 recognized bacterial species and obesity-related endpoints. False-discovery-rate corrections for multiple analyses were employed. + significant difference between LFD and HFD groups, * significant difference between HFD and HFD + AAP groups, + or *, P < 0.05.
Fig. 5
Fig. 5
P. cinnamivorans was identified as the key bacteria for AAP reducing diet-induced obesity. (A) α-diversity assessed using the Chao1 index. (B) β-diversity analysis by PCoA on Bray-Curtis distance. (C) Differentially abundant genera and operational taxonomic units (OTUs) from 16S rRNA genomic-derived fecal microbiota analysis using LEfSe analysis. (D) Analytical strategy for key bacteria identification. (E) Correlation analysis for P. cinnamivorans and obesity trends. False-discovery-rate corrections for multiple testing were employed. + significant difference between LFD and HFD groups, * significant difference between HFD and HFD + AAP groups, + or *, P < 0.05.
Fig. 6
Fig. 6
P. cinnamivorans treatment protected mice against dietary-driven obesity and metabolic disorders. (A) LFD-fed mice and high-fat diet (HFD)-fed mice were treated daily with saline or P. cinnamivorans (PC) by oral gavage for 8 weeks. (B) Representative picture of body size, and fat pad. (C-D) Bodyweight (C), bodyweight gain (D). (E) Liver weight. (F) Abdominal fat pad weight. (G) H&E-staining abdominal adipose tissue imaging. Scale-bar, 100 μm. (H) Adipocyte dimensions and quantity within abdominal adipose tissue were determined from five microscopy fields for each murine. (I) qPCR analysis of Cebp and Pparγ mRNA expression in abdominal fat, expressed relative to the housekeeping mRNA, Gapdh. (J, K) OGTT and the corresponding AUC. Datasets reflected mean ± SEM. DW, distilled water. Line graphs were analyzed by two-way ANOVA, and histograms were analyzed by ordinary one-way ANOVA followed by Tukey’s post hoc test. # significant difference between LFD and HFD groups; * significant difference between HFD and HFD + PC groups, * or #, P < 0.05, ** or ##, P < 0.01.
Fig. 7
Fig. 7
P. cinnamivorans alleviated the inflammatory response and enhanced intestinal barrier function in HFD-induced obesity mice. (A) Heatmap of the differentially expressed genes (DEGs) of colon identified by RNA-seq. (B) Volcano plot showing DEGs of HFD + PC versus HFD. (C) KEGG analysis of up-regulated genes from DEGs of HFD versus LFD. (D) KEGG analysis of down-regulated genes from DEGs of HFD + PC versus HFD. (E-F) Serial sections of colon tissues were stained with H&E (E), and Histological scores (F). Scale-bar, 100 μm. (G) qPCR analysis of inflammatory marker expression in the colon, expressed relative to the housekeeping mRNA, Gapdh. (H-I) Secretion of TNF-α and IL-6 in colonic tissue (H) and serum (I) determined by ELISA. (J) Enrichment plot of JAK/STAT signaling pathway from GSEA. (K) RNA-seq expression data for JAK-STAT signaling genes. (L) The morphological changes of intestinal tight junctions were observed under transmission electron microscopy (TEM, 80,000 × magnification). (M) Immunofluorescence analysis of ZO-1 (green) and DAPI (blue). Scale-bar, 100 μm. (N) The expression of ZO-1 was assessed by Western blot. The right panel shows the relative protein levels quantified by densitometry and normalized to β-actin. (O) qPCR analysis of ZO-1 expression in the colon, expressed relative to the housekeeping mRNA, Gapdh. (P) Serum endotoxin (lipopolysaccharides, LPS) level. Datasets reflected mean ± SEM. One-way ANOVA and Tukey’s post hoc test. * P < 0.05, ** P < 0.01 and *** P < 0.001. (For interpretation of the references to colour in this figure legend, the reader is referred to the web version of this article.)
Fig. 8
Fig. 8
P. cinnamivorans attenuated HFD-induced obesity by regulating intestinal lipids absorption and hepatic thermogenesis. (A) Enrichment plot of fatty acid metabolism pathway from GSEA. (B) qPCR analysis of fatty acids transporters expression in the colon, expressed relative to the housekeeping mRNA, Gapdh. (C-E) Triglyceride (C), cholesterol (D), and non-esterified free fatty acid (NEFA, E) levels in serum. (F) Heatmap of the differentially expressed genes (DEGs) of liver identified by RNA-seq. (G) KEGG analysis of up-regulated genes from DEGs of HFD + PC versus HFD. (H) Heatmap of relative expression of selected thermogenesis-regulated genes from the RNA-seq dataset. (I) Liver steatosis was evaluated by H&E staining and TEM (80,000 × magnification). Scale-bar, 100 μm. (J) Hepatic triglyceride level. Datasets reflected mean ± SEM. One-way ANOVA and Tukey’s post hoc test. * P < 0.05, ** P < 0.01 and *** P < 0.001.
Fig. 9
Fig. 9
Schematic representation of the working model. AAP selectively enhanced P. cinnamivorans, a commensal bacterium with reduced presence in HFD mice to attenuate obesity and the associated dysregulated metabolism. Mechanistically, P. cinnamivorans regulated intestinal lipids metabolism and liver thermogenesis by reducing the proinflammatory response and gut permeability in a JAK-STAT signaling-related manner.

Similar articles

Cited by

References

    1. Das M., Ellies L.G., Kumar D., Sauceda C., Oberg A., Gross E., et al. Time-restricted feeding normalizes hyperinsulinemia to inhibit breast cancer in obese postmenopausal mouse models. Nat Commun. 2021;12(1):565. - PMC - PubMed
    1. Nauck M.A., Jensen T.J., Rosenkilde C., Calanna S., Buse J.B. Investigators LPCobotLT: Neoplasms reported with liraglutide or placebo in people with type 2 diabetes: results from the leader randomized trial. Diabetes Care. 2018;41(8):1663–1671. - PMC - PubMed
    1. Zong X., Fu J., Xu B.C., Wang Y.Z., Jin M.L. Interplay between gut microbiota and antimicrobial peptides. Anim Nutr. 2020;6(4):389–396. - PMC - PubMed
    1. Sommer F., Backhed F. The gut microbiota - masters of host development and physiology. Nat Rev Microbiol. 2013;11(4):227–238. - PubMed
    1. Ridaura V.K., Faith J.J., Rey F.E., Cheng J., Duncan A.E., Kau A.L., et al. Gut microbiota from twins discordant for obesity modulate metabolism in mice. Science. 2013;341(6150):1241214. - PMC - PubMed

Publication types

Supplementary concepts

LinkOut - more resources