Randomized Controlled Trial
. 2023 Nov;50(11):878-892.
doi: 10.1111/1440-1681.13812. Epub 2023 Aug 7.

Intraoperative hemodynamics and risk of cardiac surgery-associated acute kidney injury: An observation study and a feasibility clinical trial

Affiliations
Randomized Controlled Trial

Intraoperative hemodynamics and risk of cardiac surgery-associated acute kidney injury: An observation study and a feasibility clinical trial

Khin M Noe et al. Clin Exp Pharmacol Physiol. 2023 Nov.

Abstract

Targeting greater pump flow and mean arterial pressure (MAP) during cardiopulmonary bypass (CPB) could potentially alleviate renal hypoxia and reduce the risk of postoperative acute kidney injury (AKI). Therefore, in an observational study of 93 patients undergoing on-pump cardiac surgery, we tested whether intraoperative hemodynamic management differed between patients who did and did not develop AKI. Then, in 20 patients, we assessed the feasibility of a larger-scale trial in which patients would be randomized to greater than normal target pump flow and MAP, or usual care, during CPB. In the observational cohort, MAP during hypothermic CPB averaged 68.8 ± 8.0 mmHg (mean ± SD) in the 36 patients who developed AKI and 68.9 ± 6.3 mmHg in the 57 patients who did not (p = 0.98). Pump flow averaged 2.4 ± 0.2 L/min/m2 in both groups. In the feasibility clinical trial, compared with usual care, those randomized to increased target pump flow and MAP had greater mean pump flow (2.70 ± 0.23 vs. 2.42 ± 0.09 L/min/m2 during the period before rewarming) and systemic oxygen delivery (363 ± 60 vs. 281 ± 45 mL/min/m2 ). Target MAP ≥80 mmHg was achieved in 66.6% of patients in the intervention group but in only 27.3% of patients in the usual care group. Nevertheless, MAP during CPB did not differ significantly between the two groups. We conclude that little insight was gained from our observational study regarding the impact of variations in pump flow and MAP on the risk of AKI. However, a clinical trial to assess the effects of greater target pump flow and MAP on the risk of AKI appears feasible.

Keywords: arterial pressure; cardiopulmonary bypass; clinical perfusion; pump flow; systemic oxygen delivery.


Figures

FIGURE 1
FIGURE 1
Recruitment of patients: observational study. Patients with a high risk of postoperative mortality, assessed using EuroScore II, were preferably selected over patients with a low risk of postoperative mortality. The study was originally designed and powered to investigate the utility of continuous measurement of urinary oxygen tension for predicting postoperative acute kidney injury. These analyses utilizing measurement of urinary oxygen tension have been reported previously., , , , , Some patients who provided informed consent did not progress to the study because only one urinary oxygen monitor was available. Thus, only one patient could be studied at a time.
FIGURE 2
FIGURE 2
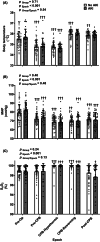
Clinical parameters measured throughout cardiac surgery in the observational study: body temperature, mean arterial pressure (MAP) and saturation of arterial haemoglobin with oxygen (SAO2). All clinical parameters were averaged across five surgical epochs as indicated on the abscissa. Each symbol represents an individual data point for an individual patient who either did (closed circles) or did not (open circles) develop AKI. Columns and error bars represent mean ± standard deviation (SD) for n = 57 (No AKI) and n = 36 (AKI) except for body temperature, for which seven patients were excluded from the analyses due to multiple missing values in both groups (total n = 86): n = 53 (no AKI) and n = 33 (AKI). Thus, because conditional mean imputation could not be applied, the entire patient was excluded from the analysis. The surgical procedure was divided into five epochs: Pre‐Op, the preoperative period before the first incision but after induction of anaesthesia; Pre‐CPB, the period of surgery before commencement of cardiopulmonary bypass; CPB‐Hypothermic, hypothermic cardiopulmonary bypass; CPB‐Rewarming, rewarming on cardiopulmonary bypass; and Post‐CPB, the period of surgery after weaning from cardiopulmonary bypass. p‐values were derived from a two‐way repeated measures analysis of variance based on the between‐subjects factor group (AKI or no AKI) and the within‐subjects factor time (epoch). p‐values for the within‐subjects factor (time) were adjusted using the method of Greenhouse and Geisser. *p ≤ 0.05, **p ≤ 0.01, ***p ≤ 0.001 for specific comparisons at each epoch between patients who did not develop AKI and patients who developed AKI (Student's unpaired t‐test). †p ≤ 0.05, ††p ≤ 0.01, †††p ≤ 0.001 for comparison of each epoch with the first epoch (Pre‐Op) using Student's paired t‐test. AKI, acute kidney injury; MAP, mean arterial pressure; SAO2; oxygen saturation of arterial haemoglobin. Note that ordinate (y) axes do not start at zero.
FIGURE 3
FIGURE 3
Pump flow during cardiopulmonary bypass in the observational study: pump flow was averaged across the hypothermic and rewarming phases as indicated on the abscissa. Data were missing for two patients ([n = 91]: n = 55 [no AKI] and n = 36 [AKI]). Abbreviations and the format of presentation of the data, including statistical notation, are as for Figure 2. Note that the ordinate (y) axis does not start at zero.
FIGURE 4
FIGURE 4
Recruitment of patients: feasibility clinical trial.
FIGURE 5
FIGURE 5
Pump flow during cardiopulmonary bypass in the feasibility clinical trial: lines show data for individual patients in the usual care (blue, n = 11) and intervention (red, n = 9) groups. Symbols and error bars show mean ± standard deviation. p‐values are the outcomes of repeated measures analysis of variance. **p ≤ 0.01, ***p ≤ 0.001 for comparisons between the usual care and intervention groups at each individual epoch (Student's unpaired t‐test). Note that the ordinate (y) axis does not start at zero.
FIGURE 6
FIGURE 6
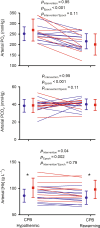
Arterial blood oximetry during cardiopulmonary bypass in the feasibility clinical trial: partial pressure of oxygen in arterial blood (Arterial PO2), partial pressure of carbon dioxide in arterial blood (Arterial PCO2) and blood haemoglobin concentration (Arterial [Hb]). Lines show data for individual patients in the usual care (blue) and intervention (red) groups. n = 11 for the usual care group, with one value imputed for arterial PO2. n = 9 for the intervention group, except for arterial PO2 (n = 7), and arterial PCO2 (n = 8), due to equipment failure. Symbols and error bars show mean ± standard deviation. p‐values are the outcomes of repeated measures analysis of variance. *p ≤ 0.05 for comparisons between the usual care and intervention groups at each individual epoch (Student's unpaired t‐test). Note that some ordinate (y) axes do not start at zero.
FIGURE 7
FIGURE 7
Systemic oxygenation during cardiopulmonary bypass in the feasibility clinical trial: oxygen delivery (DO2), oxygen consumption (VO2), saturation of venous haemoglobin with oxygen (venous saturation) and fractional extraction of oxygen. Lines show data for individual patients in the usual care (blue) and intervention (red) groups. n = 11 for the usual care group and n = 9 for the intervention group. Symbols and error bars show mean ± standard deviation. p‐values are the outcomes of repeated measures analysis of variance. *p ≤ 0.05, ***p ≤ 0.001 for comparisons between the usual care and intervention groups at each individual epoch (Student's unpaired t‐test). Note that some ordinate (y) axes do not start at zero.
FIGURE 8
FIGURE 8
Clinical parameters measured throughout cardiac surgery in the feasibility clinical trial: body temperature, mean arterial pressure (MAP), and saturation of arterial haemoglobin with oxygen (SAO2). Lines show data for individual patients in the usual care (blue) and intervention (red) groups. n = 11 for the usual care group and n = 9 for the intervention group. For body temperature, two values were imputed for the usual care group, and one value was imputed for the intervention group. Symbols and error bars show mean ± standard deviation. p‐values are the outcomes of repeated measures analysis of variance. Note that ordinate (y) axes do not start at zero.

References

    1. Hu J, Chen R, Liu S, Yu X, Zou J, Ding X. Global incidence and outcomes of adult patients with acute kidney injury after cardiac surgery: a systematic review and meta‐analysis. J Cardiothorac Vasc Anesth. 2016;30:82‐89. - PubMed
    1. Ishani A, Nelson D, Clothier B, et al. The magnitude of acute serum creatinine increase after cardiac surgery and the risk of chronic kidney disease, progression of kidney disease, and death. Arch Intern Med. 2011;171:226‐233. - PubMed
    1. Coca SG, Singanamala S, Parikh CR. Chronic kidney disease after acute kidney injury: a systematic review and meta‐analysis. Kidney Int. 2012;81:442‐448. - PMC - PubMed
    1. Ow CPC, Ngo JP, Ullah MM, Hilliard LM, Evans RG. Renal hypoxia in kidney disease: cause or consequence? Acta Physiol (Oxf). 2018;222:e12999. - PubMed
    1. Evans RG, Lankadeva YR, Cochrane AD, et al. Renal haemodynamics and oxygenation during and after cardiac surgery and cardiopulmonary bypass. Acta Physiol (Oxf). 2018;222:e12995. - PubMed

Publication types