. 2023 Aug 7;6(10):e202302227.
doi: 10.26508/lsa.202302227. Print 2023 Oct.

Generating fast-twitch myotubes in vitro with an optogenetic-based, quantitative contractility assay

Affiliations

Generating fast-twitch myotubes in vitro with an optogenetic-based, quantitative contractility assay

Katharina Hennig et al. Life Sci Alliance. .

Abstract

The composition of fiber types within skeletal muscle impacts the tissue's physiological characteristics and susceptibility to disease and ageing. In vitro systems should therefore account for fiber-type composition when modelling muscle conditions. To induce fiber specification in vitro, we designed a quantitative contractility assay based on optogenetics and particle image velocimetry. We submitted cultured myotubes to long-term intermittent light-stimulation patterns and characterized their structural and functional adaptations. After several days of in vitro exercise, myotubes contract faster and are more resistant to fatigue. The enhanced contractile functionality was accompanied by advanced maturation such as increased width and up-regulation of neuron receptor genes. We observed an up-regulation in the expression of fast myosin heavy-chain isoforms, which induced a shift towards a fast-twitch phenotype. This long-term in vitro exercise strategy can be used to study fiber specification and refine muscle disease modelling.


Conflict of interest statement

The authors declare that they have no conflict of interest.

Figures

Figure S1.
Figure S1.. AAV9-pACAGW-ChR2-Venus-AAV infection leads to high percentage of myotubes expressing ChR2.
(A) Brightfield image of myotubes at day 4 of differentiation. (B) Fluorescent image of ChR2. Scale bars: 50 μm.
Figure 1.
Figure 1.. Strategy to submit myotubes to long-term light-induced exercise and quantify contraction kinetics with single-cell resolution.
(A, B) Schematic illustration (A) and image of designed OptoPlate (B). (C) Kymograph of a contracting 4-d myotube continuously stimulated with blue light. White dashed circles highlight the nucleus and the black dashed line marks the initial nuclear position before stimulation. (D) Particle image velocimetry analysis applied to myotube displacement over time. Displacement vectors (green arrows) and velocity fields (heat map) convey myotube movement. (E) Representative displacement curve of a single-contracting myotube. (F) Boxplot of myotube contraction velocity averaged over 2 s (n = 100). (G) Boxplot of time needed for cells to enter fatigue when continuously light stimulated (n = 49). Data information: (F, G) experiments performed in triplicates and outliers were identified using ROUT method (Q = 1). Scale bars: (C, D) 10 μm.
Figure 2.
Figure 2.. Trained myotubes undergo faster contraction cycles.
(A) Experimental protocol to submit in vitro primary mouse myotubes to OptoTraining. After the initial growth phase, myoblasts differentiate into multinucleated myotubes. Myotubes were infected with AAV9-pACAGW-ChR2-Venus at day 0 and submitted to OptoTraining from day 2 (8 h per day, blue boxes). (B) Schematic showing the three OptoTraining protocols at 2, 5 or 10 Hz. (C) Boxplots depicting the contraction velocities of untrained cells (n = 100) and cells trained at 2 Hz (n = 73), 5 Hz (n = 32), and 10 Hz (n = 25). (D) Graph showing time until fatigue of myotubes after 3 d of OptoTraining with different frequencies (untrained n = 49; 2 Hz n = 13; 5 Hz n = 45; 10 Hz n = 13). (E, F) Left: representative brightfield images of single myotubes with magnifications of myonuclei (red dashed boxes). (E, F) Right: 2-s kymographs (blue line) of untrained (E) and trained (F) myotubes when continuously stimulated with blue light. (G) Single-track displacement curves of untrained (grey) and trained (5 Hz light stimulation frequency: blue) myotubes. (H) Representative displacement curve illustrating metrics of quantitative analysis during contraction: detection of maxima (red) and minima (blue) allows to dissect the curve into acceleration (light blue) and relaxation (grey) phases. (I, J) Acceleration (I) and relaxation (J) time of individual myotubes averaged over contractions over 2 s. (K, L) Frequency (K) and wavelength (L) for untrained and trained myotubes. (I, J, K, L) Untrained n = 22, trained 5 Hz n = 36. Data information: all experiments were repeated at least three times. Data were plotted as box and whisker plots and outliers identified using ROUT method (Q = 1). Two-tailed unpaired t test; ns, nonsignificant; P < 0.05. Scale bars: (E, F) 10 μm.
Figure S2.
Figure S2.. OptoTraining does not induce sarcomeric damage.
(A, B) Immunofluorescent images of filamin C showing sarcomeric scaring (red hot) in untrained (A) and trained (B) myotubes at day 4 of differentiation (cyan: DAPI; grey: α-actinin). (C) Western blots and bar charts (mean ± SD) showing quantification of filamin C and calnexin (loading control) protein expression (n = 3). (D, E) smFISH probes for filamin C expressed in untrained (D) and trained (E) myotubes. (F) Box and whisker plot with smFISH quantification of filaminC mRNA counts (untrained n = 47; trained n = 52). Data information: all experiments performed in triplicate and outliers identified using ROUT method (Q = 1). Two-tailed unpaired t test; ns, nonsignificant; P < 0.05. Scale bars: 10 μm.
Figure 3.
Figure 3.. OptoTraining facilitates morphological maturation.
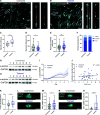
(A, B) Representative fluorescent images to assess myotube morphology of untrained (A) and trained (B) cultures (grey: α-actinin; cyan: myonuclei). Magnifications (white boxes) illustrate quantified tissue quality parameters. Left: myotube width (blue lines) and myonuclei spacing, density, and uniformity (red lines). Right: AChR clusters (red hot: BTX). (C, D, E) Boxplots showing (C) myotube width (untrained n = 20; trained n = 19), (D) myonuclei distance (untrained n = 73; trained n = 72), and (E) myonuclei variability coefficient at day 4 of differentiation (untrained n = 95; trained n = 105). (F) Percentage of striated myotubes (data summarized in grouped bar graph with mean ± SD as error bars; dark blue: fully striated; blue: partially striated; light blue: non-striated; n = 3). (G, H) Western blots of α-actinin and GAPDH (loading control) protein expression for untrained (G) and trained (H) cultures over 7 d of myotube differentiation (n = 7). (I) Graph showing temporal mean α-actinin expression normalized to GAPDH (error bars showing SD). (J) Contraction velocity plotted relative to cell width of trained and untrained myotubes. R2 (0.028) was computed for the whole dataset of untrained and trained myotubes via two-tailed Pearson’s correlation with a 95% confidence interval (n = 41). (K) Box and whisker plot showing the ratio of AChR-positive myonuclei (untrained n = 33; trained n = 35). (L, M, N, O) Chrnγ (L) and Chrnε (N) smFISH probes (grey) and DAPI staining (cyan) in trained and untrained myotubes with plot showing (M) Chrnγ (untrained n = 68; trained n = 64) and (O) Chrnε (untrained n = 58; trained n = 68) mRNA count per μm2 myotube area. Scale bars: (A, B) 100 μm; (A, B magnifications; L, N) 10 μm. Data information: all experiments were repeated at least three times and outliers were identified using ROUT method (Q = 1). Two-tailed unpaired t test; ns, nonsignificant; P < 0.05.
Figure S3.
Figure S3.. Myotubes adapt morphology to distinct stimulation frequencies.
(A, B, C) Box plots showing (A) myotube width (untrained n = 20; 2 Hz n = 10; 5 Hz n = 19; 10 Hz n = 10), (B) myonuclei spacing distances (untrained n = 73; 2 Hz n = 74; 5 Hz n = 72; 10 Hz n = 75), and (C) uniformity coefficient (untrained n = 95; 2 Hz n = 101; 5 Hz n = 105; 10 Hz n = 99) at day 4 of differentiation for untrained myotubes and cultures stimulated at 2, 5 or 10 Hz. Data information: ROUT method (Q = 1) to identify outliers. Two-tailed unpaired t test; ns, nonsignificant; P < 0.05.
Figure S4.
Figure S4.. Long-term training does not influence AChR cluster morphology.
(A, B) Representative images of AChR (red hot: BTX) clustered around myonuclei (cyan: DAPI) for untrained and trained myotubes (grey: α-actinin; scale bar: 10 μm). (C, D, E) Box plots of structural parameters showing (C) total area, (D) circularity, and (E) roundness (untrained n = 24; trained n = 33). Two-tailed unpaired t test; P < 0.05. (F) Bar graph (mean ± SD) showing gene expression of Chrnγ and Chrnε in trained cultures relative to untrained cultures (n = 3). Ct values were normalized to the expression of housekeeping gene HRPT. Light red zone: nonsignificant fold change (cut-off value −0.5 > log2FC > 0.5).
Figure 4.
Figure 4.. Long-term mechanical training up-regulates the expression of neo-Myh8 and fMyh isoforms.
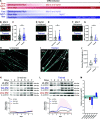
(A) Simplified scheme showing temporal expression patterns of Myh isoforms for slow and fast twitch fiber types. (B, C, D, E, F, G) smFISH for Myh3 (B), Myh8 (D), and Myh7 (F) mRNA expressed in myonuclei (cyan dotted outline; red arrowheads highlighting smFISH probes) of untrained and trained myotubes. Boxplots of RNA expression per myonucleus area. (C, E, G) For (C) untrained n = 106; trained n = 98, (E) untrained n = 82; trained n = 101, and (G) untrained n = 100; trained n = 88. (H, I) Immunofluorescence images of untrained (H) and trained (I) myotubes stained for total Myh. (J) Measured fluorescence intensity of total Myh per myotube (untrained n = 26; trained n = 21). (K, L) Western blots of total Myh (black), fast-Myh (blue), and slow-Myh (red) and α-actinin (grey) as a loading control with associated graphs for untrained (K) and trained (L) cultures. Graphs showing the relative expression profile (mean ± SD) of respective Myh isoforms normalized to α-actinin, which was used as a muscle-specific loading control (n = 3). (M) Graph showing mRNA expression of distinct Myh isoforms for untrained cultures relative to trained cultures, quantified using qRT-PCR (n = 3). Ct values were normalized to the expression of housekeeping gene HRPT. Light blue zone: nonsignificant fold change (cut-off value −0.5 > log2FC > 0.5). Data information: (C, E, G, J) Data plotted as box and whisker plots. Outliers were identified using ROUT method (Q = 1). Two-tailed unpaired t test; ns, nonsignificant; P < 0.05. Scale bars: (B, D, F): 5 μm; (H, I): 50 μm.
Figure S5.
Figure S5.. Validation of Myh antibody specificity.
(A, B) Muscle sections of (A) mice pups (5 d old) and (B) soleus (30-wk-old mice) stained with fast-Myh (PA5-72846; Thermo Fisher Scientific), slow-Myh (A4.951; DSHB), total-Myh (sc-32732; Santa cruz), and emb-Myh3 (F1.652; DSHB) antibodies. Fast-Myh antibody stains Myh8, Myh1, Myh2, and Myh4 and slow-Myh stains Myh7, whereas total-Myh recognizes all isoforms. Scale bars: 100 µm.
Figure S6.
Figure S6.. Up-regulation of fMyh in trained muscle cultures is because of the increase in fast-Myh1 and fast-Myh4 protein expression.
(A, B) Western blots of emb-Myh3, fast-Myh1, fast-Myh2, and fast-Myh4 protein expression with respective loading control α-actinin over 7 d in untrained (A) and trained (B) muscle cultures. Graphs show temporal expression profile (mean ± SD as error bars) of Myh isoforms relative to α-actinin, which was used as a loading control to account for sarcomerogenesis, and normalized to day 1 of differentiation (n = 3).
Figure S7.
Figure S7.. OptoTraining does not induce metabolic changes.
(A) Lactate concentrations after 7 d of differentiation measured in the supernatant and cell lysate of untrained and trained cells (n = 4). Two-tailed paired t test; P < 0.05. (B) Representative Western blot bands of oxidative phosphorylation complexes (OxPhos Cx) and α-actinin (loading control) for (left) untrained and (right) trained myotubes (day 7). (C) Graph showing OxPhos Cx relative to α-actinin protein expression. (D) Quantification of oxidative phosphorylation complexes from (C).

Similar articles

Cited by

References

    1. Agbulut O, Noirez P, Beaumont F, Butler-Browne G (2003) Myosin heavy chain isoforms in postnatal muscle development of mice. Biol Cell 95: 399–406. 10.1016/s0248-4900(03)00087-x - DOI - PubMed
    1. Aguilar‐Agon KW, Capel AJ, Martin NR, Player DJ, Lewis MP (2019) Mechanical loading stimulates hypertrophy in tissue‐engineered skeletal muscle: Molecular and phenotypic responses. J Cell Physiol 234: 23547–23558. 10.1002/jcp.28923 - DOI - PMC - PubMed
    1. Asano T, Ishizuka T, Morishima K, Yawo H (2015) Optogenetic induction of contractile ability in immature C2C12 myotubes. Sci Rep 5: 8317. 10.1038/srep08317 - DOI - PMC - PubMed
    1. Bajaj P, Reddy B Jr., Millet L, Wei C, Zorlutuna P, Bao G, Bashir R (2011) Patterning the differentiation of C2C12 skeletal myoblasts. Integr Biol (Camb) 3: 897–909. 10.1039/c1ib00058f - DOI - PubMed
    1. Bakooshli MA, Lippmann ES, Mulcahy B, Iyer N, Nguyen CT, Tung K, Stewart BA, van den Dorpel H, Fuehrmann T, Shoichet M, et al. (2019) A 3D culture model of innervated human skeletal muscle enables studies of the adult neuromuscular junction. Elife 8: e44530. 10.7554/eLife.44530 - DOI - PMC - PubMed

Publication types

MeSH terms

LinkOut - more resources