. 2023 Aug 7;14(1):4734.
doi: 10.1038/s41467-023-40453-0.

Identification of scaffold proteins for improved endogenous engineering of extracellular vesicles

Affiliations

Identification of scaffold proteins for improved endogenous engineering of extracellular vesicles

Wenyi Zheng et al. Nat Commun. .

Abstract

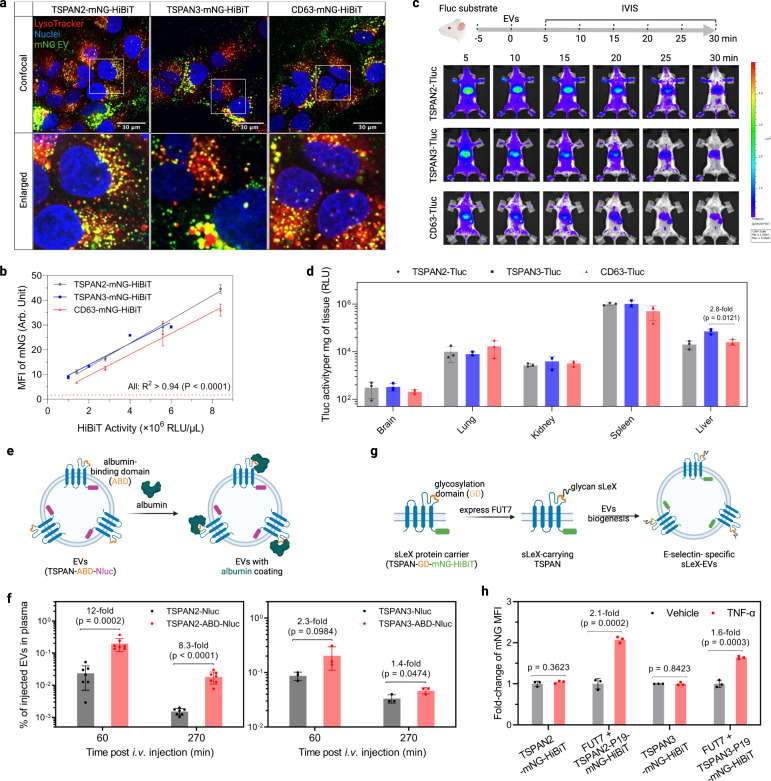
Extracellular vesicles (EVs) are gaining ground as next-generation drug delivery modalities. Genetic fusion of the protein of interest to a scaffold protein with high EV-sorting ability represents a robust cargo loading strategy. To address the paucity of such scaffold proteins, we leverage a simple and reliable assay that can distinguish intravesicular cargo proteins from surface- as well as non-vesicular proteins and compare the EV-sorting potential of 244 candidate proteins. We identify 24 proteins with conserved EV-sorting abilities across five types of producer cells. TSPAN2 and TSPAN3 emerge as lead candidates and outperform the well-studied CD63 scaffold. Importantly, these engineered EVs show promise as delivery vehicles in cell cultures and mice as demonstrated by efficient transfer of luminal cargo proteins as well as surface display of different functional entities. The discovery of these scaffolds provides a platform for EV-based engineering.


Conflict of interest statement

A.G., D.G., J.Z.N. and S.E.A. are consultants for and have equity interests in EVOX Therapeutics Ltd, Oxford, UK. The other authors declare no competing interests.

Figures

Fig. 1
Fig. 1. A bioluminescence screening protocol for quantification of luminal cargo proteins in EVs.
a Selection criteria and overview of EV-sorting protein candidates. The red solid lines indicate the 25%, 50% and 75% percentile values. b SEC elution profiles of conditioned media from HEK-293T cells expressing Tluc or CD63-Tluc. Tluc activity in each fraction was quantified directly (group PBS) or after membrane lysis (group Triton) and normalized to the fraction with the highest signal. EVs and soluble proteins were recovered in fractions 0-3 and 4–12, respectively. c Scheme of differentiating Tluc forms in conditioned media. d Percentage of intravesicular Tluc for CD63-Tluc using fractionated and unfractionated media. Results are shown as the mean ± standard deviation of three biological replicates. Two-sided Student’s t test (P > 0.9999). ns: not significant. e Outline of the screening procedure and data analyses. HEK-293T cells were grown in 96-well microplates and co-transfected with Tluc fusion plasmid and Nluc plasmid. Cell cultures were centrifuged and Tluc activity was measured in the cell pellet and conditioned media. Nluc activity was only quantified in the conditioned media. c, e Created with BioRender.com. Source data are provided as a Source Data file. SEC size exclusion chromatography.
Fig. 2
Fig. 2. EV-sorting ability of candidate proteins.
a Overview of all 244 candidates plotting total secreted Tluc against percentage of intravesicular Tluc. EV-sorting proteins were defined to have a percentage of intravesicular Tluc above zero (yellow area) and are shown in the grouped dot plot. The value refers to the percentage of intravesicular Tluc. Proteins are marked with gene names. b Correlation between the rank regarding total secreted Tluc and the rank regarding total secreted Tluc/Nluc ratio. c Correlation of the percentage of intravesicular Tluc obtained from the primary and repeat screening. d Correlation of the rank regarding secreted Tluc or secretion efficiency between the primary and repeat screening. Results in (a, b) were from the primary screening and are shown as mean ± standard deviation of five biological replicates. Data from the repeat screening are shown as mean ± standard deviation of three biological replicates. In the scatter plots, each dot refers to one candidate and the red dot indicates the benchmark CD63. The degree of correlation was analyzed with linear regression and is shown as goodness-of-fit (R2) and significance of non-zero slope (P). Source data are provided as a Source Data file.
Fig. 3
Fig. 3. EV-sorting ability of candidate proteins in various cell sources.
a Top ten scaffold proteins regarding intravesicular Tluc in different producer cell types. The value inside the plot refers to the percentage of intravesicular Tluc. Results are shown as mean ± standard deviation of three biological replicates. b Number of EV-sorting proteins identified for each producer cell type and overlap between cell types. c Rank of the 24 conserved EV-sorting proteins regarding intravesicular Tluc in each cell type. The value indicates the rank in each cell type as well as the average thereof. d Topology and subcellular location of the 24 conserved EV-sorting proteins. Created with BioRender.com. (e-f) Interaction network of the 24 conserved EV-sorting proteins retrieved from STRING (e) and IntAct (f) databases. Line thickness in panels (e, f) indicates the strength of data support, with thicker line standing for stronger evidence. Proteins are marked with gene names. Source data are provided as a Source Data file.
Fig. 4
Fig. 4. EV-sorting ability of candidate proteins in standardized production conditions.
a Workflow of EV production and SEC fractionation protocol. Created with BioRender.com. b SEC elution profiles of conditioned media from transfected HEK-293T cells. EVs and soluble proteins were recovered in fractions 0–3 and 4–12, respectively. Tluc activity in each fraction was measured with and without Triton and ProK, and normalized to the fraction with the highest signal. c Percentage of intravesicular Tluc using the screening (upper panel; five biological replicates) and standardized (lower panel; four biological replicates) protocols. Mean ± standard deviation. d Calculated Tluc activity per vesicle for purified EV preparations. Results are shown as an average of two biological replicates. Proteins are marked with gene names. Source data are provided as a Source Data file. SEC size exclusion chromatography.
Fig. 5
Fig. 5. EV-sorting ability of candidate proteins fused to a hybrid bioluminescent and fluorescent reporter.
a Workflow of EV production and analysis. Created with BioRender.com. b Intravesicular HiBiT relative to the benchmark CD63. n.d. not detected. c Percentage of intravesicular HiBiT. In b, c, results are shown as mean ± standard deviation of four biological replicates. Screening results from HEK-293T cells were re-graphed for reference. d Single-vesicle flow cytometry dot plots of mNG-HiBiT-labeled EVs. e Concentration and mean fluorescence intensity (MFI) of mNG-positive EVs. Results are shown as mean ± standard deviation of three biological replicates. Proteins are marked with gene names. Source data are provided as a Source Data file.
Fig. 6
Fig. 6. Physiochemical features of TSPAN2-, TSPAN3- and CD63-enriched EVs.
a Size distribution of EVs from transfected HEK-293T cells. b Representative cryo-electron microscopy images of EVs. c Western blots of positive and negative markers of EVs. d Cellular location of tetraspanins in transfected HEK-293T cells. e Single-vesicle flow cytometry dot plots of EVs after staining with APC-conjugated CD9/CD63/CD81 tetraspanin antibodies. f Volcano plots showing differentially enriched proteins in EVs. The red digits indicate the count of differentially enriched proteins. Results were from three biological replicates. Source data are provided as a Source Data file. The mass spectrometry proteomics data have been deposited to the ProteomeXchange Consortium via the PRIDE partner repository with the dataset identifier PXD043840.
Fig. 7
Fig. 7. Biological activity of TSPAN2- and TSPAN3-engineered EVs.
a Huh-7 cells were treated with EVs for 4 h and stained with LysoTracker to visualize lysosomes. Confocal microscopy images from representative regions from the whole well are shown. The experiment was performed once. b Huh-7 cells were treated with EVs for 8 h. Cellular mNG MFI was quantified using flow cytometry. Data are shown as mean ± standard deviation of three biological replicates. The degree of correlation was analyzed with linear regression and is shown as goodness-of-fit (R2) and significance of non-zero slope (P). c Biodistribution of EVs in mice. NMRI mice were intraperitoneally injected with d-luciferin substrate. Five minutes later, mice were intravenously injected with the same amount of engineered EVs (based on Tluc activity) and imaged with IVIS. Subsequently, major organs were collected for ex vivo bioluminescence measurements. Representative IVIS images are shown. N = 3. d Tluc activity in organs ex vivo after IVIS. Results are shown as mean ± standard deviation of three mice. e Scheme of generating albumin-binding EVs. EVs were collected from HEK-293T cells stably expressing the fusion proteins. f Albumin-binding EVs were injected intravenously and their concentration in plasma was determined. Data are shown as mean ± standard deviation. N = 7 (for TSPAN2-related) or 3 (for TSPAN3-related). g Scheme of sLeX display on EVs. EVs were collected from HEK-293T cells stably expressing the components. h HUVEC cells were activated by TNF-α for 2 h and treated with EVs for 6 h. Cellular mNG MFI was quantified using flow cytometry and is shown as fold-change over un-activated cells. c, e, g Created with BioRender.com. Data are shown as mean ± standard deviation of three biological replicates. Two-sided Student’s t test. Source data are provided as a Source Data file.

References

    1. Van Niel, G., D’Angelo, G. & Raposo, G. Shedding light on the cell biology of extracellular vesicles. Nat. Rev. Mol. Cell Biol.19, 213–228 (2018). - PubMed
    1. Wiklander OPB, Brennan M, Lötvall J, Breakefield XO, Andaloussi SEL. Advances in therapeutic applications of extracellular vesicles. Sci. Transl. Med. 2019;11:1–16. doi: 10.1126/scitranslmed.aav8521. - DOI - PMC - PubMed
    1. Couch Y, et al. A brief history of nearly EV-erything - the rise and rise of extracellular vesicles. J. Extracell. Vesicles. 2021;10:e12144. doi: 10.1002/jev2.12144. - DOI - PMC - PubMed
    1. Herrmann IK, Wood MJA, Fuhrmann G. Extracellular vesicles as a next-generation drug delivery platform. Nat. Nanotechnol. 2021;16:748–759. doi: 10.1038/s41565-021-00931-2. - DOI - PubMed
    1. Cheng, L. & Hill, A. F. Therapeutically harnessing extracellular vesicles. Nat. Rev. Drug Discov.21, 379–399 (2022). - PubMed

Publication types