. 2023 Aug 7;14(1):4729.
doi: 10.1038/s41467-023-40519-z.

Cas9-mediated knockout of Ndrg2 enhances the regenerative potential of dendritic cells for wound healing

Affiliations

Cas9-mediated knockout of Ndrg2 enhances the regenerative potential of dendritic cells for wound healing

Dominic Henn et al. Nat Commun. .

Abstract

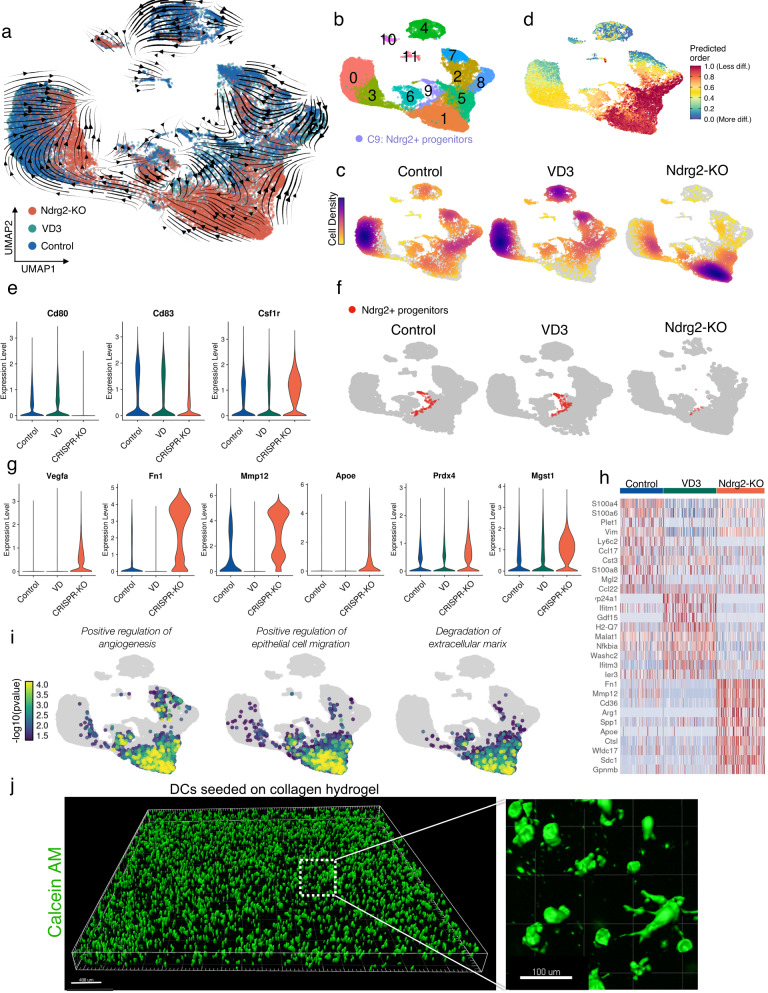
Chronic wounds impose a significant healthcare burden to a broad patient population. Cell-based therapies, while having shown benefits for the treatment of chronic wounds, have not yet achieved widespread adoption into clinical practice. We developed a CRISPR/Cas9 approach to precisely edit murine dendritic cells to enhance their therapeutic potential for healing chronic wounds. Using single-cell RNA sequencing of tolerogenic dendritic cells, we identified N-myc downregulated gene 2 (Ndrg2), which marks a specific population of dendritic cell progenitors, as a promising target for CRISPR knockout. Ndrg2-knockout alters the transcriptomic profile of dendritic cells and preserves an immature cell state with a strong pro-angiogenic and regenerative capacity. We then incorporated our CRISPR-based cell engineering within a therapeutic hydrogel for in vivo cell delivery and developed an effective translational approach for dendritic cell-based immunotherapy that accelerated healing of full-thickness wounds in both non-diabetic and diabetic mouse models. These findings could open the door to future clinical trials using safe gene editing in dendritic cells for treating various types of chronic wounds.


Conflict of interest statement

The authors declare no competing interests.

Figures

Fig. 1
Fig. 1. Ndrg2 inhibition in dendritic cells using vitamin D3 promotes endothelial tube formation in co-cultures.
a Single-cell RNA sequencing (scRNA-seq) of vitamin D3 (VD3) stimulated and untreated bone marrow-derived dendritic cells (BM-DCs) (10X Genomics Chromium), cells colored by experimental group. b Cells colored by Seurat clusters. Premat = premature. c Vegfa and Ndrg2 expression projected onto UMAP embedding in untreated and VD3 stimulated cells. d Subset of cluster 6 showing Ndrg2+ progenitor cells, colored by experimental group. e Expression of Ndrg2 (red) and Cd34, Itgae, and Flt3 (blue) projected onto UMAP embedding of cluster 6 subset. Right column shows merged expression of Ndrg2 and co-expressed genes. f Flow cytometry of untreated and VD3 stimulated BM-DCs, gated on CD34, CD103, and CD135. g Schematic of co-culture experiments using BM-DCs and human umbilical vein endothelial cells (HUVECs). h Endothelial tube formation after co-culture of endothelial cells together with untreated DCs or VD3 and lipopolysaccharide (LPS) stimulated DCs. DCs were stained with calcein red, ECs were stained with calcein AM (green). Cell nuclei were stained with Hoechst (blue). Scale bar: 200 µm. Bottom row shows binary images created using the Angiogenesis Analyzer. i, Analysis of HUVEC branch number, branch length (pixels), junction number and total mesh area (pixels), (n = 3 biological replicates, one-way analysis (ANOVA) with Tukey’s multiple comparisons test: *P < 0.05, **P < 0.01, ***P < 0.001. Data are presented as mean values ± SEM.). j Luminex multiplex ELISA showing protein expression of 33 differentially expressed proteins in cell culture media of untreated DCs and of DCs stimulated with either VD3, LPS or VD3 and LPS (one-way analysis (ANOVA) with Tukey’s multiple comparisons test: **P < 0.01, ****P < 0.0001, n = 3 biological replicates. Data are presented as mean values ± SEM). Source data are provided as a Source Data file.
Fig. 2
Fig. 2. Development of a CRISPR/Cas9 platform for knockout of Ndrg2 in primary dendritic cells.
a Schematic for Cas9 ribonucleoprotein (RNP) nucleofection of primary dendritic cells (DCs). b Schematic of the Ndrg2 gene. Gray rectangles indicate exon regions. The sequences of the 3 single-guide RNAs (sgRNAs) targeting Ndrg2 (Ndrg2_1, Ndrg2_2, Ndrg2_3) are indicated in red, blue, and green. c Flow cytometry of untreated (wild-type, WT) DCs (negative control), DCs transfected with green fluorescent protein (GFP)-fused deactivated Cas9 (dCas9-GFP), and GFP-mRNA (positive control), indicating a high (93%) transfection efficiency of primary DCs with Cas9 protein. d Percentage of indels per given fragment size after Cas9 nucleofection of DCs. e Immunofluorescent staining for Ndrg2 in control and CRISPR-edited (Ndrg2-KO) cells (Student’s t-test, unpaired and two-tailed: ***P = 0.0003, n = 6 biological replicates. Data are presented as mean values ± SEM.) Scale bar: 100 µm. f Coverage and reads generated by ultra-deep whole genome sequencing (100X) at the Ndrg2 on-target site for CRISPR-edited (red) and wild-type (blue) DCs. The difference in coverage between the groups is denoted in black. Vertical black lines indicate the 3 sgRNA cut sites. g Circle plots indicating different groups of on-target and h off-target consequences in CRISPR-edited cells (legend). White lines indicate the numbers of different consequences per group. Source data are provided as a Source Data file.
Fig. 3
Fig. 3. Ndrg2-knockout prevents dendritic cells maturation and induces regenerative gene expression profiles.
a UMAP embedding of single-cell RNA sequencing (scRNA-seq) data from Ndrg2-KO dendritic cells (DCs), vitamin D3 (VD3) stimulated DCs, and untreated cells. RNA velocity stream vectors computed with scVelo are projected onto the embedding. Cells colored by experimental group (23,871 cells). b Cells colored by Seurat cluster. Cluster 9 represents Ndrg2+ progenitor cells. c UMAP embedding split by experimental condition, and cells colored by cell density. In each plot, cells of the indicated condition are colored in yellow/violet and cells of the other two conditions are colored in gray. d UMAP embedding colored by CytoTRACE score indicating cell differentiation states; diff. = differentiated. e Violin plots of DC maturation markers. f UMAP embedding split by experimental condition. Ndrg2+ progenitor cells (cluster 9) colored in red. g Violin plots of wound healing-related markers. h Heatmap of the top 10 differentially expressed genes per cluster, sorted by average log fold-change and ordered by experimental condition. i Overrepresentation analysis (ORA) of the indicated gene sets (GO-BP) projected on the UMAP embedding. j Ndrg2-KO cells seeded on collagen-pullulan hydrogels stained with calcein AM. 3D reconstruction of stacked confocal microscopy images. Scale bars: 400 µm in overview, 100 µm in magnified image.
Fig. 4
Fig. 4. Hydrogel delivery of Ndrg2-KO dendritic cells promotes healing of diabetic and non-diabetic wounds.
a Schematic of cell seeding experiments on excisional wounds in wild-type mice (n = 5 per group). b Wounds treated with Ndrg2-KO dendritic cells (DCs) healed significantly faster and were completely re-epithelialized on day 11, 5 days faster than wounds treated with control DCs (nucleofection with 3 non-targeting sgRNAs) or blank hydrogels. c Masson’s trichrome staining of explanted wound tissue (day 16) of the three groups. Zoomed-in panels show the regenerated epidermis. d Left: Relative wound area over time (Two-way analysis of variance (ANOVA) with Tukey’s multiple comparisons test: Day 4: *P < 0.05, day 11: **P < 0.01, day 12: *P < 0.05, day 14: *P < 0.05, Ndrg2-KO: n = 8 biological replicates, Control: n = 8 biological replicates, Blank: n = 10 biological replicates. Data are presented as mean values ± SEM.), Right: Probability of wound closure in the three groups (reverse Kaplan–Meier estimate, ****P < 0.0001, n = 5 biological replicates per group). e Comparison of dermal thickness of wound tissue from the three experimental groups. One-way analysis of variance (ANOVA) with Tukey’s multiple comparisons test: ****P < 0.0001, **P = 0.02, n = 12 biological replicates for Ndrg2-KO, n = 11 biological replicates for Control, n = 5 biological replicates for Blank. Data are presented as mean values ± SEM. f Immunofluorescent staining, and quantification of wound tissue for CD31 marking blood vessels. One-way analysis of variance (ANOVA) with Tukey’s multiple comparisons test: *P < 0.05, Ndrg2-KO: n = 5 biological replicates, Control: n = 10 biological replicates, Blank: n = 8 biological replicates. Data are presented as mean values ± SEM. Scale bars: 200 µm in overview, 100 µm in magnified images. g Schematic of cell seeding experiments on excisional wounds in diabetic mice. h Wounds treated with Ndrg2-KO DCs healed significantly faster and were epithelialized on day 16, 5 days faster than wounds treated with control DCs or blank hydrogels. i Relative wound area over time in diabetic wounds. Two-way analysis of variance (ANOVA) with Tukey’s multiple comparisons test: Day 13: *P < 0.05, day 16: *P = 0.05, day 19: **P = 0.01, n = 5 biological replicates per group. Data are presented as mean values ± SEM. j Immunofluorescent staining, and quantification of diabetic wound tissue (day 21) for CD31. One-way analysis of variance (ANOVA) with Tukey’s multiple comparisons test: *P < 0.05, n = 7 biological replicates for Ndrg2-KO, n = 4 biological replicates for Control, n = 7 biological replicates for Blank. Scale bars: 200 µm in overview, 100 µm in magnified images. Data are presented as mean values ± SEM. Source data are provided as a Source Data file.
Fig. 5
Fig. 5. Ndrg2-KO dendritic cells target wound fibroblasts via growth factor signaling.
a Schematic of cell seeding experiments to analyze wound tissue using single-cell RNA sequencing (scRNA-seq). b UMAP embedding of cells from all three conditions, colored by cell type. c Cells colored by experimental conditions. d Numbers of differentially expressed genes (DEG) colored by cell type (adjusted p-value < 0.05, FC > 0.5). Differentially expressed genes were determined using a Wilcoxon Rank Sum test and P-values were adjusted using the Benjamini–Hochberg procedure as part of the Seurat package. e Volcano plot showing significantly deregulated genes across all cell types. Right half of plot shows cells isolated from wounds treated with Ndrg2-KO dendritic cells (DCs); left half of plot shows cells isolated from control wounds; cells are colored by cell type as in b and d. f Subset of fibroblasts for all three conditions. g Expression of wound healing-related genes projected onto fibroblast subset UMAP embedding and as violin plots. h Heatmaps showing the expression of outgoing signaling pathways in Ndrg2-KO DCs (left) and control DCs (right) that target wound cells (integrated scRNA-seq data of Figs. 3 and 5). i Interaction strength with wound cells across differentially regulated signaling pathways for Ndrg2-KO DCs (top) and control cells (bottom). j VEGF signaling between Ndrg2-KO DCs and fibroblasts (not significant for control DCs). k IGF signaling in wounds treated with Ndrg2-KO DCs (left) or control DCs (right). l PDGF signaling in wounds treated with Ndrg2-KO DCs (left) or control DCs (right). m SPP1 signaling in wounds treated with Ndrg2-KO DCs (left) or control DCs (right).

References

    1. Sen CK, et al. Human skin wounds: a major and snowballing threat to public health and the economy. Wound Repair Regen. 2009;17:763–771. - PMC - PubMed
    1. Nussbaum SR, et al. An economic evaluation of the impact, cost, and medicare policy implications of chronic nonhealing wounds. Value Health. 2018;21:27–32. - PubMed
    1. desJardins-Park, H. E., Gurtner, G. C., Wan, D. C. & Longaker, M. T. From chronic wounds to scarring: the growing healthcare burden of under- and over-healing wounds. Adv. Wound Care.10.1089/wound.2021.0039 (2021). - PMC - PubMed
    1. Veith AP, Henderson K, Spencer A, Sligar AD, Baker AB. Therapeutic strategies for enhancing angiogenesis in wound healing. Adv. Drug Deliv. Rev. 2019;146:97–125. - PMC - PubMed
    1. Sivaraj D, et al. Hydrogel scaffolds to deliver cell therapies for wound healing. Front. Bioeng. Biotechnol. 2021;9:660145. - PMC - PubMed

Publication types