. 2023 Aug 7;14(1):4746.
doi: 10.1038/s41467-023-40439-y.

Combining gut microbiota modulation and chemotherapy by capecitabine-loaded prebiotic nanoparticle improves colorectal cancer therapy

Affiliations

Combining gut microbiota modulation and chemotherapy by capecitabine-loaded prebiotic nanoparticle improves colorectal cancer therapy

Tianqun Lang et al. Nat Commun. .

Abstract

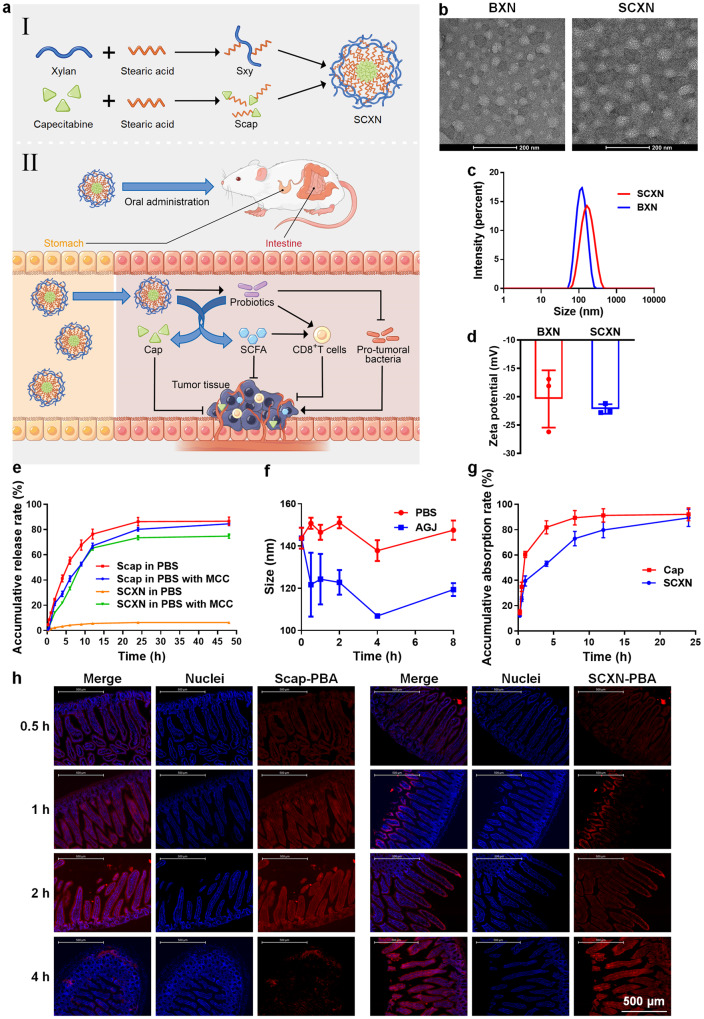
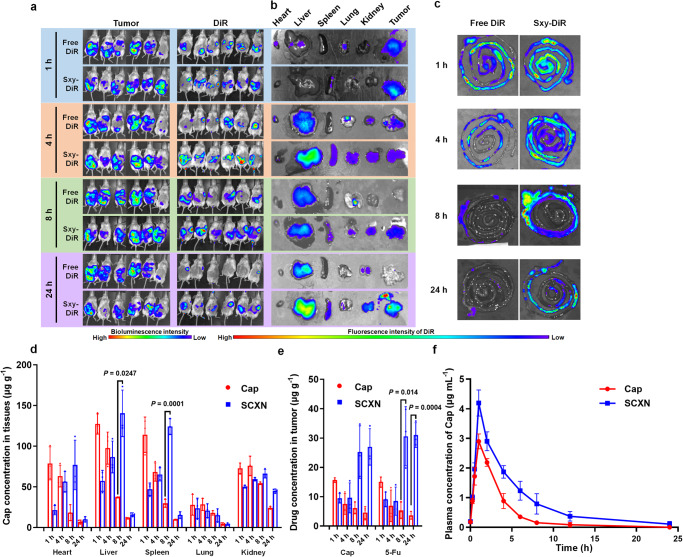
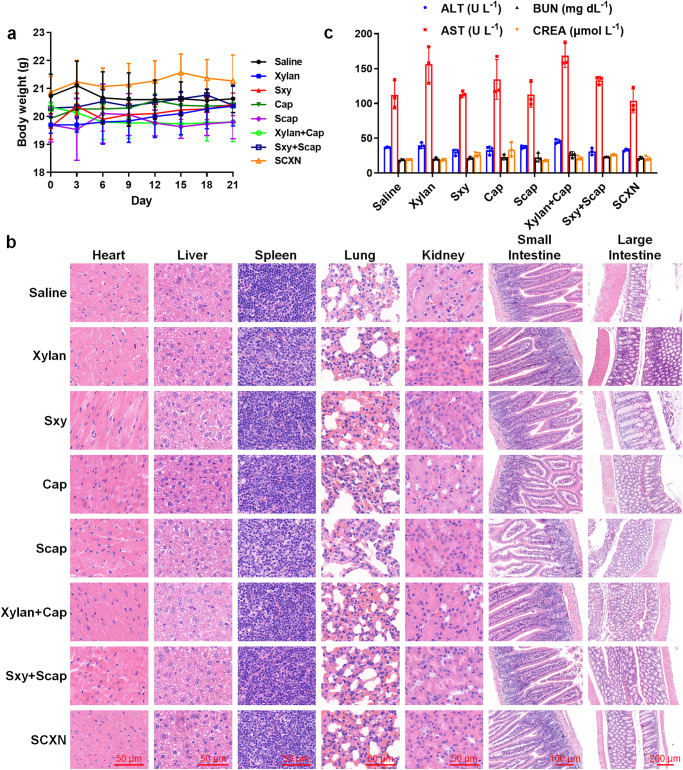
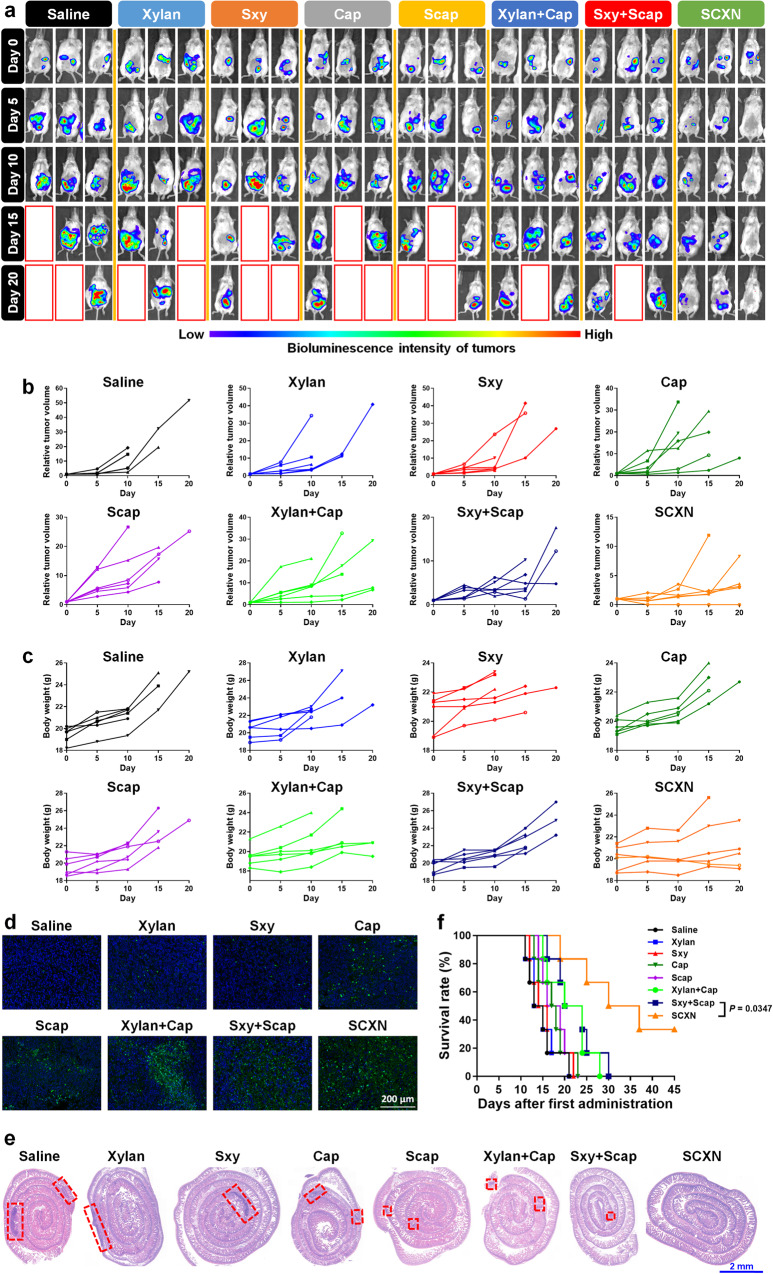
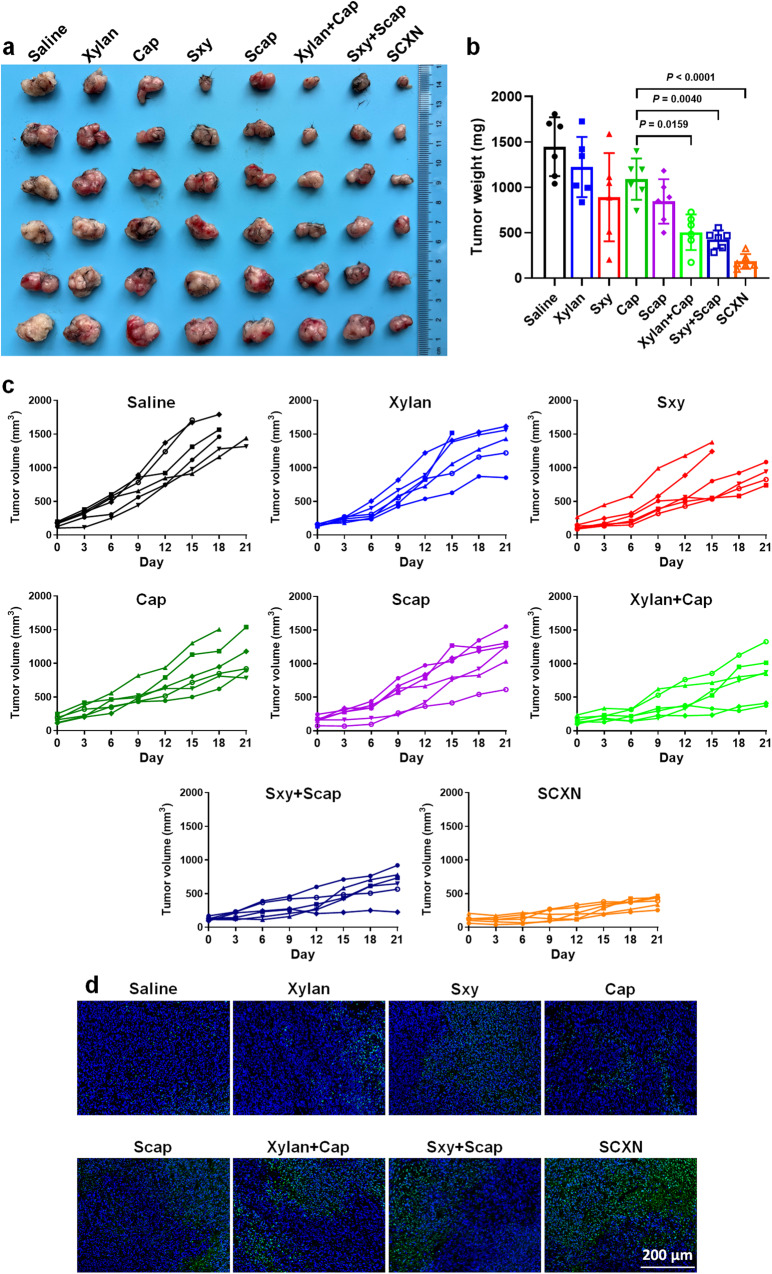
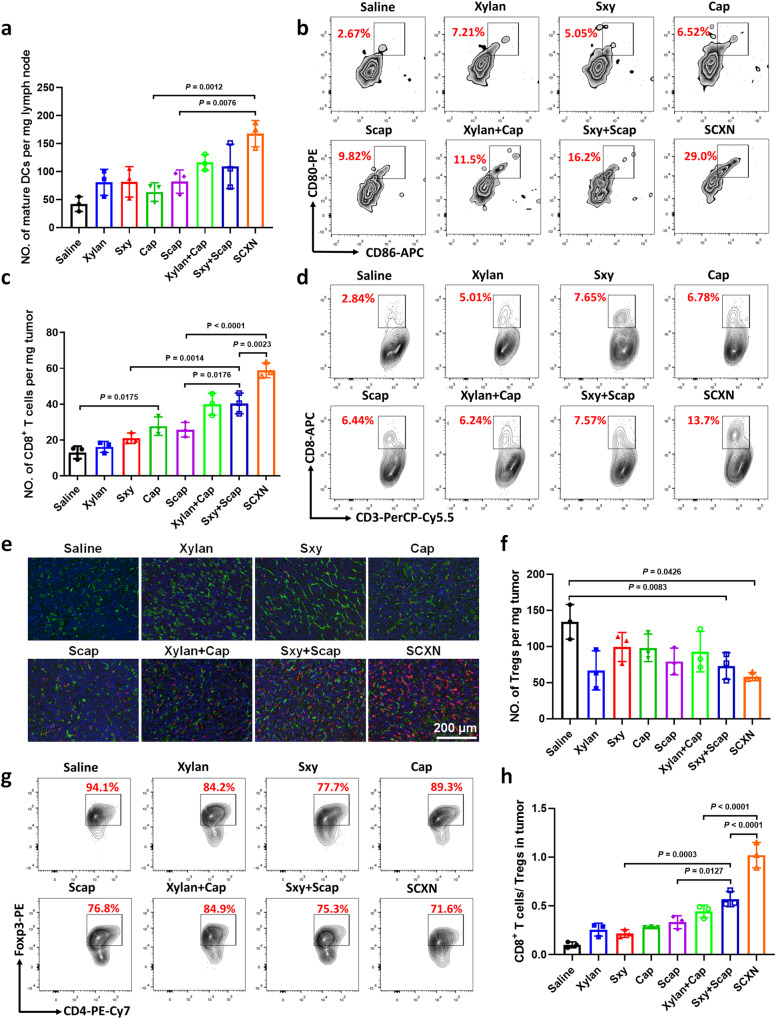
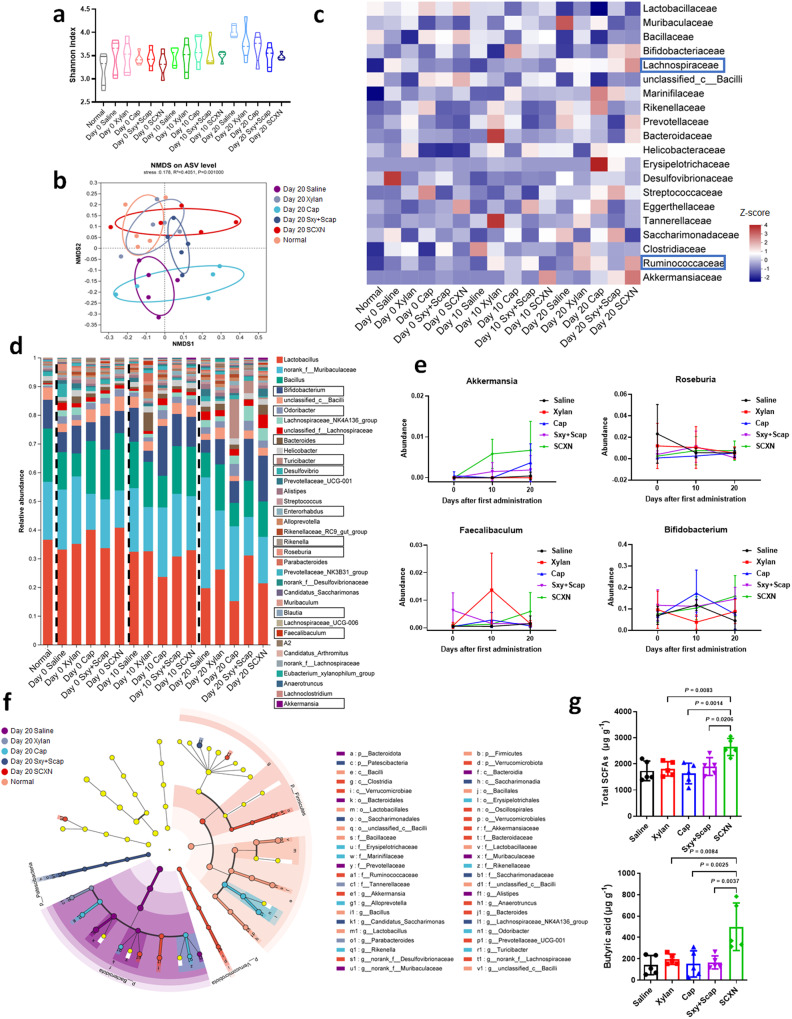
Colorectal cancer (CRC) therapy efficiency can be influenced by the microbiota in the gastrointestinal tract. Compared with traditional intervention, prebiotics delivery into the gut is a more controllable method for gut microbiota modulatory therapy. Capecitabine (Cap), the first-line chemotherapeutic agent for CRC, lacks a carrier that can prolong its half-life. Here, we construct a Cap-loaded nanoparticle using the prebiotic xylan-stearic acid conjugate (SCXN). The oral administration of SCXN delays the drug clearance in the blood and increases the intra-tumoral Cap concentration in the CRC mouse model. SCXN also facilitates the probiotic proliferation and short chain fatty acid production. Compared with free Cap, SCXN enhances the anti-tumor immunity and increases the tumor inhibition rate from 5.29 to 71.78%. SCXN exhibits good biocompatibility and prolongs the median survival time of CRC mice from 14 to 33.5 d. This prebiotics-based nanoparticle provides a promising CRC treatment by combining gut microbiota modulation and chemotherapy.


Conflict of interest statement

The authors declare no competing interests.

Figures

Fig. 1
Fig. 1. Construction and characterization of the Scap-loaded Sxy nanoparticle (SCXN).
a Schematic illustration of combining chemotherapy and gut microbiota regulation for CRC treatment by SCXN. b Transmission electron microscopy images of the blank Sxy nanoparticle (BXN) and SCXN. Scale bars: 200 nm. For each group, 3 independent samples were tested, and 1 representative image is shown. c Size distribution of BXN and SCXN. d Zeta potentials of BXN and SCXN. e Drug release curves of free Scap and SCXN in phosphate buffered saline (PBS; pH 7.4) with or without mouse caecal content (MCC). f Variation of particle sizes of SCXN in PBS at pH 7.4 and artificial gastric juice (AGJ) from 0 to 8 h. g Cap absorption curves in the small intestine after the oral administration of free Cap or SCXN in mice. h Distribution of the 1-pyrenebutyric acid (PBA)-labelled Scap (Scap-PBA)-loaded Sxy nanoparticle (SCXN-PBA) and free Scap-PBA along the villi of jejunum at different time points after oral administration. Scale bar: 500 μm. Data represent the mean ± SD. For each group, n = 3 independent samples in (cg), and n = 3 mice in h. Source data are provided as a Source Data file.
Fig. 2
Fig. 2. Biodistribution and pharmacokinetics of SCXN.
a In vivo bioluminescence images of tumors (left) and the fluorescence of 1,1’-dioctadecyl-3,3,3’,3’-tetramethylindotricarbocyanine iodide (DiR) (right) in CT26-luc tumor-bearing mice at 1, 4, 8, and 24 h after the oral administrated of free DiR or DiR-loaded Sxy nanoparticle (Sxy-DiR). Six biological replicates are shown. b Ex vivo fluorescent images of tissues from CT26 tumor-bearing mice at 1, 4, 8, and 24 h after orally administrated with free DiR or Sxy-DiR. c Ex vivo fluorescent images of intestines from CT26 tumor-bearing mice at 1, 4, 8, and 24 h after the oral administration of free DiR or Sxy-DiR. d The content of Cap in different organs at 1, 4, 8, and 24 h after the oral administration of free Cap or SCXN in CT26 tumor-bearing mice. e Content of Cap and 5-Fu in tumors at 1, 4, 8, and 24 h after the oral administration of free Cap or SCXN in CT26 tumor-bearing mice. f Plasma concentration-time curves of Cap after the oral administration of free Cap or SCXN in mice. Data represent the mean ± SD (n = 3 mice). Statistical significance was calculated using unpaired two-sided t-test, with Welch’s correction when variances are not equal. Source data are provided as a Source Data file.
Fig. 3
Fig. 3. Biocompatibility evaluation in healthy mice receiving multi-dose treatments with different formulations.
a Mice body weight variation during the treatment period. b Images of the hematoxylin and eosin (H&E)-stained sections of main organs. Scale bar: 50, 100, or 200 μm. c Biochemical parameters in blood. ALT alanine aminotransferase, AST aspartate aminotransferase, BUN blood urea nitrogen, CREA creatinine. Data represent the mean ± SD (n = 3 mice). Source data are provided as a Source Data file.
Fig. 4
Fig. 4. In vivo anti-tumor effects in CT26-luc tumor-bearing mice receiving multi-dose treatments of different formulations.
a In vivo bioluminescence imaging using an in vivo imaging system (IVIS). Three representative mice of each group are shown. Six biological replicates are conducted and shown in Supplementary Fig. 3. Red line boxes denote the dead mice. b Variation in relative tumor volumes calculated according to the amount of photons during the therapy period. c Variation in body weights during the therapy period. d Deoxynucleotidyl transferase-mediated dUTP-biotin nick end labeling (TUNEL) immunofluorescence examination of the CT26-luc tumor sections. Scale bar: 200 μm. e H&E-stained intestine sections from the CT26-luc tumor-bearing mice at the end of the therapy period. Red dot line boxes denote the tumor burdens. Scale bar: 2 cm. f Survival curves of mice within 45 d post the 1st administration. Data represent the mean ± SD. For each group, n = 6 mice in (ac) and (f), and n = 3 mice in (d and e). A two-sided log-rank (Mantel–Cox) test was used for the statistical comparison of the survival study. Source data are provided as a Source Data file.
Fig. 5
Fig. 5. In vivo anti-tumor effects in MC38 tumor-bearing mice receiving multi-dose treatments of different formulations.
a, b Tumor images (a) and average tumor weights (b) on day 21. c Variation in tumor volumes during the therapy period. d TUNEL immunofluorescence examination of MC38 tumor sections. Scale bar: 200 μm. Data represent the mean ± SD. For each group, n = 6 mice in (ac), and n = 3 mice in (d). Statistical significance was calculated using one-way ANOVA with Tukey’s multiple comparisons test. Source data are provided as a Source Data file.
Fig. 6
Fig. 6. SCXN promotes the anti-tumor immune responses.
Analysis of the numbers of immune cells in CT-26 tumor-bearing mice treated with multi-doses of different formulations via flow cytometry or immunofluorescence assay. a, b Numbers (a) and percentages (b) of mature dendritic cells (DCs; CD80+CD86+ cells gated on CD11c+ cells) in draining lymph nodes. c Numbers of the CD8+ T cells per mg of tumor. d Percentage of CD8+ T cells in the total CD3+ cell population in tumors. e Immunofluorescence images of tumor sections to examine the CD8+ T cells (red fluorescence) infiltration. Green fluorescence: CD31. Scale bar: 200 μm. f, g Numbers (f) and percentage (g) of regulatory T cells (Tregs, CD4+Foxp3+ cells gated on CD3+CD4+ cells) in tumors. h Ratio of CD8+ T cells to Tregs in tumors. Data represent the mean ± SD (n = 3 mice). Statistical significance was calculated using one-way ANOVA with Tukey’s multiple comparisons test. Source data are provided as a Source Data file.
Fig. 7
Fig. 7. Regulating gut microbiota by SCXN.
CT-26 tumor-bearing mice were treated with different formulations for 20 d and fecal samples were collected for 16 S rDNA sequencing before (Day 0), in the middle of (Day 10), and at the end of (Day 20) the treatment. a Microbial α-diversity in terms of Shannon index at the ASV level. b Microbial β-diversity NMDS analysis based on Bray-Curtis distance at the ASV level at the end of the treatment. c Heatmap showing relative abundance of the gut microbiota at the family level (displayed as normalized Z-score). d Barplot showing relative abundance of the gut microbiota at the genus level. e Change of the relative abundance of Akkermansia, Roseburia, Fecalibaculum, and Bifidobacterium during 20-day treatment process. f LefSe analysis cladogram representing the significantly different taxas between different groups from phylum to genus levels at the end of the treatment (LDA > 2, p < 0.05). g Summary of fecal SCFA levels and butyric levels in feces from CT26 tumor-bearing mice after different treatments. Data represent the mean ± SD (n = 5 mice). Statistical significance was calculated using one-way ANOVA with Tukey’s multiple comparisons test. Source data are provided as a Source Data file.

References

    1. Siegel RL, et al. Colorectal cancer statistics, 2020. CA Cancer J. Clin. 2020;70:145–164. - PubMed
    1. Sung, H. et al. Global cancer statistics 2020: GLOBOCAN estimates of incidence and mortality worldwide for 36 cancers in 185 countries. CA Cancer J. Clin. 71, 209–249 (2021). - PubMed
    1. Ghani S, et al. Recent developments in antibody derivatives against colorectal cancer; a review. Life Sci. 2021;265:118791. - PubMed
    1. Song WT, et al. Synergistic and low adverse effect cancer immunotherapy by immunogenic chemotherapy and locally expressed PD-L1 trap. Nat. Commun. 2018;9:2237. - PMC - PubMed
    1. Jackson MA, et al. Gut microbiota associations with common diseases and prescription medications in a population-based cohort. Nat. Commun. 2018;9:2655. - PMC - PubMed

Publication types