. 2023 Aug 7;14(1):4751.
doi: 10.1038/s41467-023-39746-1.

Urbanisation generates multiple trait syndromes for terrestrial animal taxa worldwide

Amy K Hahs #  1 Bertrand Fournier #  2 Myla F J Aronson  3 Charles H Nilon  4 Adriana Herrera-Montes  5 Allyson B Salisbury  6 Caragh G Threlfall  7   8 Christine C Rega-Brodsky  9 Christopher A Lepczyk  10 Frank A La Sorte  11 Ian MacGregor-Fors  12 J Scott MacIvor  13 Kirsten Jung  14 Max R Piana  15 Nicholas S G Williams  16 Sonja Knapp  17   18   19 Alan Vergnes  20 Aldemar A Acevedo  21 Alison M Gainsbury  22 Ana Rainho  23 Andrew J Hamer  24 Assaf Shwartz  25 Christian C Voigt  26 Daniel Lewanzik  26 David M Lowenstein  27 David O'Brien  28 Desiree Tommasi  29 Eduardo Pineda  30 Ela Sita Carpenter  31 Elena Belskaya  32 Gábor L Lövei  33   34 James C Makinson  35 Joanna L Coleman  36 Jon P Sadler  37 Jordan Shroyer  4 Julie Teresa Shapiro  38 Katherine C R Baldock  39   40   41 Kelly Ksiazek-Mikenas  42 Kevin C Matteson  43 Kyle Barrett  44 Lizette Siles  45 Luis F Aguirre  46 Luis Orlando Armesto  47 Marcin Zalewski  48 Maria Isabel Herrera-Montes  49 Martin K Obrist  50 Rebecca K Tonietto  51 Sara A Gagné  52 Sarah J Hinners  53 Tanya Latty  54 Thilina D Surasinghe  55 Thomas Sattler  56 Tibor Magura  34   57 Werner Ulrich  58 Zoltan Elek  59 Jennifer Castañeda-Oviedo  60 Ricardo Torrado  61 D Johan Kotze #  62 Marco Moretti #  63
Affiliations

Urbanisation generates multiple trait syndromes for terrestrial animal taxa worldwide

Amy K Hahs et al. Nat Commun. .

Abstract

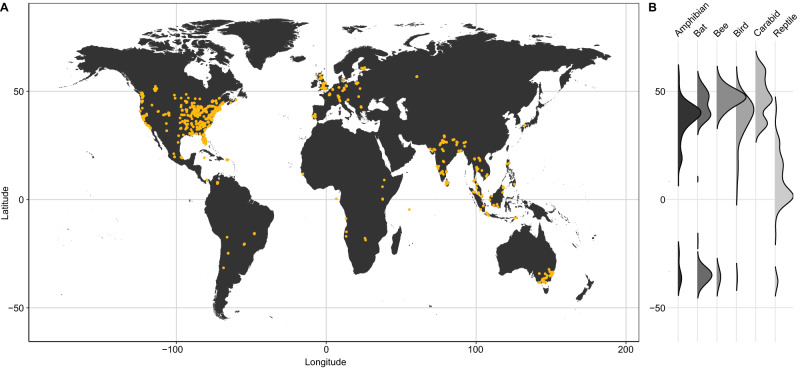
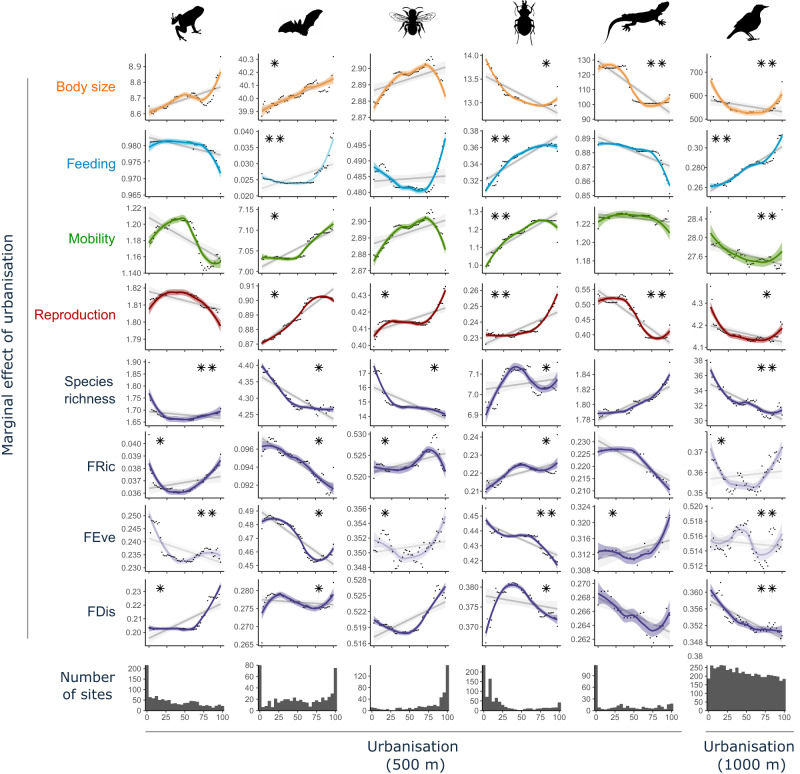
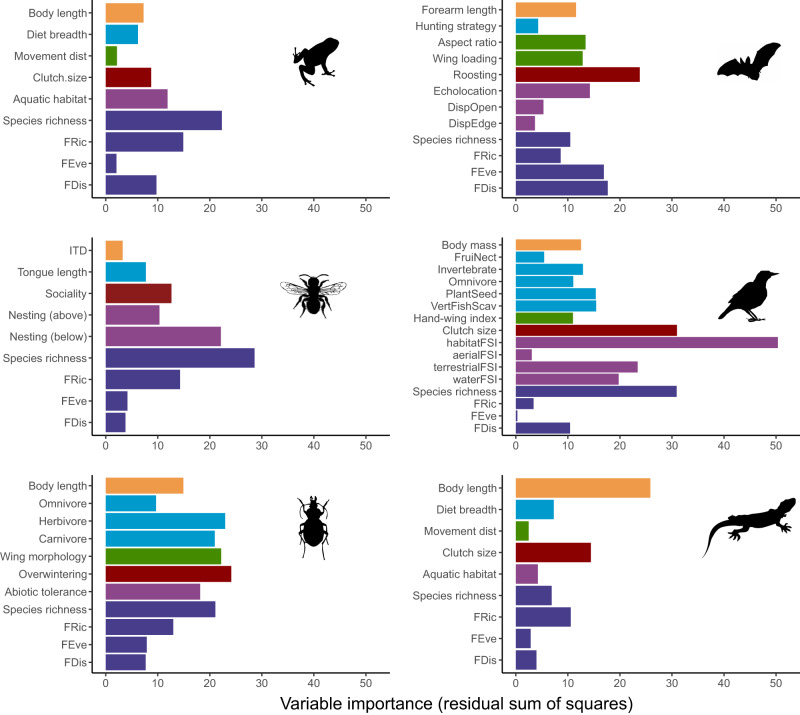
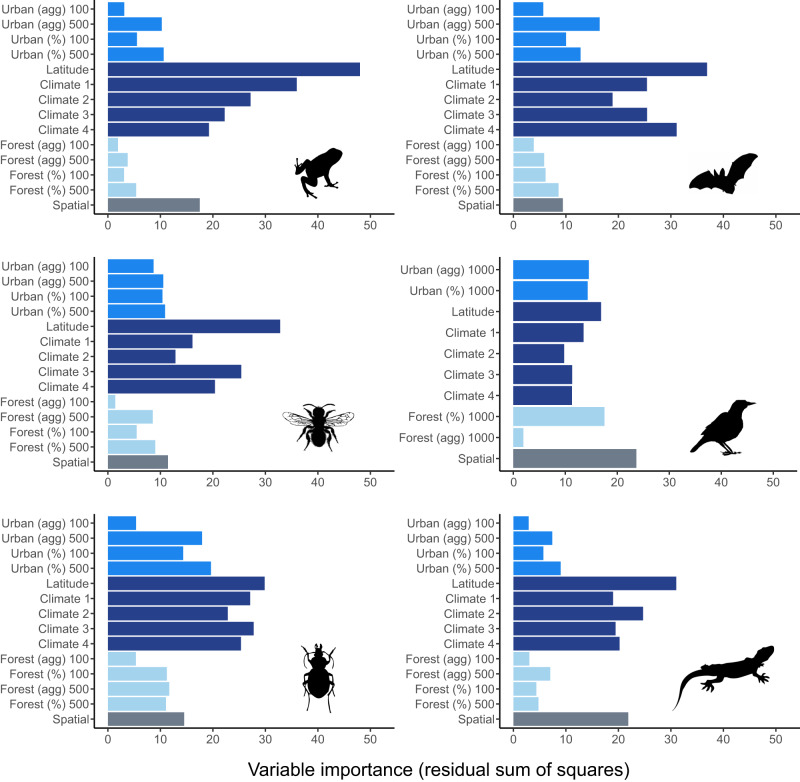
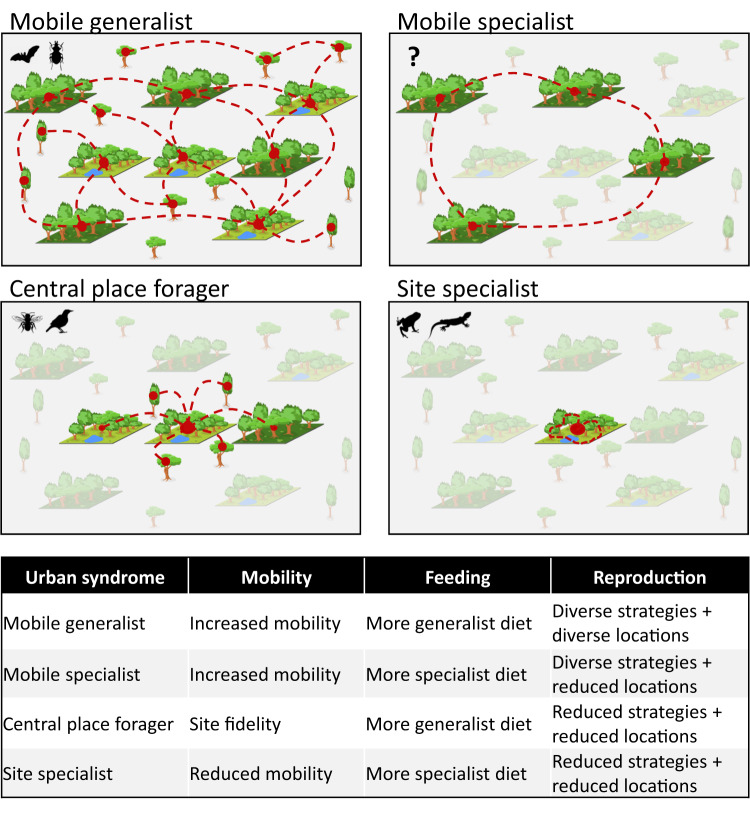
Cities can host significant biological diversity. Yet, urbanisation leads to the loss of habitats, species, and functional groups. Understanding how multiple taxa respond to urbanisation globally is essential to promote and conserve biodiversity in cities. Using a dataset encompassing six terrestrial faunal taxa (amphibians, bats, bees, birds, carabid beetles and reptiles) across 379 cities on 6 continents, we show that urbanisation produces taxon-specific changes in trait composition, with traits related to reproductive strategy showing the strongest response. Our findings suggest that urbanisation results in four trait syndromes (mobile generalists, site specialists, central place foragers, and mobile specialists), with resources associated with reproduction and diet likely driving patterns in traits associated with mobility and body size. Functional diversity measures showed varied responses, leading to shifts in trait space likely driven by critical resource distribution and abundance, and taxon-specific trait syndromes. Maximising opportunities to support taxa with different urban trait syndromes should be pivotal in conservation and management programmes within and among cities. This will reduce the likelihood of biotic homogenisation and helps ensure that urban environments have the capacity to respond to future challenges. These actions are critical to reframe the role of cities in global biodiversity loss.


Conflict of interest statement

The authors declare no competing interests.

Figures

Fig. 1
Fig. 1. Global distribution of data included in this study.
A Locations of sampling plots (orange dots) for all six taxonomic groups combined. All data are from the UrBioNet contributor network except for birds (eBird). B Ridgeline plots show the density of sampling locations per taxon as a function of latitude. See Supplementary Fig. 1 for taxon-specific maps.
Fig. 2
Fig. 2. Predicted changes in trait values per taxon along an urbanisation gradient.
Partial dependence plots showing the urbanisation-induced shifts in community functional metrics for six taxonomic groups. The partial dependence plots summarise the marginal effect that urbanisation (x-axis = percentage of urbanised area in a 500 m radius around the sampling plot; or 1000 m for birds) has on the predicted values of each community-level trait (i.e. effect of urbanisation when climate, latitude and forest cover are kept constant). The y-axes reflect the range of predicted values for each response variable (community-weighted mean trait values and diversity metrics) and are not zeroed so care should be taken when interpreting the magnitude of change. The fitted colour lines and 95% confidence bands around predicted values are from Local Polynomial Regression (LOESS). The grey lines and 95% confidence bands around predicted values (light grey) are from linear regressions based on the same data to indicate direction of trend. Trait definitions are provided in Supplementary Table 3 (briefly, Feeding: high values = generalist diet except for bats where feeding represents different hunting strategy; Mobility: high values = higher mobility; Reproduction: amphibians, birds and reptile = clutch size / other taxa = reproduction strategy). Note that for bees, the inter-tegula distance was used for body size and mobility, and therefore the model presented is the same for both traits. Functional dispersion (FDis), functional richness (FRic) and functional evenness (FEve) are defined in the method section in “Functional composition of animal communities” (see also Supplementary Fig. 2). Transparent shade represents models with <10% variance explained. Stars show the contribution of urbanisation to the overall model (* 20-50%; ** > 50%). Additional information on each models’ overall predictive power and the contribution of the percentage of urban land cover can be found in Table 1. Image credits: Ghedo and T. Michael Keesey (https://creativecommons.org/licenses/by-sa/3.0/) for reptile. Michael Keesey (vectorization); Thorsten Assmann, Jörn Buse, Claudia Drees, Ariel-Leib-Leonid Friedman, Tal Levanony, Andrea Matern, Anika Timm, and David W. Wrase (photography) (https://creativecommons.org/licenses/by/3.0) for carabid beetle. All other silhouette images come from www.phylopic.org and are public domain images.
Fig. 3
Fig. 3. Relative importance of the extent and aggregation of urban land cover as predictors of community means (colours show the different trait categories; Supplementary Table 3) and variability (FDis = functional dispersion, FRic = functional richness, and FEve = functional evenness; dark blue) of traits as well as species richness for each taxonomic group.
Variable importance was estimated using the residual sum of squares from random forests models. Average variable importance values weighted by the R2 of the test set of each individual model were computed to estimate urban land cover variable importance for each metric of community-weighted means and variability of traits. Longer bars indicate traits or functional diversity measures that are better predicted by urban land cover within the surrounding landscape. Image credits: Idem Fig. 2.
Fig. 4
Fig. 4. Relative importance of variables in predicting trait responses per taxon.
Importance of percent cover (%) and spatial aggregation (agg) of urban and forest land cover at different buffer distances (100 m and 500 m for most taxa; 1000 m for birds), latitude, climate PCA axes, and spatial covariates (dbMEM) as predictors of the trait syndrome (i.e. considering all community weighted means and functional diversity metrics) for each taxonomic group. Variable importance was estimated using the residual sum of squares from random forests models. Average values weighted by the R2 of the test set of each individual model were computed to estimate variable importance for the overall trait syndromes. Image credits: Idem Fig. 2.
Fig. 5
Fig. 5. Simplified representation of the four urban trait syndromes.
Two types of green habitat patches with different resources are represented in an otherwise mostly unsuitable urban matrix. Grey patches represent green habitats that are unusable for a specific taxon. Red dashed lines show typical movement pattern of taxa among patches. The landscapes of Fig. 5 and their individual elements were created by Bertrand Fournier using the basic set of tools available in the vector graphics open source software “Inkscape 1.2.2”. No previously-created elements were used. No images from a database were used. The landscapes of Fig. 5 and their individual elements were not published elsewhere. Image credits for taxa silhouettes: Idem Fig. 2.

References

    1. Soanes K, Lentini PE. When cities are the last chance for saving species. Front. Ecol. Environ. 2019;17:225–231.
    1. Spotswood EN, et al. The biological deserts fallacy: cities in their landscapes contribute more than we think to regional biodiversity. Bioscience. 2021;71:148–160. - PMC - PubMed
    1. United Nations. World Urbanization Prospects: The 2018 Revision. United Nations Department of Economic and Social Affairs. Population Division, New York (2019).
    1. Seto KC, Güneralp B, Hutyra LR. Global forecasts of urban expansion to 2030 and direct impacts on biodiversity and carbon pools. Proc. Nat. Acad. Sci. USA. 2012;109:16083–16088. - PMC - PubMed
    1. McDonald RI, et al. Research gaps in knowledge of the impact of urban growth on biodiversity. Nat. Sustain. 2020;3:16–24.

Publication types