. 2023 Aug;29(8):2057-2067.
doi: 10.1038/s41591-023-02482-6. Epub 2023 Aug 7.

Machine learning for genetics-based classification and treatment response prediction in cancer of unknown primary

Affiliations

Machine learning for genetics-based classification and treatment response prediction in cancer of unknown primary

Intae Moon et al. Nat Med. 2023 Aug.

Erratum in

Abstract

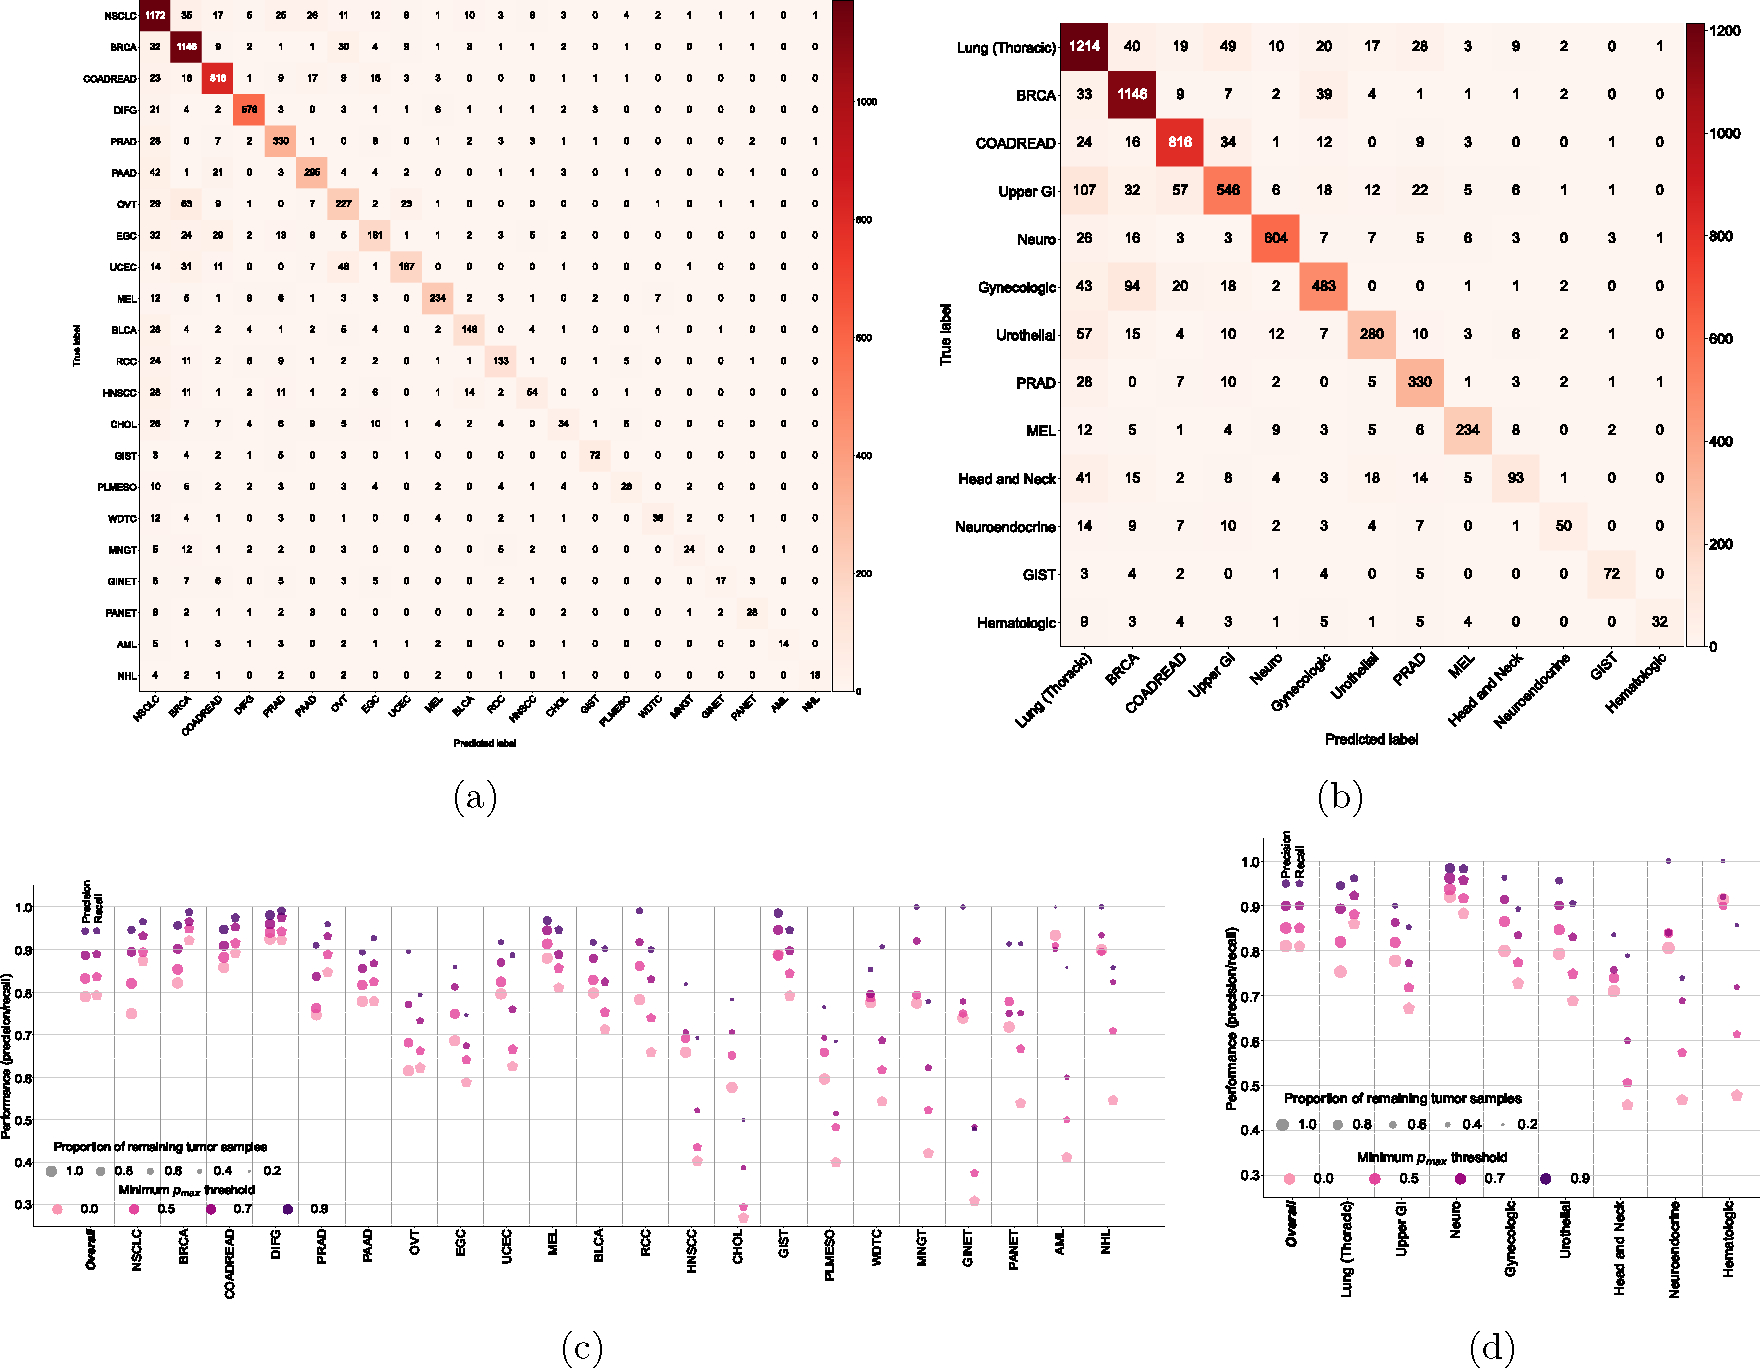
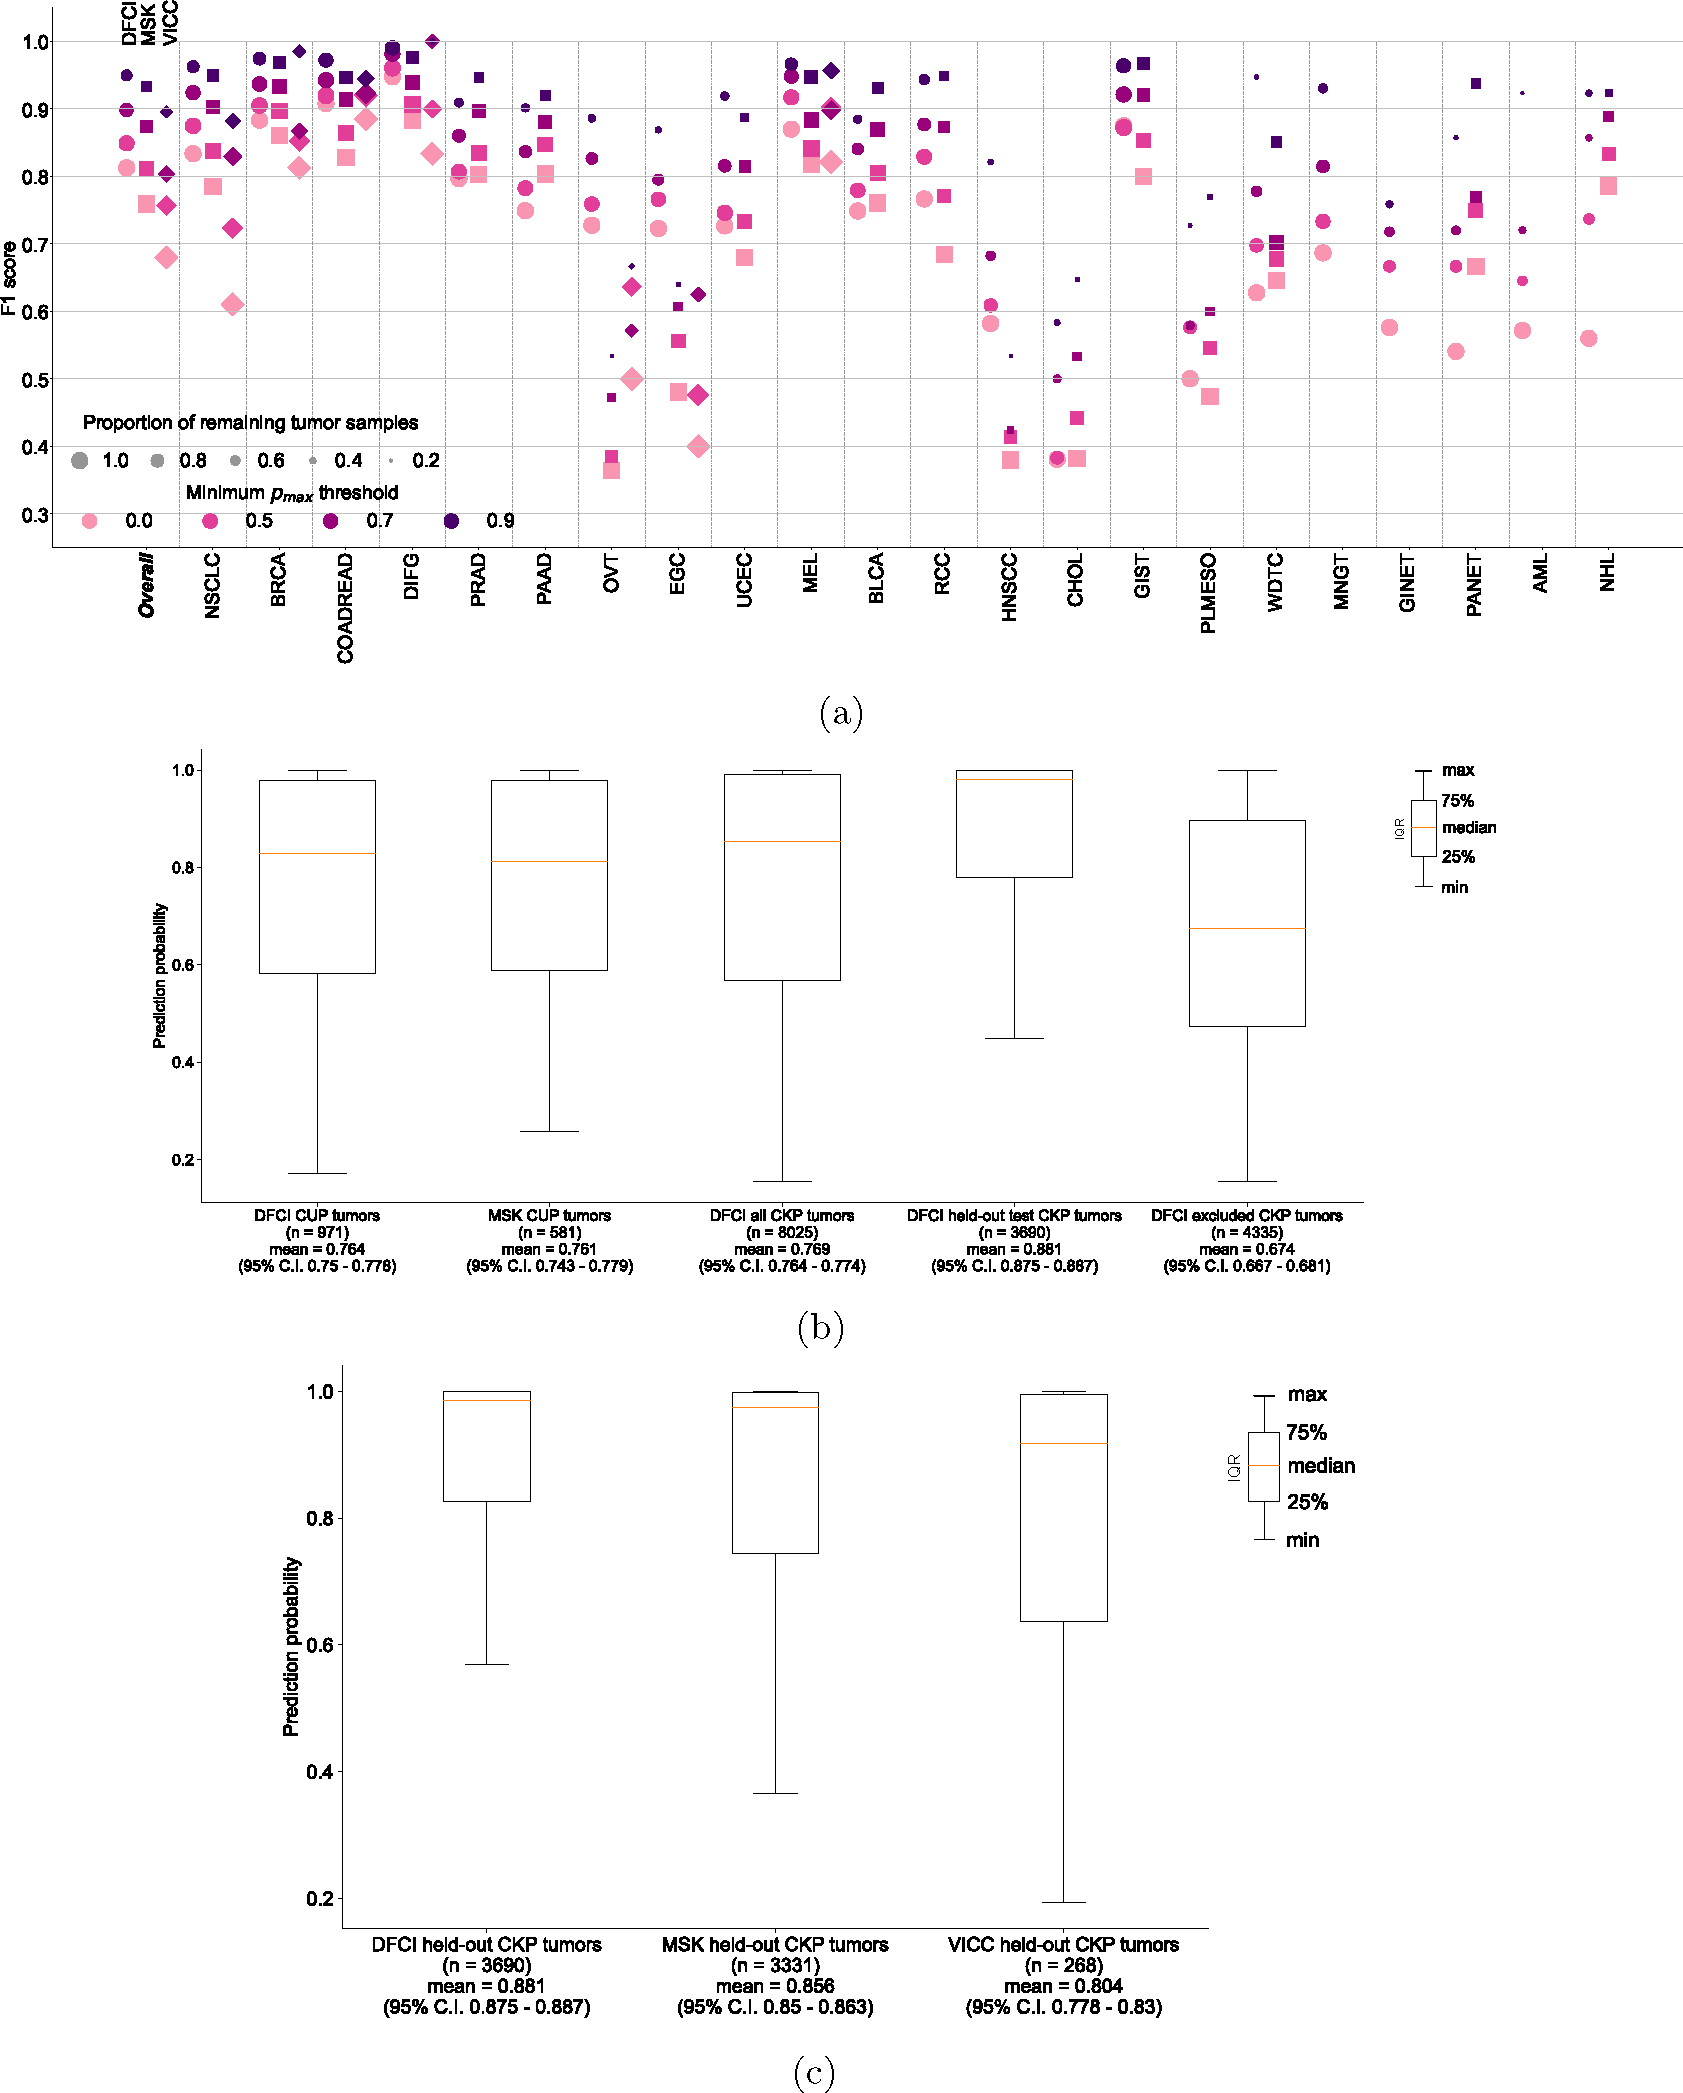
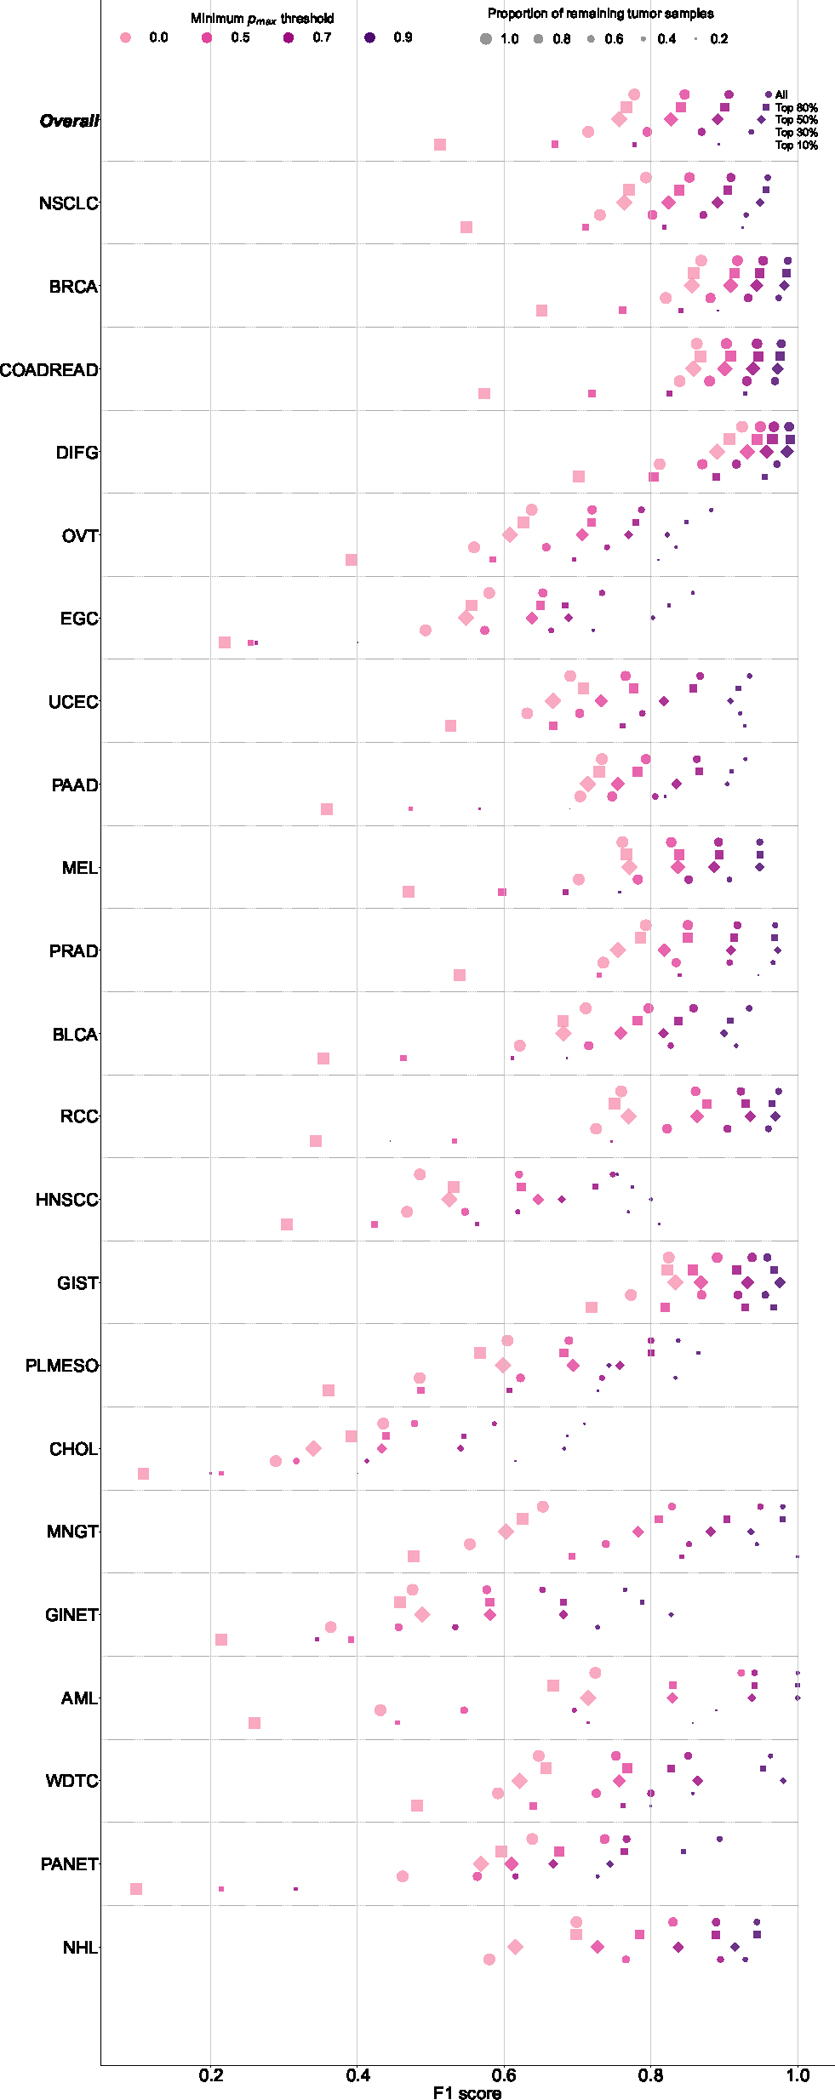
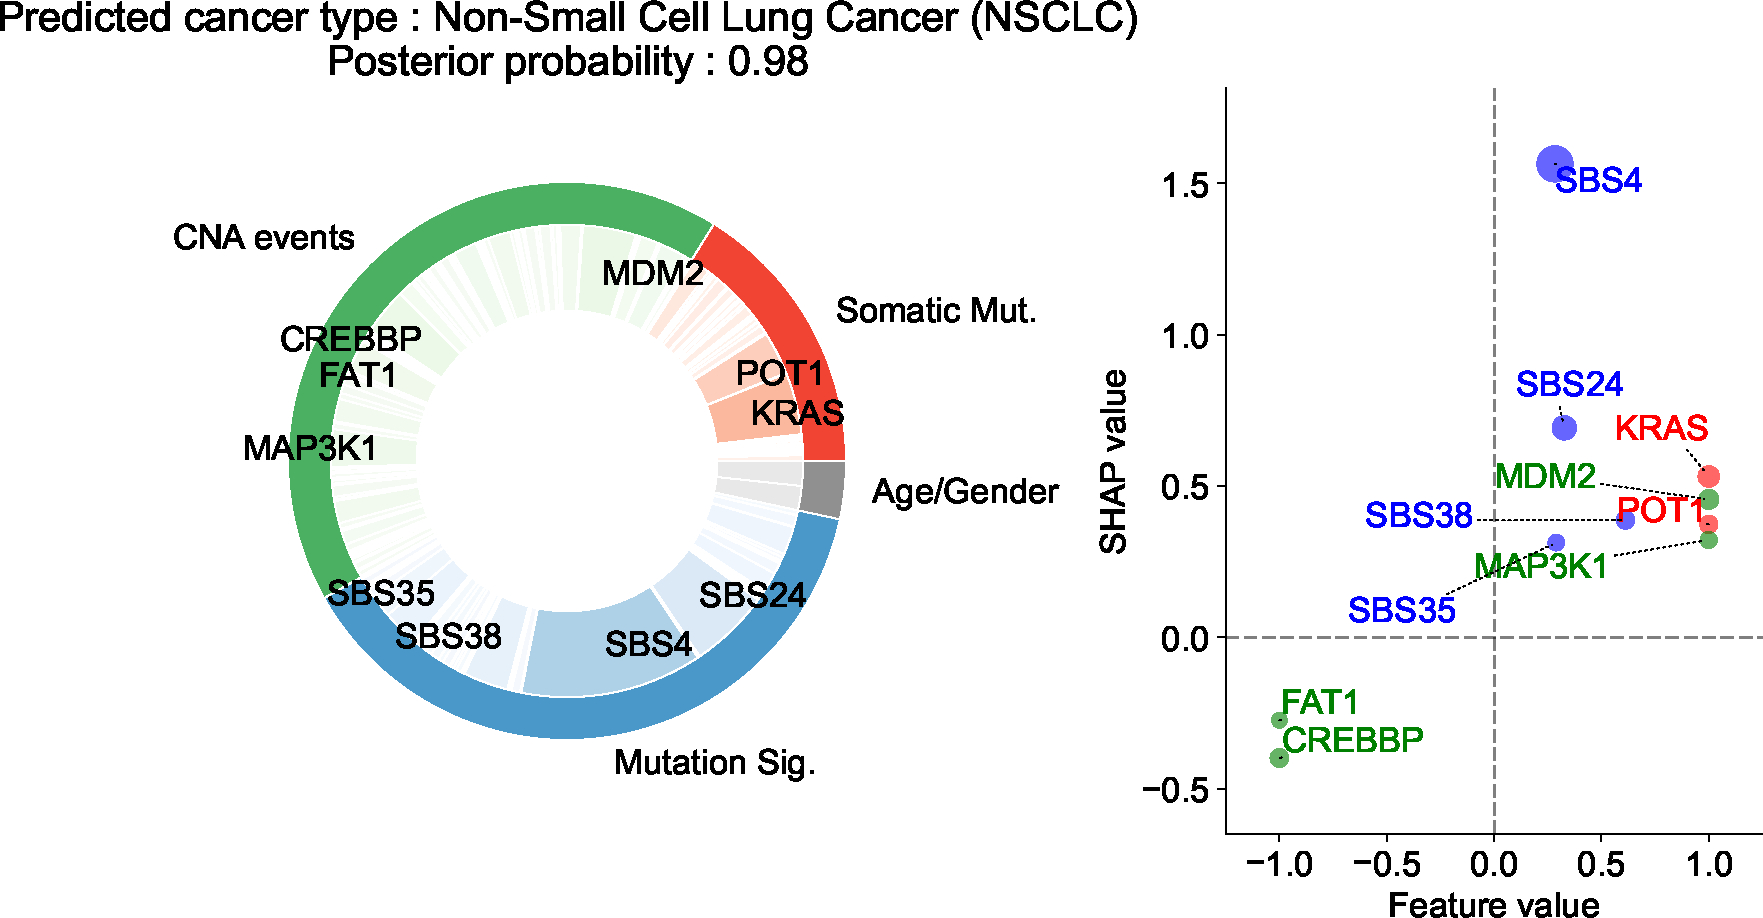
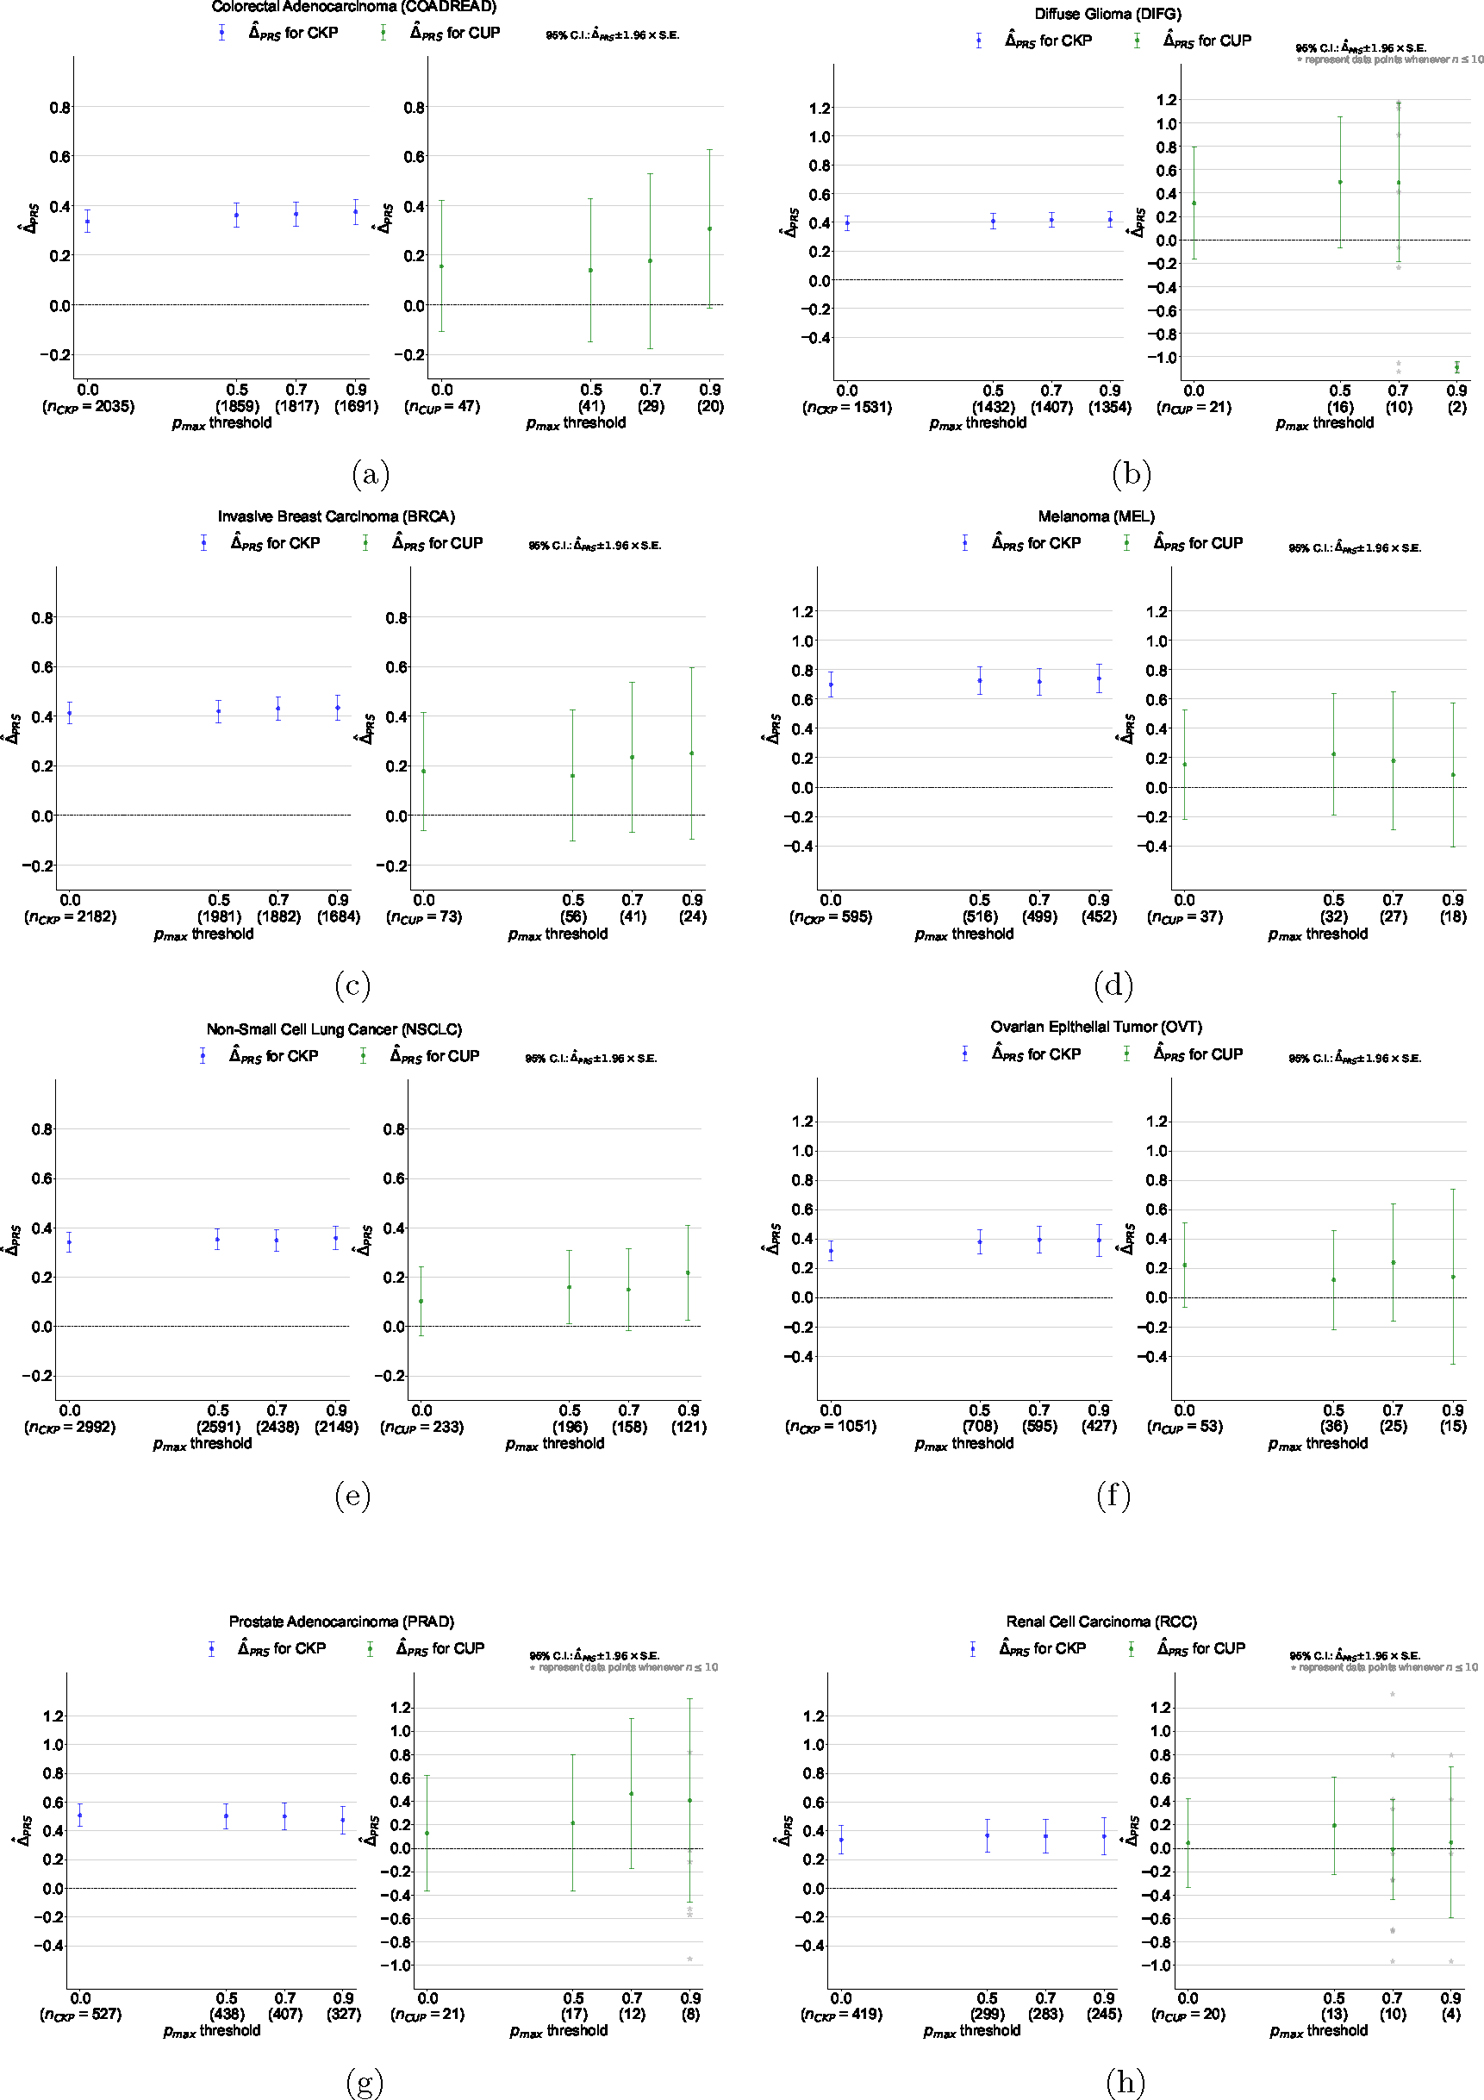
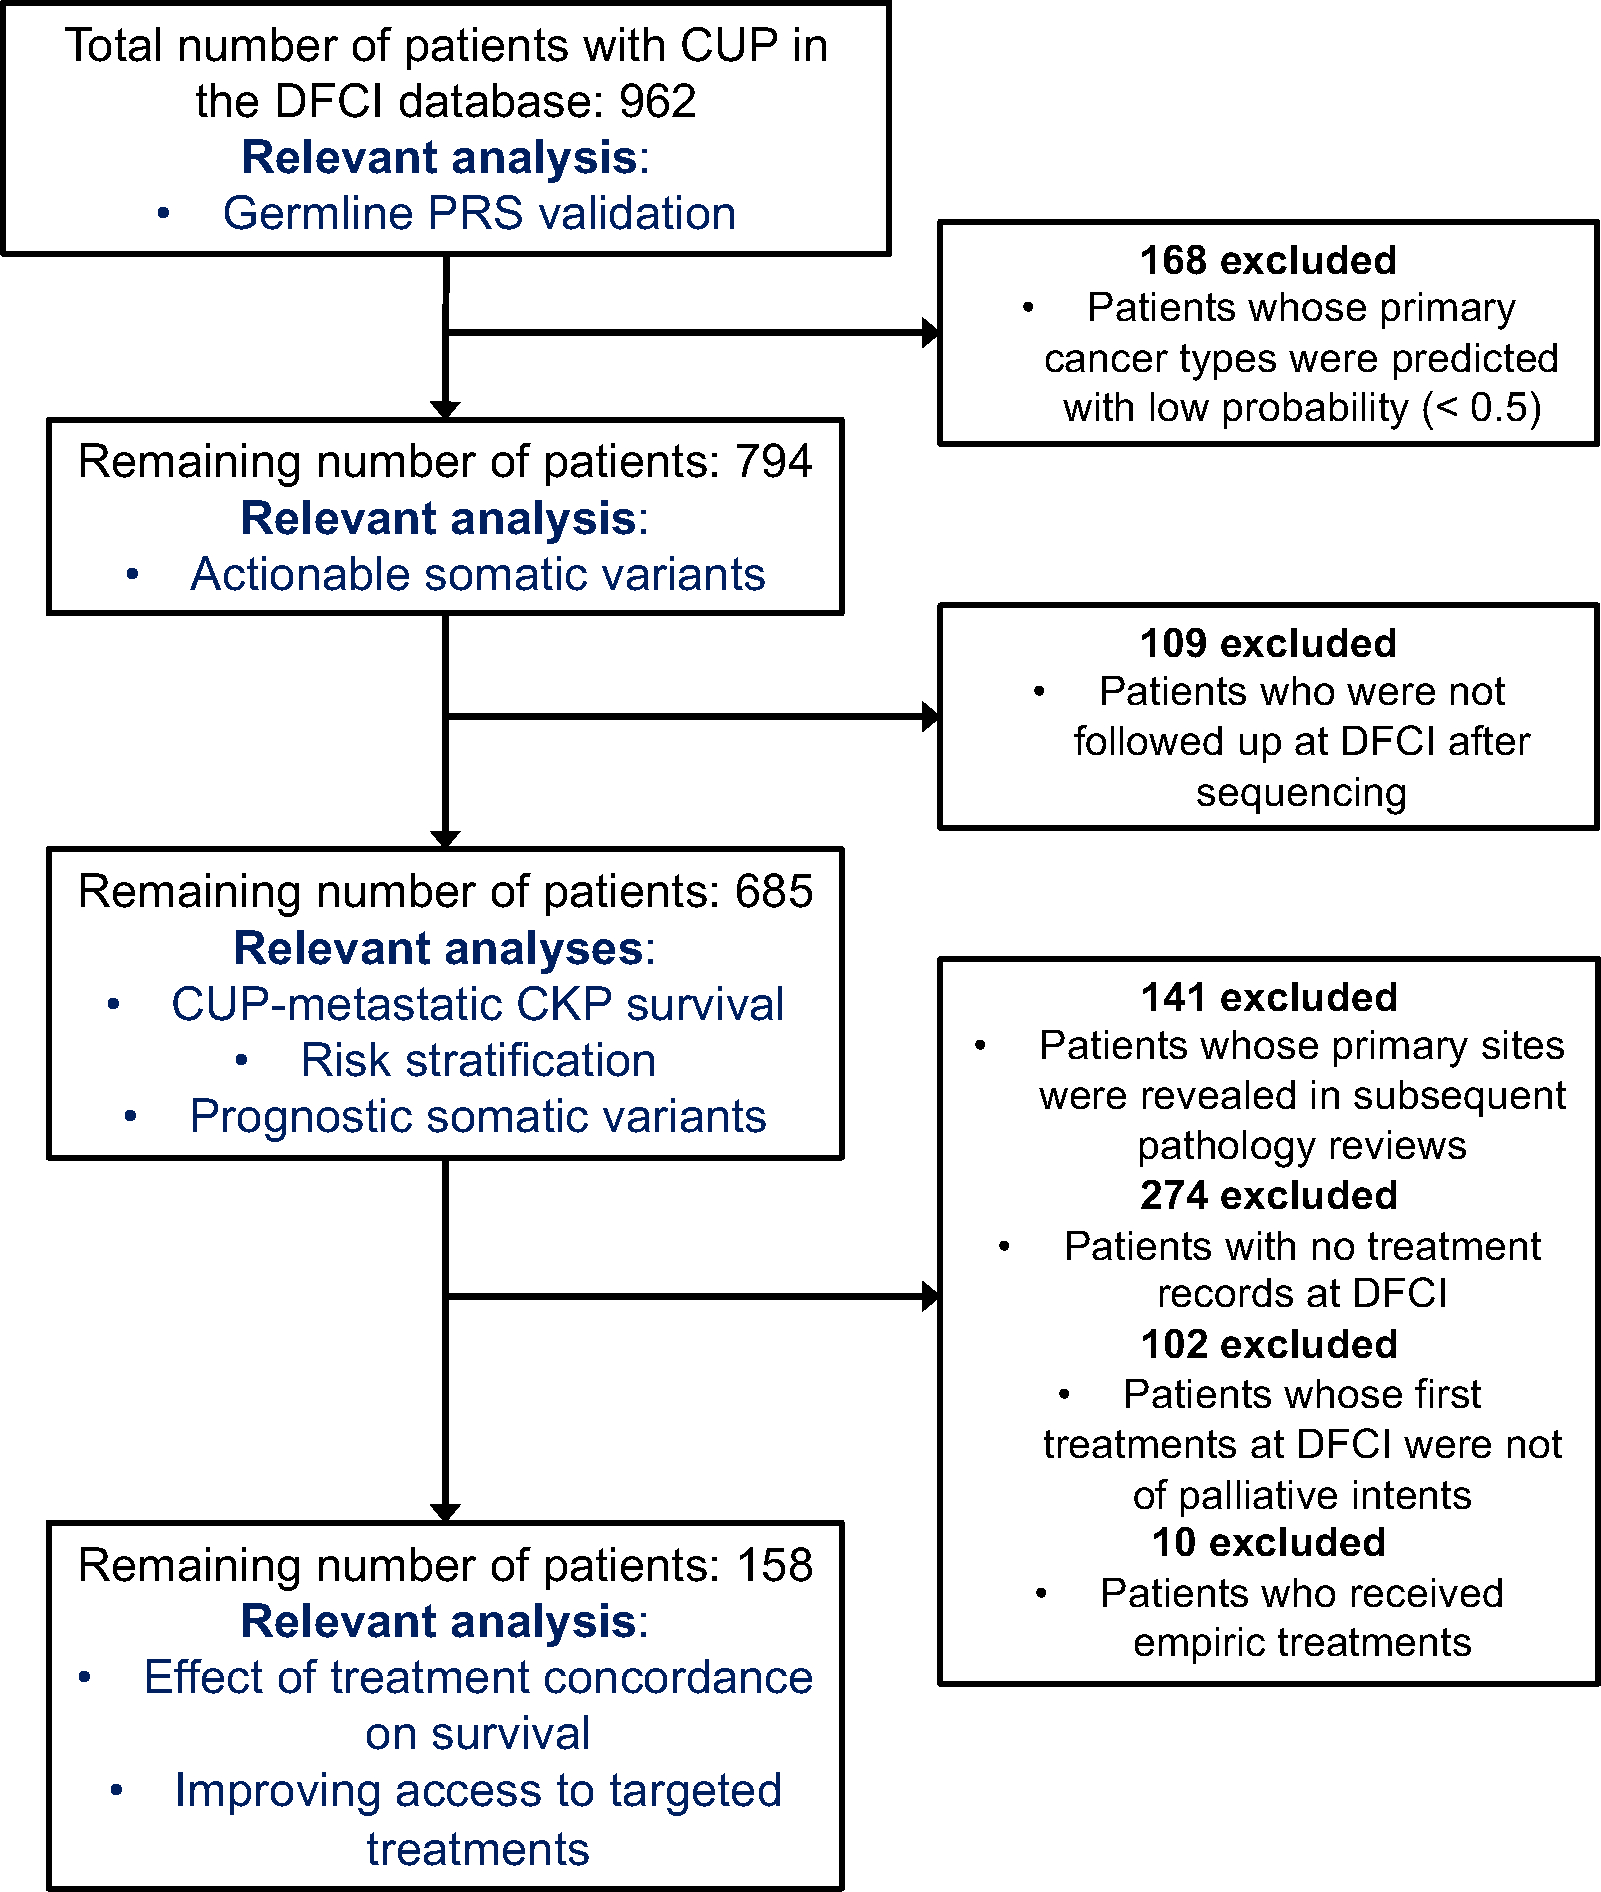
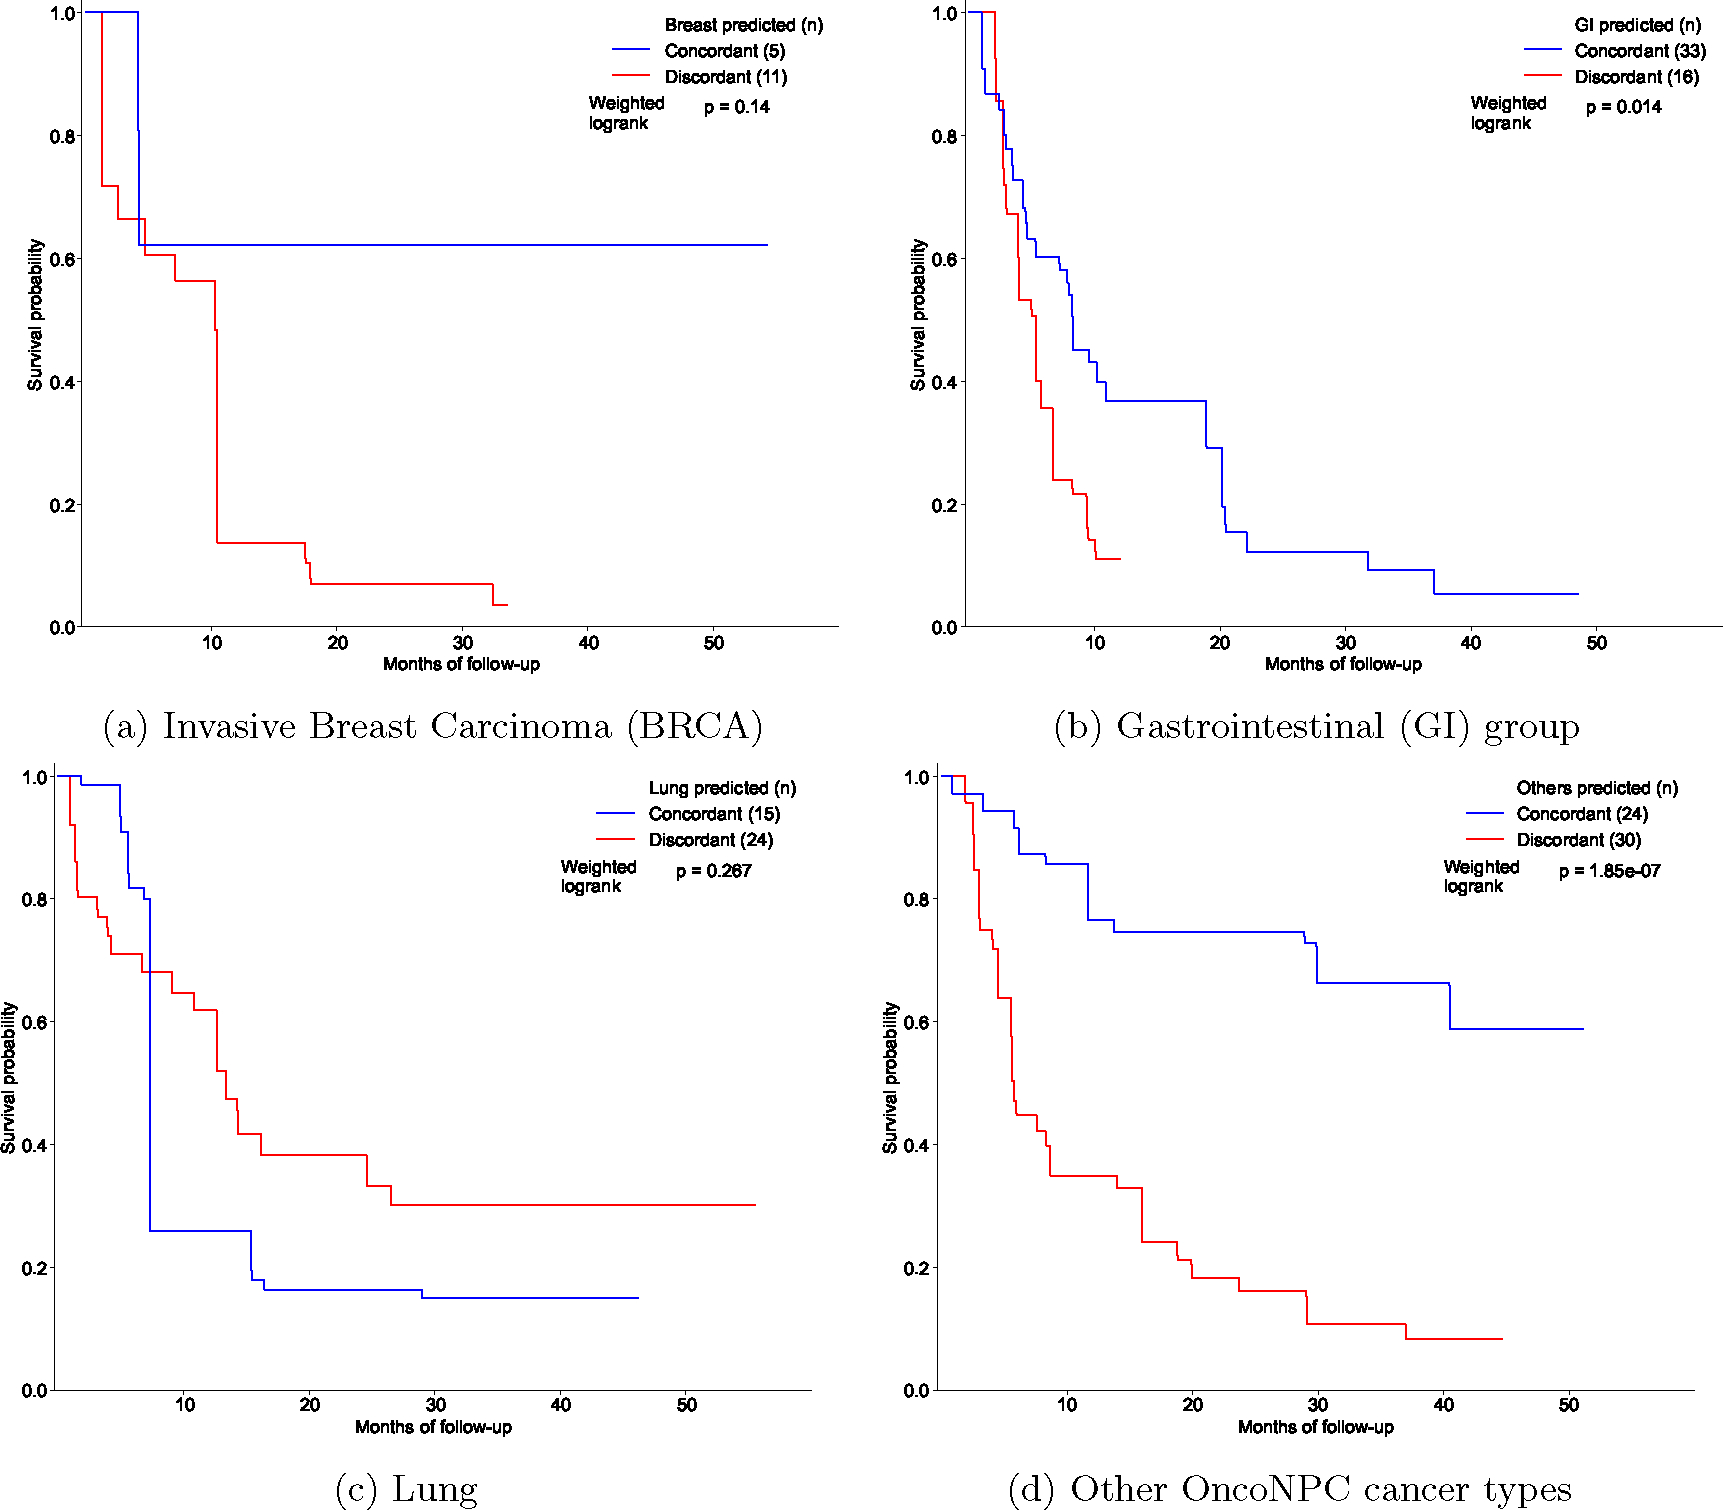
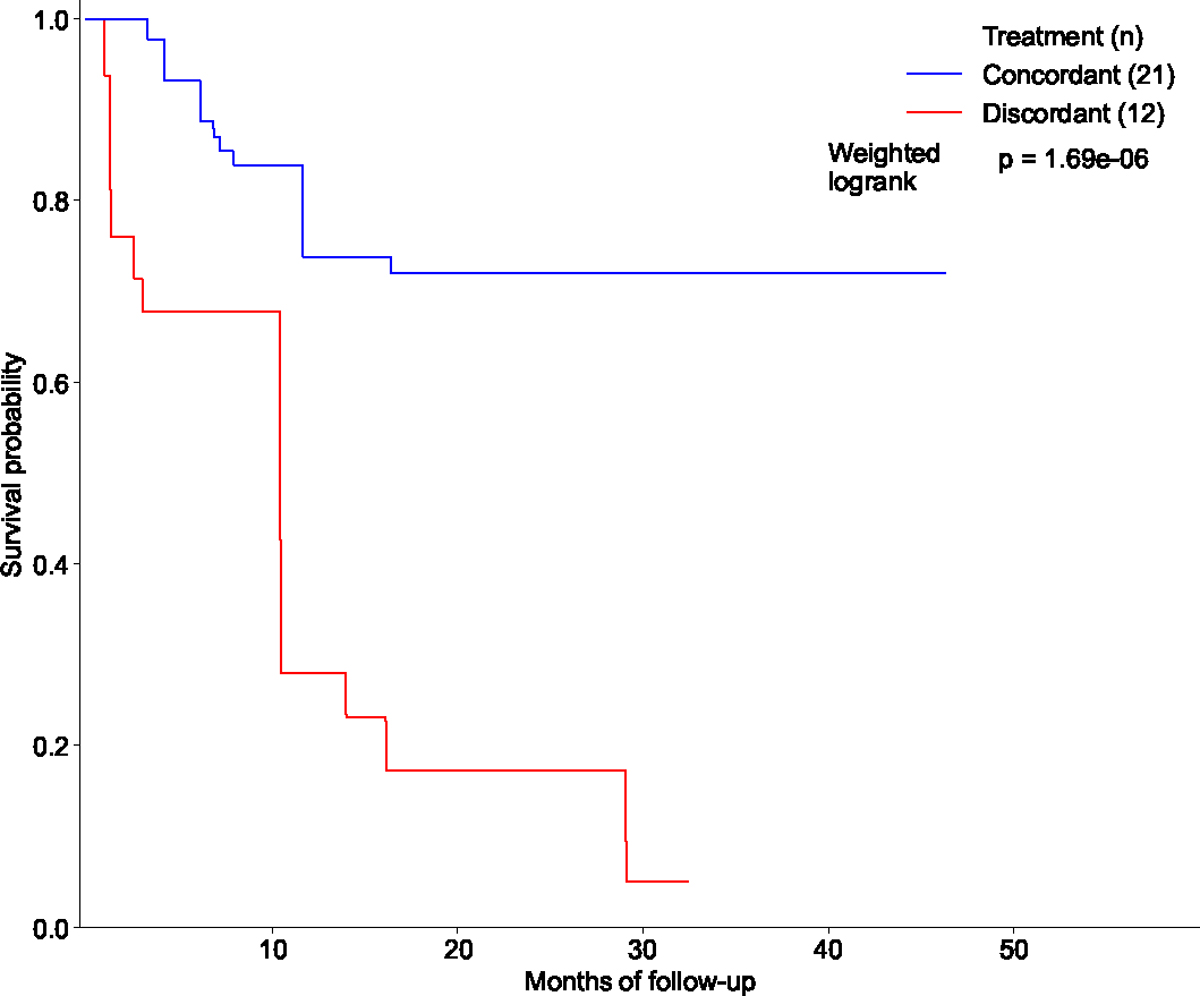
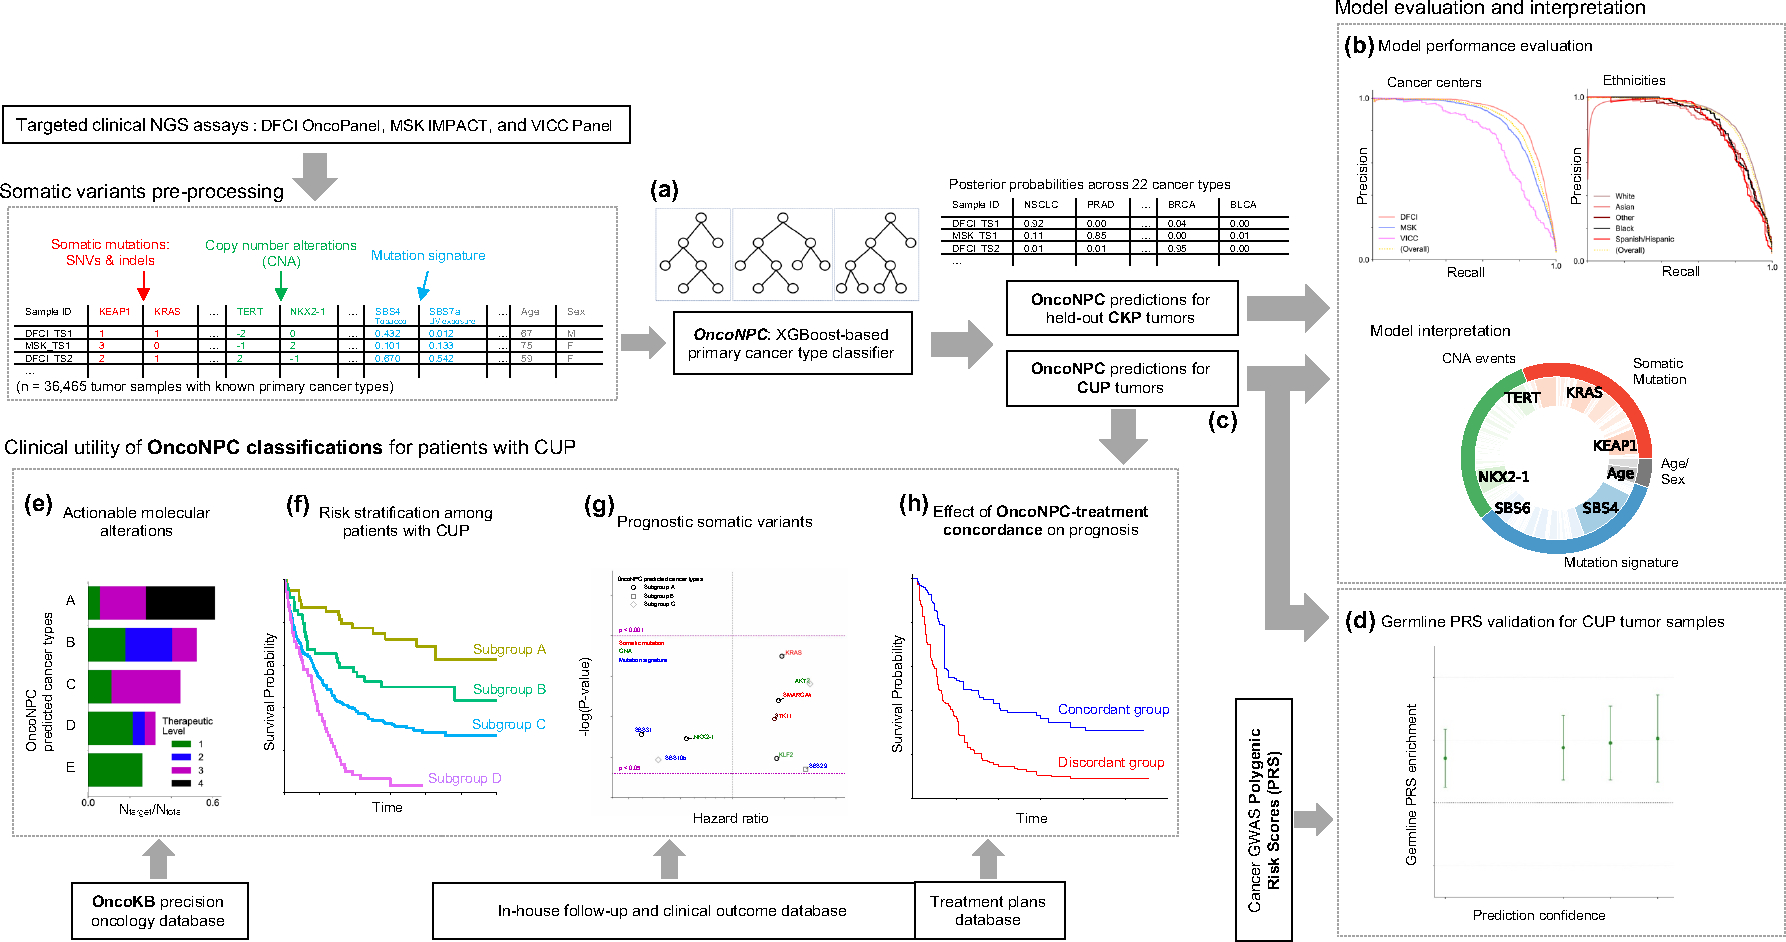
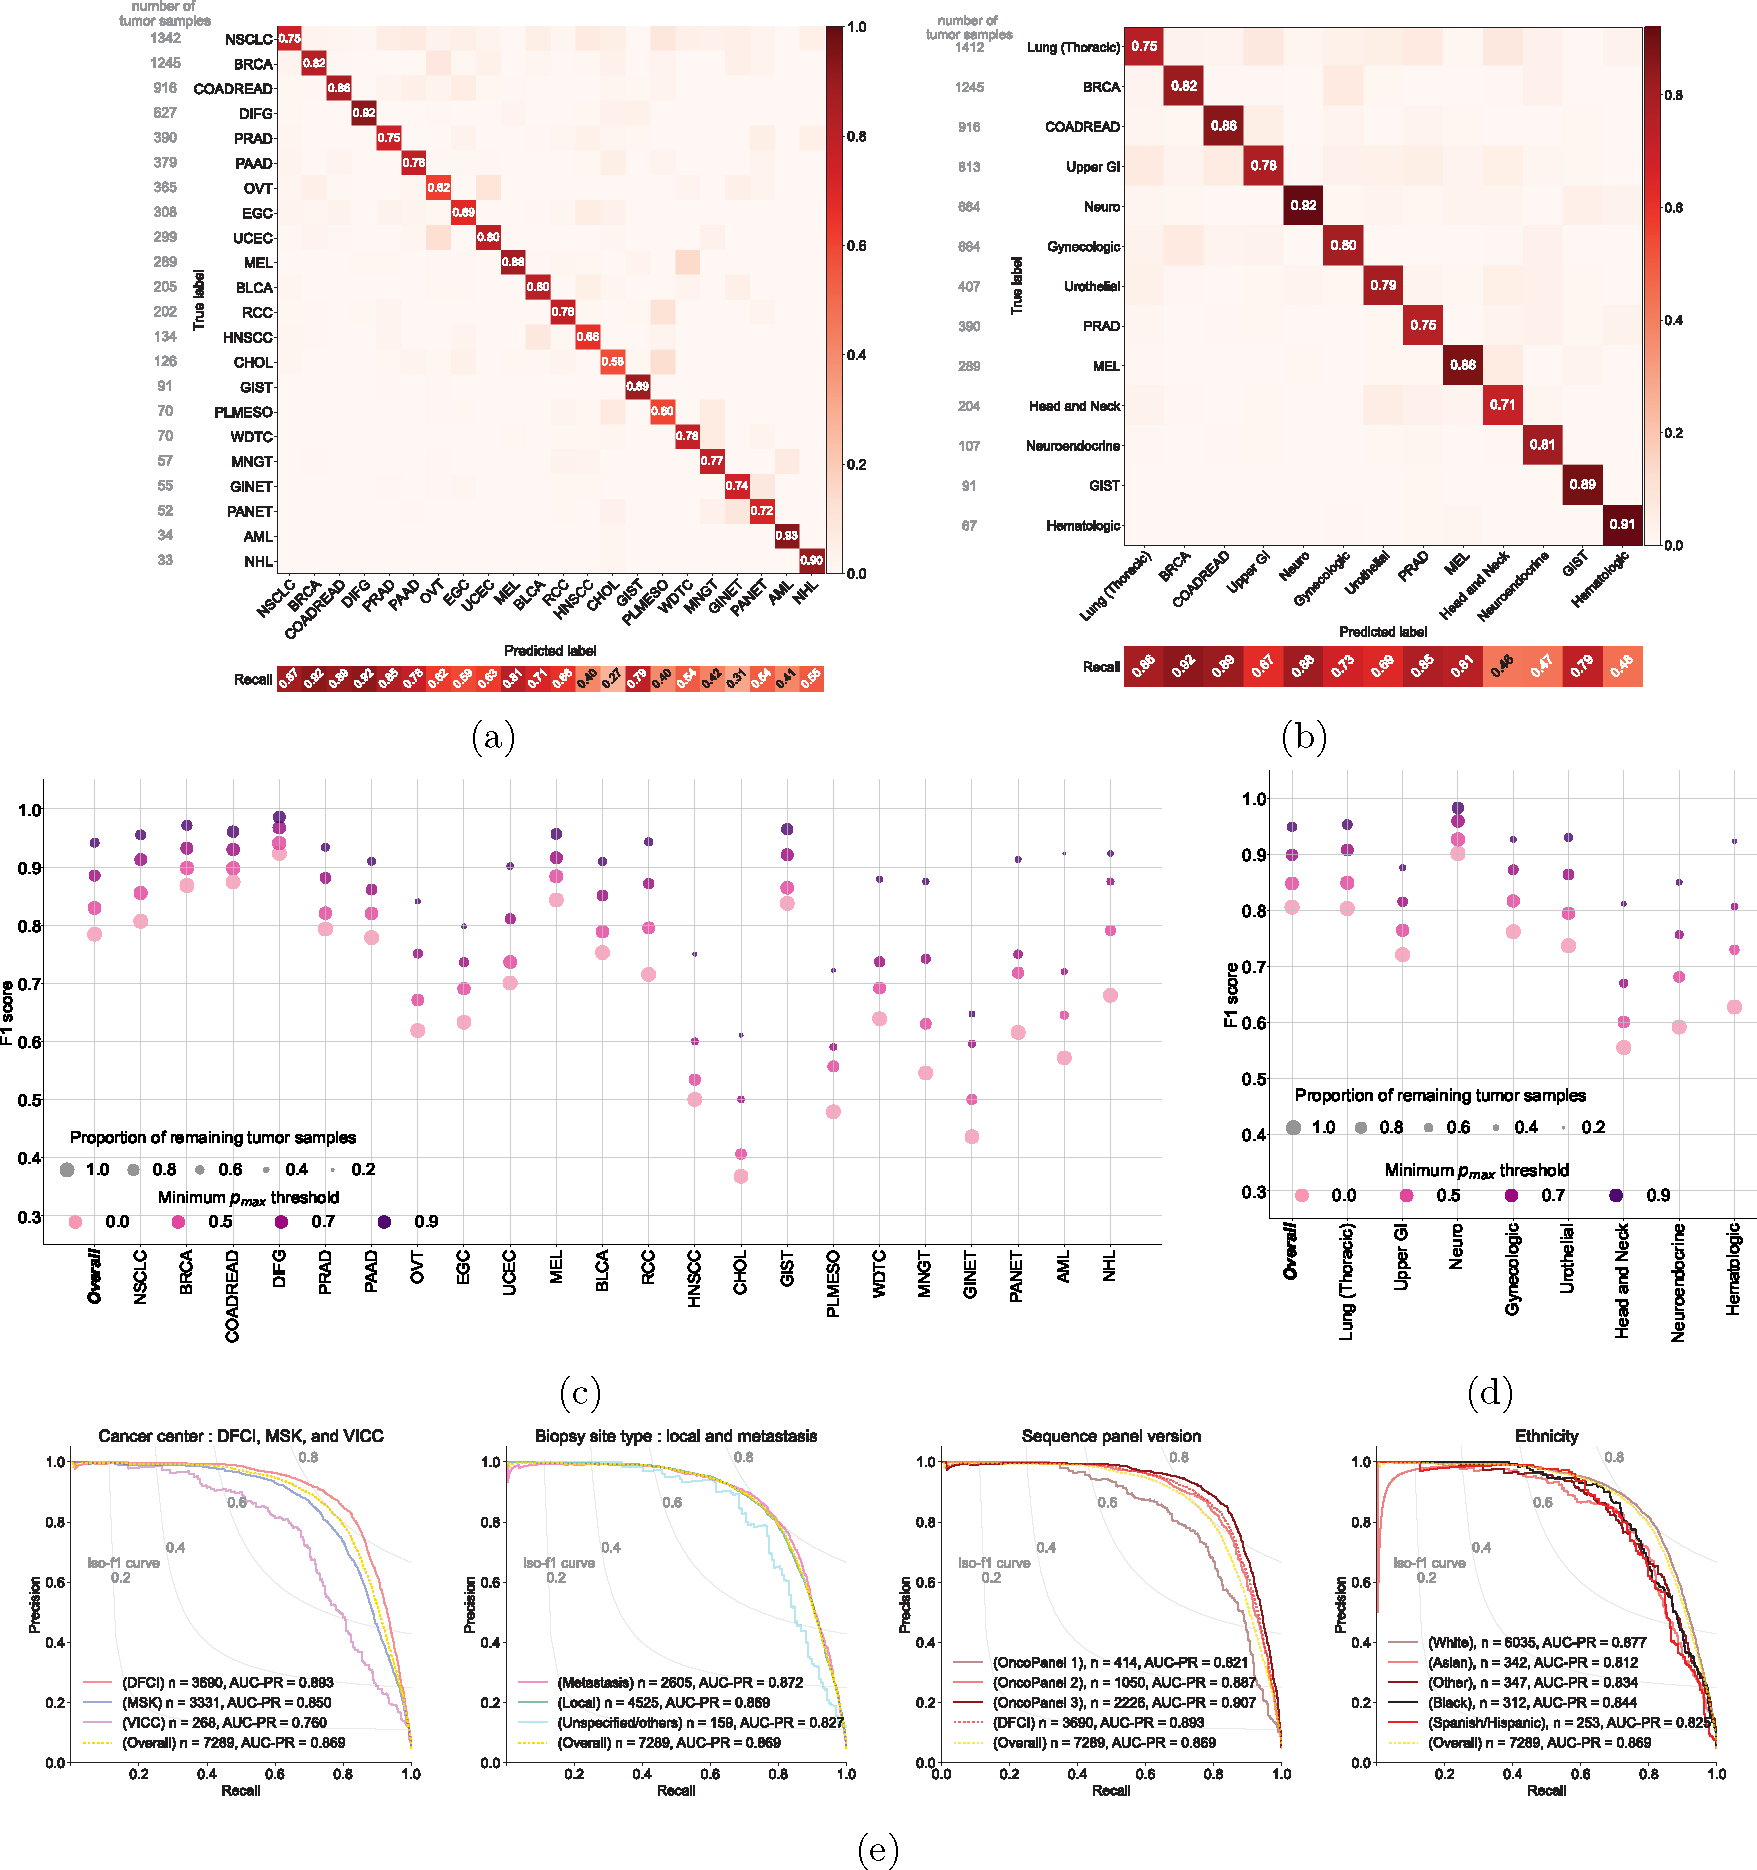
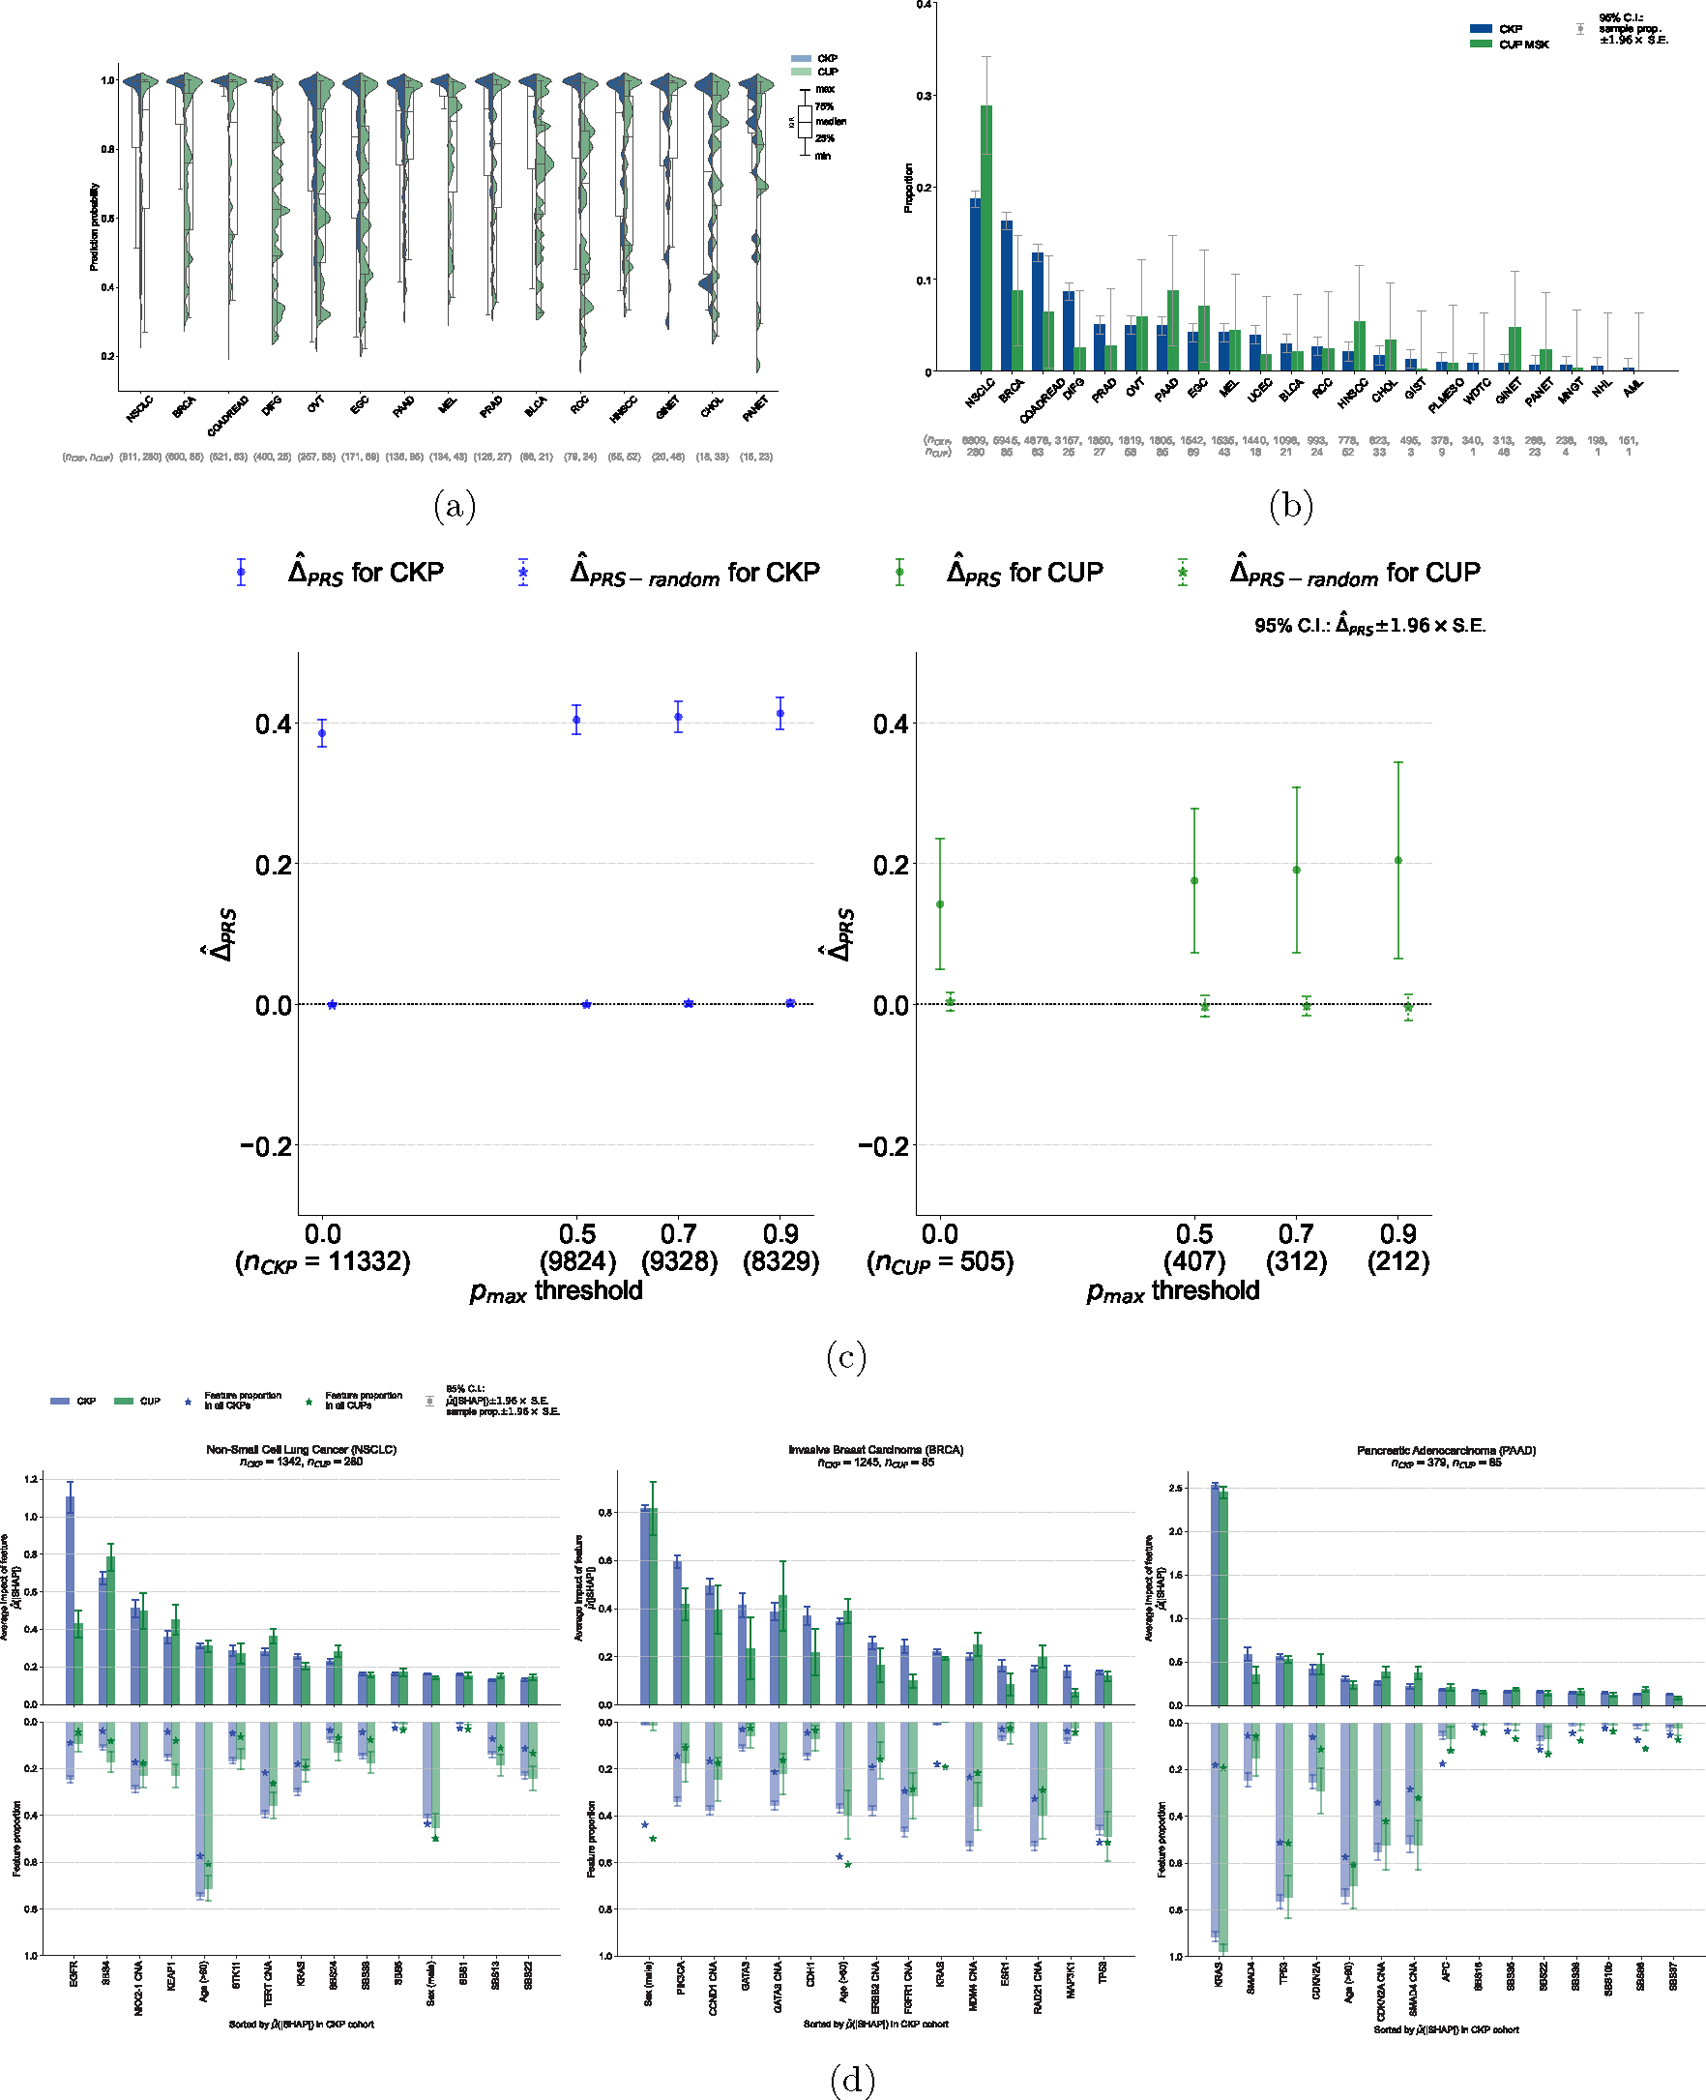
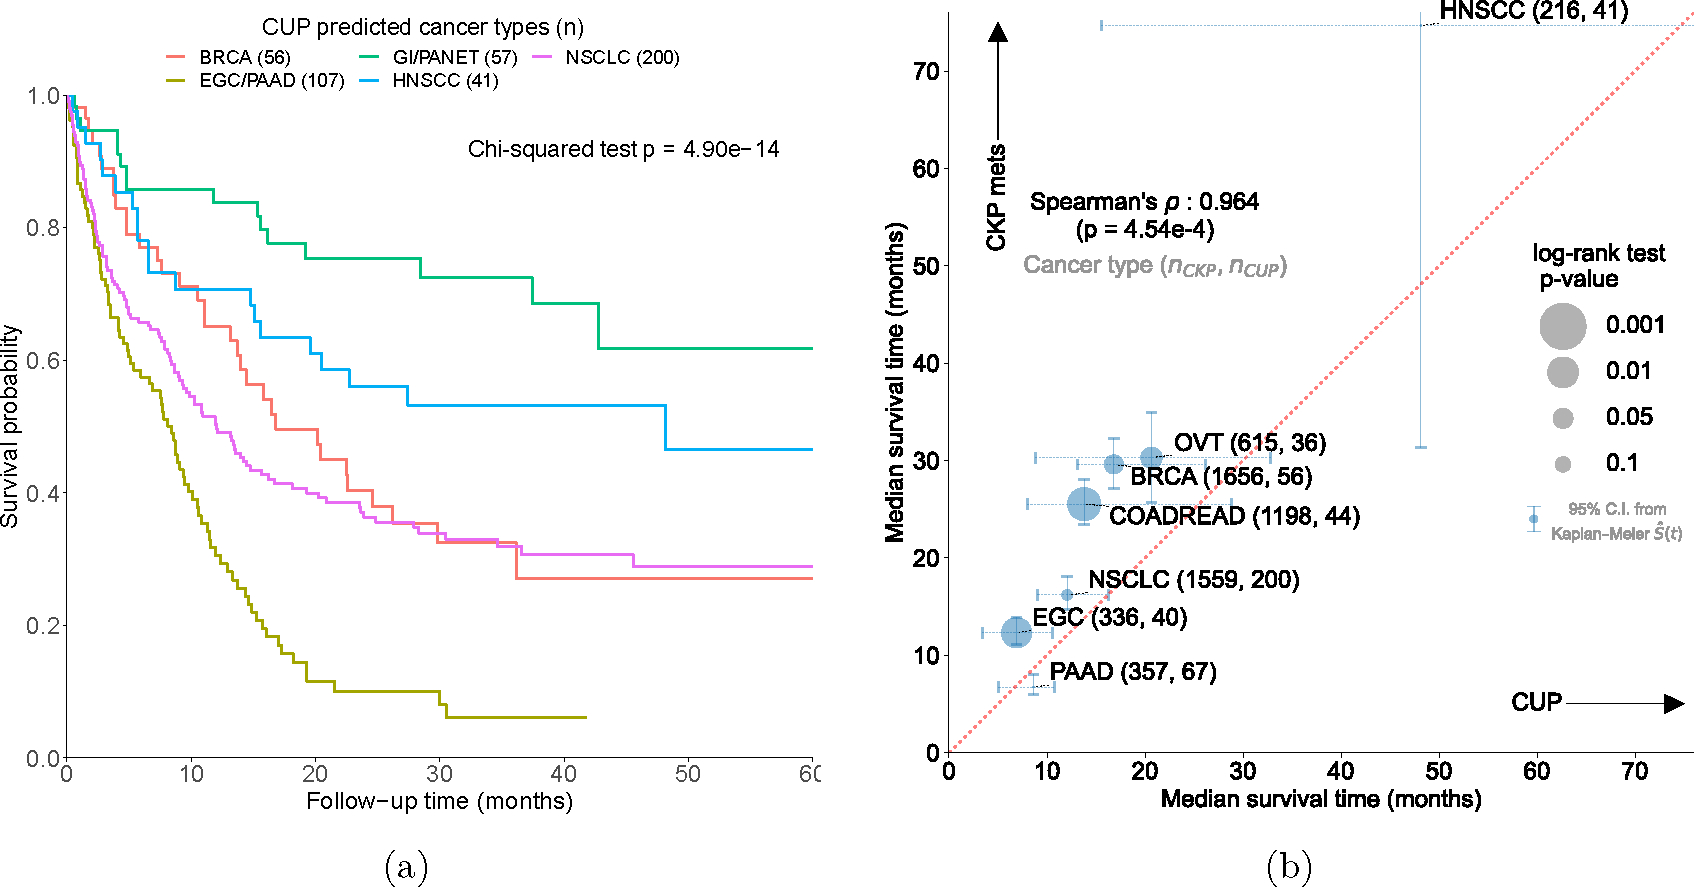
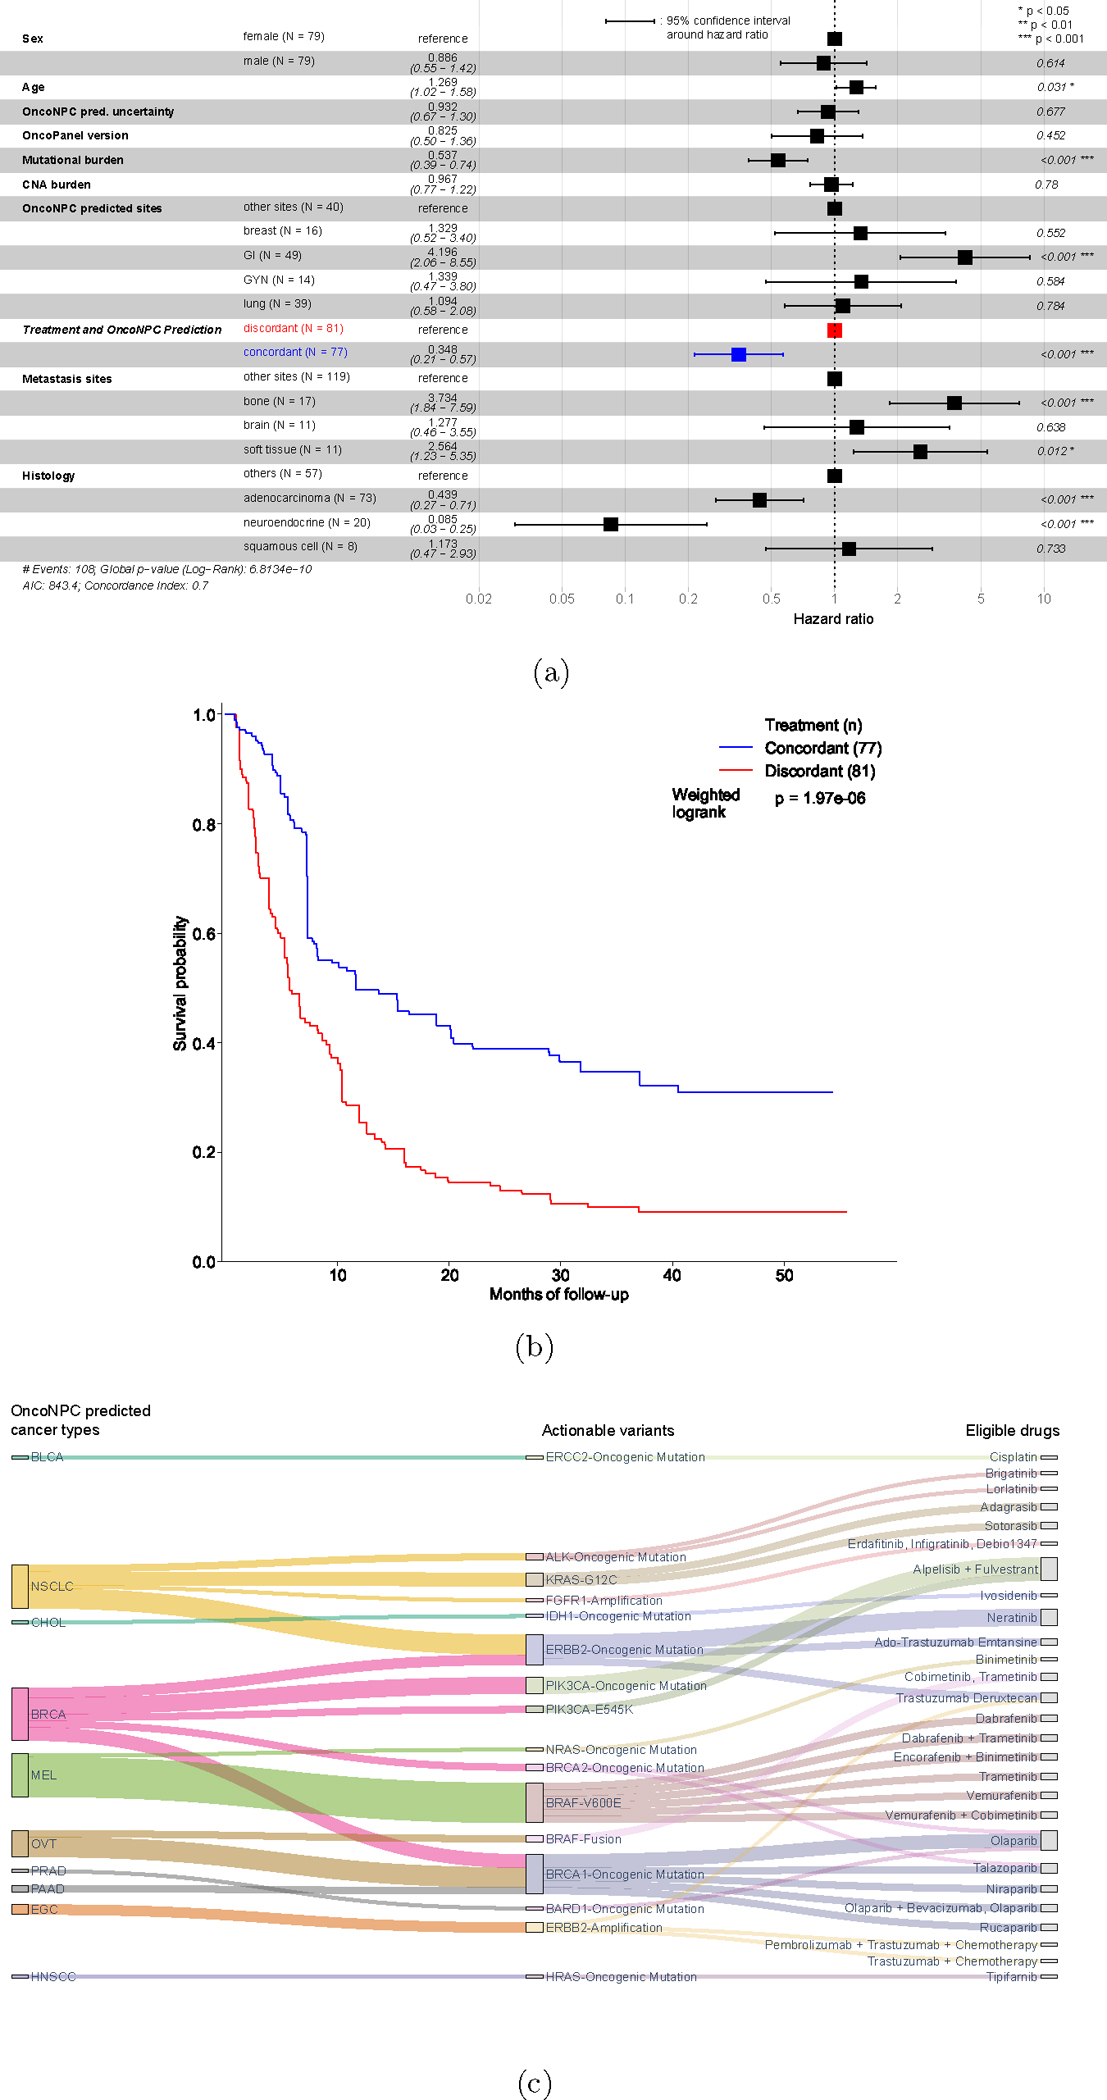
Cancer of unknown primary (CUP) is a type of cancer that cannot be traced back to its primary site and accounts for 3-5% of all cancers. Established targeted therapies are lacking for CUP, leading to generally poor outcomes. We developed OncoNPC, a machine-learning classifier trained on targeted next-generation sequencing (NGS) data from 36,445 tumors across 22 cancer types from three institutions. Oncology NGS-based primary cancer-type classifier (OncoNPC) achieved a weighted F1 score of 0.942 for high confidence predictions ([Formula: see text]) on held-out tumor samples, which made up 65.2% of all the held-out samples. When applied to 971 CUP tumors collected at the Dana-Farber Cancer Institute, OncoNPC predicted primary cancer types with high confidence in 41.2% of the tumors. OncoNPC also identified CUP subgroups with significantly higher polygenic germline risk for the predicted cancer types and with significantly different survival outcomes. Notably, patients with CUP who received first palliative intent treatments concordant with their OncoNPC-predicted cancers had significantly better outcomes (hazard ratio (HR) = 0.348; 95% confidence interval (CI) = 0.210-0.570; P = [Formula: see text]). Furthermore, OncoNPC enabled a 2.2-fold increase in patients with CUP who could have received genomically guided therapies. OncoNPC thus provides evidence of distinct CUP subgroups and offers the potential for clinical decision support for managing patients with CUP.


Conflict of interest statement

Competing Interests Statement

The authors declare no competing interests.

Figures

Extended Data Figure 1:
Extended Data Figure 1:. OncoNPC classification performance: confusion matrix, and precision and recall.
Confusion matrices on the held-out test set (n = 7,289) for (a) 22 detailed cancer types and (b) 13 cancer groups (see Table 1). (c), (d) OncoNPC performance in precision and recall on the test set across (c) cancer types and (d) cancer groups at 4 different prediction confidences using pmax as a threshold. Each dot size is scaled by the proportion of tumor samples retained. In (d), we only considered cancer groups that have more than one cancer type. Overall scores were weighted according to the number of confirmed cases across cancer types and cancer groups, respectively.
Extended Data Figure 2:
Extended Data Figure 2:. OncoNPC prediction performance and prediction confidence levels (i.e., pmax) across different cohorts and centers.
(a) Center-specific OncoNPC performance (in F1) on the test CKP tumor samples (n = 7,289). The figure is a breakdown of Main Fig. 2c based on cancer center (DFCI: ◯, MSK: ◻, VICC: ◇). The performance was evaluated at 4 different prediction confidences (i.e., minimum pmax thresholds). Each dot size is scaled by the proportion of tumor samples retained. See Supplementary Table S3 for the center-specific number of test CKP tumor samples broken down by cancer types and prediction confidence thresholds. (b), (c) Box plots of prediction confidences (pmax) across (b) DFCI CUP tumors, MSK CUP tumors, all DFCI CKP tumors (including those with cancer types not modeled in OncoNPC), DFCI held-out CKP tumors, and DFCI excluded CKP tumors (specifically those with cancer types not modeled in OncoNPC), and (c) DFCI held-out CKP tumors, MSK held-out CKP tumors, and VICC held-out CKP tumors. Note that DFCI excluded CKP tumors refers to the cohort of the rare CKP tumors whose cancer types were not considered during the development of OncoNPC. All cohorts in the analysis for (b) and (c) were not seen by OncoNPC during the model training
Extended Data Figure 3:
Extended Data Figure 3:. Robustness of OncoNPC performance with respect to input genomics features.
The figure shows the breakdown of OncoNPC performance in F1 score by 22 cancer types across increasing prediction confidence. The cancer types on the y-axis are sorted in a decreasing order of the number of tumor samples. In order to investigate the impact of input genomics features on OncoNPC’s robustness, we performed a feature ablation study, where we chose the most important genes based on their aggregated SHAP values and gradually reduced them from all 846 features associated with those genes, as well as age and sex, to only the top 10% (i.e., top 29 features). In each feature configuration, we re-trained the model with the same set of hyperparameters and evaluated its performance on the held-out CKP tumor samples (n = 7,289), which were utilized throughout this work. Supplementary File features_in_each_config_ablation_study.csv, provides a list of input features that correspond to the selected genes in each configuration.
Extended Data Figure 4:
Extended Data Figure 4:. Explanation of OncoNPC prediction for a patient with CUP.
The patient is a 76 year-old male with a tumor biopsy from the liver. The pie chart on the left shows the Top 10 important features across three different feature categories (i.e., CNA events, somatic mutation, and mutation signatures), and the scatter plot on the right shows their SHAP values and feature values. The size of each dot is scaled by corresponding absolute SHAP value. From the chart review, we found that the patient reported a 60-pack year smoking history, as well as having lived near a tar and chemical factory as a child. Despite the CUP diagnosis, OncoNPC confidently classified the primary site as NSCLC with posterior probability of 0.98. SBS4, a tobacco smoking-associated mutation signature, was significantly enriched in the patient’s tumor sample, which has, by far, the most impact on the prediction, followed by SBS24 mutation signature associated with known exposures to aflatoxin, and KRAS mutation.
Extended Data Figure 5:
Extended Data Figure 5:. Germline Polygenic Risk Score (PRS) enrichment of CKP tumor samples and CUP tumor samples, broken down by 8 different cancer types.
(a) Colorectal Adenocarcinoma (COADREAD), (b) Diffuse Glioma (DIFG), (c) Invasive Breast Carcinoma (BRCA), (d) Melanoma (MEL), (e) Non-Small Cell Lung Cancer (NSCLC), (f) Ovarian Epithelial Tumor (OVT), (g) Prostate Adenocarcinoma (PRAD), and (h) Renal Cell Carcinoma (RCC). The magnitude of the enrichment is quantified by ΔˆPRS: the mean difference between the concordant (i.e. OncoNPC matching) cancer type PRS and mean of PRSs of discordant cancer types (see Methods). ΔˆPRS is shown for CKPs in blue (for reference) and CUPs in green.
Extended Data Figure 6:
Extended Data Figure 6:. Exclusion criteria for downstream clinical analyses
.
Extended Data Figure 7:
Extended Data Figure 7:. Estimated survival curves for the concordant and discordant treatment groups among patients with CUP, broken down by OncoNPC predicted cancer types.
(a) BRCA, (b) Gastrointestinal (GI) group (CHOL, COADREAD, EGC, and PAAD), (c) Lung (NSCLC and PLMESO), and (d) Other OncoNPC cancer types (BLCA, DIFG, GINET, HNSCC, MEL, OVT, PANET, PRAD, RCC, and UCEC). In each figure, the concordant treatment group and discordant treatment group are shown in blue and red, respectively. To estimate each survival curve, we utilized Inverse Probability of Treatment Weighted (IPTW) Kaplan-Meier estimator while adjusting for patient covariates and left truncation until time of sequencing (see Methods). Statistical significance of the survival difference between the two groups was estimated by a weighted log-rank test.
Extended Data Figure 8:
Extended Data Figure 8:. Estimated survival curves for the concordant and discordant treatment groups among patients with CUP who received their initial treatments after the results of the OncoPanel sequencing were available to clinicians.
Similarly, we utilized Inverse Probability of Treatment Weighted (IPTW) Kaplan-Meier estimator for each survival curve while adjusting for patient covariates and left truncation until time of sequencing (see Methods). Statistical significance of the survival difference between the two groups was estimated by a weighted log-rank test. Refer to Supplementary Table S2 for demographic information on the cohort.
Extended Data Figure 9:
Extended Data Figure 9:. OncoNPC-guided actionable variants in patients with CUP.
(a) The number of CUP tumors with actionable targets, based on OncoKB (see Methods), across actionable somatic variants (mutations, amplifications, and fusions). Each bar corresponds to an actionable target, color-coded by the number of CUP tumors in each predicted cancer type. Note that each tumor may contain more than one actionable somatic variant. (b) Proportions of CUP tumor samples with actionable somatic variants (Naction) to the total number of patients (Ntotal) across OncoNPC predicted cancer types. Proportions for 4 different therapeutic levels based on OncoKB, are shown in each bar: Level 1 - FDA-approved drugs, Level 2 – standard of care drugs, Level 3 - drugs supported by clinical evidence, and Level 4 - drugs supported by biological evidence.
Figure 1:
Figure 1:. Overview of model development and analysis workflow.
(a) OncoNPC, a XGBoost-based classifier, was trained and evaluated using 36,729 Cancers of Known Primary (CKP) tumor samples across 22 cancer types collected from three different cancer centers. (b) OncoNPC performance was evaluated on the held-out tumor samples (n = 7,289). (c) OncoNPC was applied to 971 CUP tumor samples at a single institution to predict primary cancer types. OncoNPC predicted CUP subgroups were then investigated for association with: (d) elevated germline risk, (e) actionable molecular alterations, (f) overall survival, and (g) prognostic somatic features. (h) A subset of CUP patients with detailed treatment data were evaluated for treatment-specific outcomes.
Figure 2:
Figure 2:. Cancer type classification performance of OncoNPC.
The normalized confusion matrix of OncoNPC classification performance on the held-out test set (n = 7,289) for (a) 22 detailed cancer types and (b) 13 cancer groups (see Table 1). Each confusion matrix displays precision for each cancer type or group on its diagonal. Below the matrix, the recall for each cancer type or group is shown, and the sample size is displayed to the left of the matrix for reference. The performance of OncoNPC in F1 score on the test set across cancer types (c) and groups (d) at 4 different pmax (i.e., prediction confidence) thresholds. Each dot size is scaled by the proportion of tumor samples retained. Note that in (d), we only considered cancer groups that have more than one cancer type. Overall F1 scores were weighted according to the number of confirmed cases across cancer types and cancer groups, respectively. (e) The precision-recall curves showing OncoNPC’s performance on the test set when grouped by cancer center, biopsy site type, sequence panel version, and ethnicity. The yellow dotted curve represents the baseline performance across the entire test set.
Figure 3:
Figure 3:. Application of OncoNPC to CUP tumors, germline PRS-based validation, and interpretation of OncoNPC cancer type predictions.
(a) Empirical distributions of prediction probabilities for correctly predicted, held-out CKP tumor samples (n = 3,429) and CUP tumor samples (n = 934) across CKP cancer types (blue) and their corresponding OncoNPC predicted cancer types for CUP tumors (green). Only OncoNPC classifications with at least 20 CUP tumor samples are shown. (b) Proportion of each CKP cancer type and the corresponding OncoNPC predicted CUP cancer type. All training CKP tumor samples (n = 36,445) and all held-out CUP tumor samples (n = 971) are included. For both (a) and (b), the cancer types (x-axis) are ordered by the number of CKP tumor samples in each cancer type. (c) Germline Polygenic Risk Score (PRS) enrichment of the CKP tumor samples (n = 11,332) and CUP tumor samples with available PRS data (n = 505) averaged across 8 cancer types. The magnitude of the enrichment is quantified by ΔˆPRS: the mean difference between the concordant (i.e., OncoNPC matching) cancer type PRS and mean of PRSs of discordant cancer types (see Methods). ΔˆPRS is shown for CKPs in blue (for reference) and CUPs in green. As a negative control, ΔˆPRS-random is also shown after permuting the OncoNPC labels. (d) Top 15 most important features based on mean absolute SHAP values (i.e., μˆ(|SHAP|)) for the top 3 most frequently predicted cancer types in the CUP cohort: Non-Small Cell Lung Cancer (NSCLC), Invasive Breast Carcinoma (BRCA), and Pancreatic Adenocarcinoma (PAAD). The feature proportion (i.e., carrier rate) for each feature in corresponding CKP and CUP cancer cohorts as well as the entire CKP and CUP cohorts are shown as bars going downwards and star-shaped markers, respectively. For mutation signature features that have continuous values, individuals with feature values one standard deviation above the mean were treated as positives and the rest as negative. For age, individuals above the population mean were treated as positives and the rest as negatives. 95% confidence intervals were determined using the standard error of the sample mean for μˆ(|SHAP|)) and the standard error of the sample proportion for the carrier rate. These intervals are centered at the respective sample values.
Figure 4:
Figure 4:. OncoNPC-based risk stratification among patients with CUP and median survival comparison between CUP and CKP metastatic cases.
(a) Survival stratification for patients with CUP based on their OncoNPC predicted cancer types. The Kaplan-Meier estimator was used to estimate survival probability for each predicted cancer type over the follow-up time of 60 months from sequence date, with the statistical significance assessed by Chi-square test. (b) Median survival comparison between patients with CUP (across predicted cancer types in x-axis) and patients with CKP metastatic cancer (across corresponding cancer types in y-axis): Spearman’s rho 0.964 (p-value: 4.54 × 10⁻⁴). The size of each dot reflects the p-value of the log-rank test for significant difference in median survival between CUP-metastatic CKP pairs. Only cancer types with at least 30 CUP tumor samples having OncoNPC prediction probabilities greater than 0.5 are shown. 95% confidence intervals were obtained non-parametrically using Kaplan-Meier estimated survival function Sˆ(t).
Figure 5:
Figure 5:. Potential clinical decision support for patients with CUP based on OncoNPC predictions of their tumors.
(a) Forest plot of a multivariable Cox Proportional Hazards Regression on patients in the CUP cohort with first-line palliative treatment records at DFCI (n = 158; see Extended Data Fig. 6 for the exclusion criteria). Treatment concordance (colored in blue), encoded as 1 when the first palliative treatment a patient received at DFCI is concordant with their corresponding OncoNPC prediction and 0 otherwise, was significantly associated with overall survival of patients in the cohort (H.R. 0.348, 95% C.I. 0.210 – 0.570, p-value 2.32 × 10⁻⁵). (b) Estimated survival curves for patients with CUP in the concordant treatment group (shown in blue) and discordant treatment group (shown in red), respectively. To estimate the survival function for each group, we utilized Inverse Probability of Treatment Weighted (IPTW) Kaplan-Meier estimator while adjusting for left truncation until time of sequencing (see Methods). Statistical significance of the survival difference between the two groups was estimated by a weighted log-rank test. (c) Sankey diagram showing the OncoNPC predicted cancer types, corresponding actionable variants, and eligible drugs for 24 patients with CUP, which represented 15.2% of the patients in the treatment concordance analysis cohort (n = 158). These patients were identified as having the potential to receive genomically-guided treatments based on their OncoNPC predicted cancer types and actionable variants.

Update of

Comment in

  • AI Helps Untangle Cancer Mysteries.
    [No authors listed] [No authors listed] Cancer Discov. 2023 Oct 5;13(10):2114. doi: 10.1158/2159-8290.CD-NB2023-0063. Cancer Discov. 2023. PMID: 37638809

References

    1. Pavlidis N, Khaled H, and Gaafar R, “A mini review on cancer of unknown primary site: A clinical puzzle for the oncologists,” Journal of advanced research, vol. 6, no. 3, pp. 375–382, 2015. - PMC - PubMed
    1. Varadhachary GR and Raber MN, “Cancer of unknown primary site,” New England Journal of Medicine, vol. 371, no. 8, pp. 757–765, 2014. - PubMed
    1. Hyman DM et al. , “Vemurafenib in multiple nonmelanoma cancers with braf v600 mutations,” New England Journal of Medicine, vol. 373, no. 8, pp. 726–736, 2015. - PMC - PubMed
    1. Hainsworth JD and Greco FA, “Cancer of unknown primary site: New treatment paradigms in the era of precision medicine,” American Society of Clinical Oncology Educational Book, vol. 38, pp. 20–25, 2018. - PubMed
    1. Anderson GG and Weiss LM, “Determining tissue of origin for metastatic cancers: Meta-analysis and literature review of immunohistochemistry performance,” Applied Immunohistochemistry & Molecular Morphology, vol. 18, no. 1, pp. 3–8, 2010. - PubMed

Publication types

MeSH terms

LinkOut - more resources