. 2023 Aug;29(8):1979-1988.
doi: 10.1038/s41591-023-02476-4. Epub 2023 Aug 7.

Cerebrospinal fluid proteomics define the natural history of autosomal dominant Alzheimer's disease

Collaborators, Affiliations

Cerebrospinal fluid proteomics define the natural history of autosomal dominant Alzheimer's disease

Erik C B Johnson et al. Nat Med. 2023 Aug.

Abstract

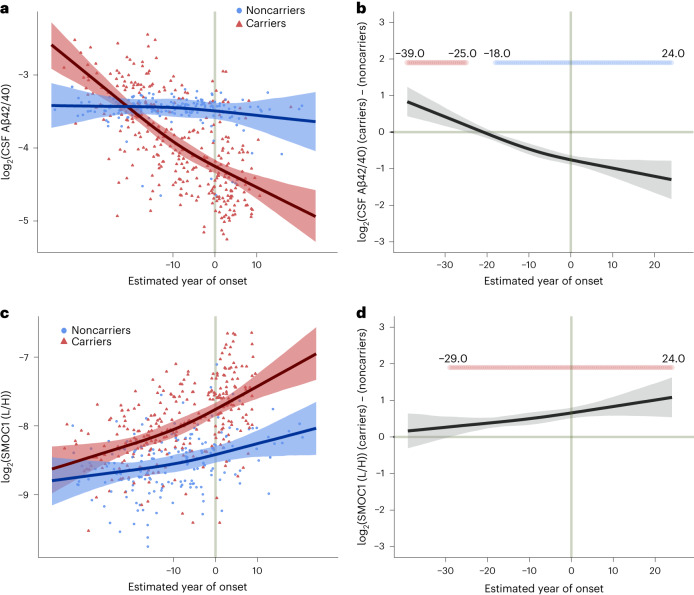
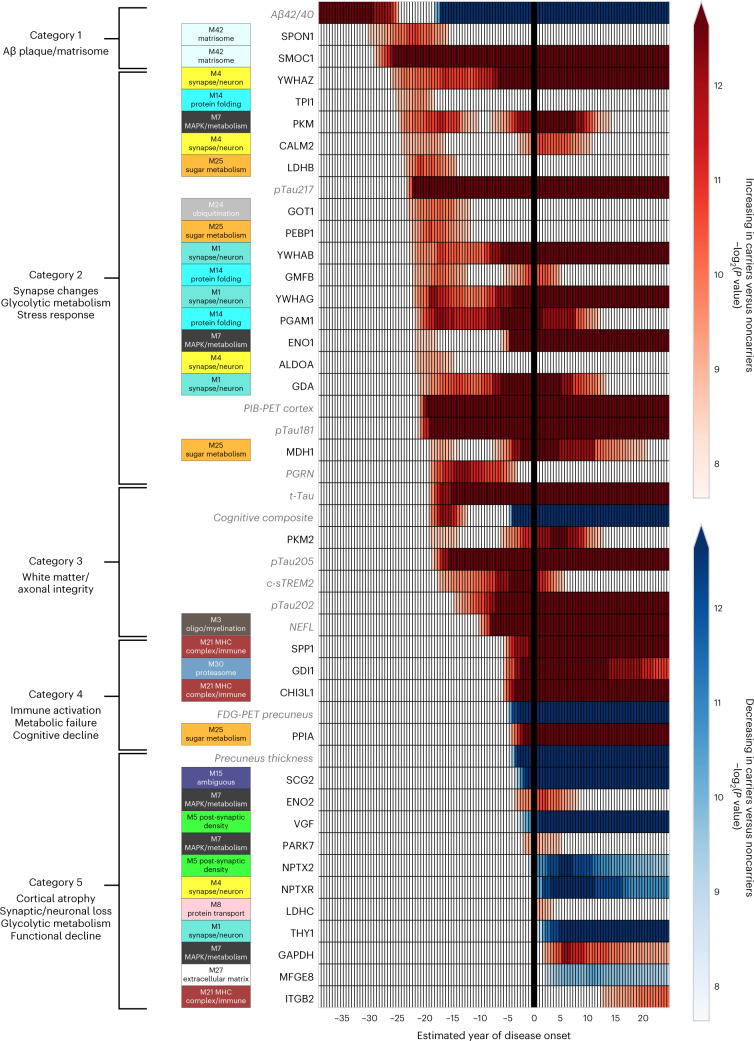
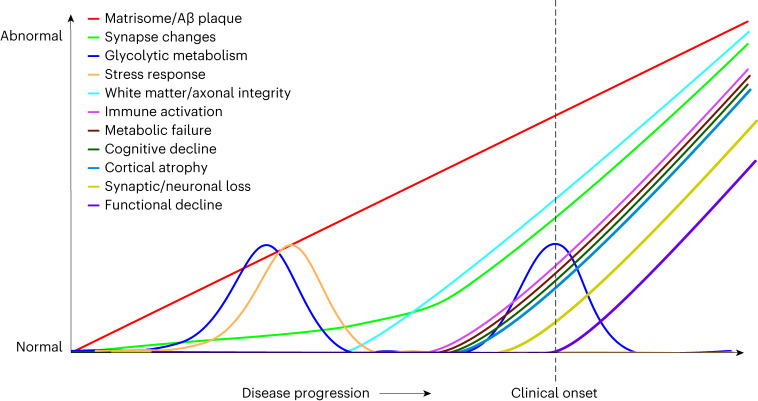
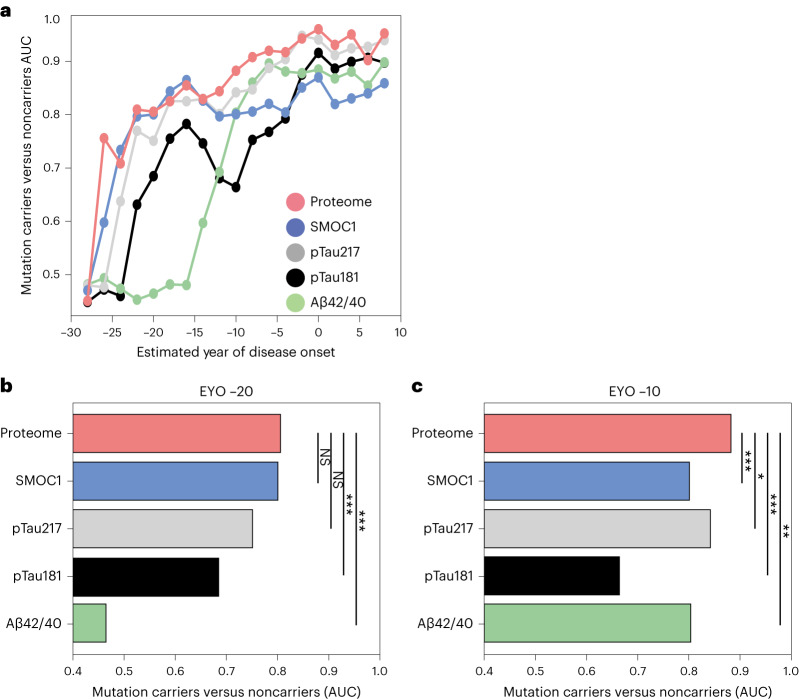
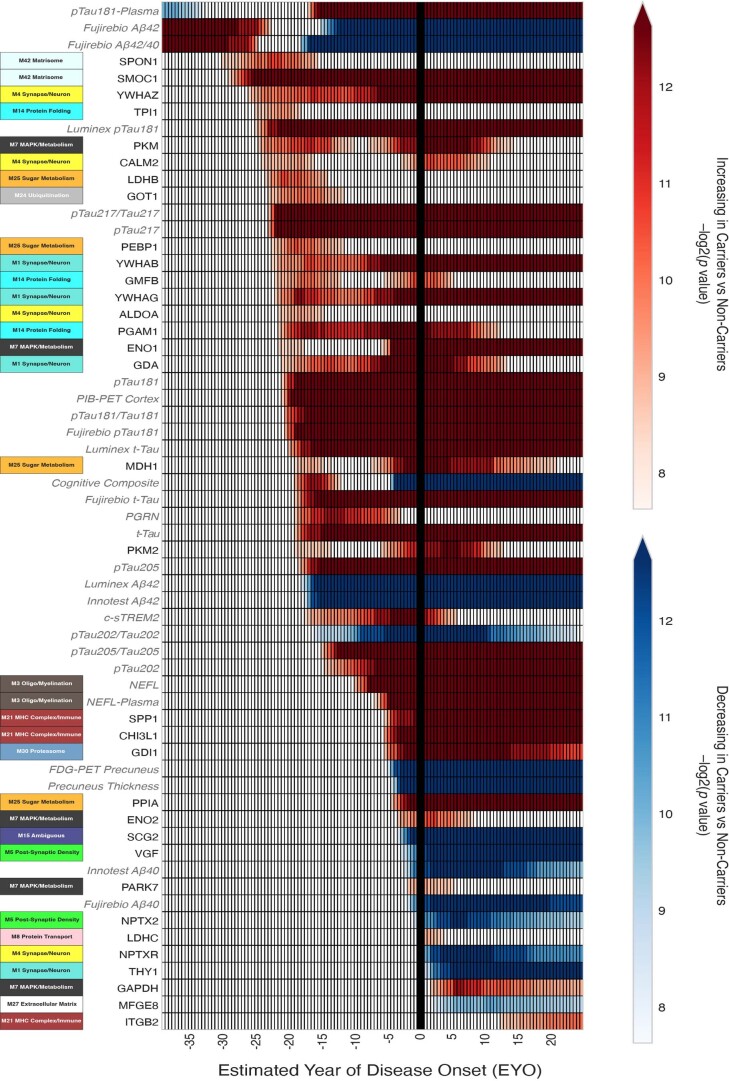
Alzheimer's disease (AD) pathology develops many years before the onset of cognitive symptoms. Two pathological processes-aggregation of the amyloid-β (Aβ) peptide into plaques and the microtubule protein tau into neurofibrillary tangles (NFTs)-are hallmarks of the disease. However, other pathological brain processes are thought to be key disease mediators of Aβ plaque and NFT pathology. How these additional pathologies evolve over the course of the disease is currently unknown. Here we show that proteomic measurements in autosomal dominant AD cerebrospinal fluid (CSF) linked to brain protein coexpression can be used to characterize the evolution of AD pathology over a timescale spanning six decades. SMOC1 and SPON1 proteins associated with Aβ plaques were elevated in AD CSF nearly 30 years before the onset of symptoms, followed by changes in synaptic proteins, metabolic proteins, axonal proteins, inflammatory proteins and finally decreases in neurosecretory proteins. The proteome discriminated mutation carriers from noncarriers before symptom onset as well or better than Aβ and tau measures. Our results highlight the multifaceted landscape of AD pathophysiology and its temporal evolution. Such knowledge will be critical for developing precision therapeutic interventions and biomarkers for AD beyond those associated with Aβ and tau.


Conflict of interest statement

D.M.D., N.T.S. and A.I.L. are founders of EmTheraPro. T.S.W. is a co-founder of revXon. The other authors declare no competing interests.

Figures

Fig. 1
Fig. 1. Aβ42/40 ratio and SMOC1 level in CSF by EYO in ADAD.
a,b, The ratio of CSF Aβ42 to Aβ40 peptide as a measure of Aβ brain deposition (a) in ADAD mutation carriers and noncarriers and (b) the difference between carriers and noncarriers, by EYO. One outlier was removed from a for visualization purposes. c,d, CSF level of SMOC1—an Aβ plaque-associated protein—(c) in mutation carriers and noncarriers and (d) the difference between carriers and noncarriers, by EYO. One outlier was removed from c for visualization purposes. EYO labels outside the range of –10 to 10 in a and c are removed to maintain research participant confidentiality. Periods of significant difference between carriers and noncarriers are highlighted in b and d (red indicates significantly increased levels in carriers, blue indicates significantly decreased levels in carriers). Lines represent the median of the posterior estimates at each EYO point for carriers and noncarriers. Shaded areas represent the 99% credible interval. Aβ42 and Aβ40 measurements were from the Fujirebio Lumipulse assay, whereas the SMOC1 measurement was from SRM-MS. L/H, ratio of endogenous peptide signal (light) to the isotopically labeled standard peptide signal (heavy).
Fig. 2
Fig. 2. Categories of biomarker changes by EYO in ADAD.
Differences between ADAD mutation carriers and noncarriers in levels of CSF biomarker proteins, imaging measures and cognitive function were modeled across the disease course by EYO. Heat represents significant differences between mutation carriers and noncarriers, with the color threshold set at the 99% credible interval (red, increased in carriers; blue, decreased in carriers). All CSF proteins were measured by MS except for PGRN, c-sTREM2 and NEFL, which were measured by ELISA as previously described,,. Aβ42/40 ratio was measured by the Fujirebio Lumipulse ELISA assay. Additional biomarker measurements are provided in Extended Data Fig. 1. Biomarker measurements available in DIAN used to benchmark the targeted proteomic measurements are shown in gray italics. CSF proteins were mapped to the corresponding AD brain coexpression module as described in ref. . Unmapped proteins were not measured in brain. Targeted proteins are listed by their gene symbols. UniProt accessions for each targeted protein are provided in Supplementary Table 2. ALDOA, fructose-bisphosphate aldolase A; CALM2, calmodulin-2; ENO1, alpha-enolase; ENO2, gamma-enolase; FDG-PET precuneus, FDG-PET precuneus signal; GAPDH, glyceraldehyde-3-phosphate dehydrogenase; GDA, guanine deaminase; GDI1, rab GDP dissociation inhibitor alpha; GMFB, glia maturation factor beta; GOT1, aspartate aminotransferase; ITGB2, integrin beta-2; LDHB, l-lactate dehydrogenase B chain; LDHC, l-lactate dehydrogenase C chain; MDH1, malate dehydrogenase, cytoplasmic; MFGE8, lactadherin; NPTXR, neuronal pentraxin receptor; NPTX2, neuronal pentraxin-2; PARK7, parkinson disease protein 7; PEBP1, phosphatidylethanolamine-binding protein 1; PGAM1, phosphoglycerate mutase 1; PKM, pyruvate kinase; PKM2, pyruvate kinase 2; PIB-PET Cortex, PIB-PET total cortex signal; PPIA, peptidyl-prolyl cis–trans isomerase A; SCG2, secretogranin-2; t-Tau, tau peptide 181–190, a marker of total tau levels; THY1, thy1 membrane glycoprotein; TPI1, triosephosphate isomerase; VGF, neurosecretory protein VGF; YWHAB, 14-3-3 protein beta; YWHAG, 14-3-3 protein gamma; YWHAZ, 14-3-3 protein zeta.
Fig. 3
Fig. 3. Proposed biomarker cascade in ADAD.
The magnitude of change depicted by the y axis is arbitrary, and magnitudes are not comparable across different biomarker categories.
Fig. 4
Fig. 4. Discrimination of ADAD mutation carriers from noncarriers.
a, The ability of Aβ42/40, pTau181, pTau217, SMOC1 and a composite of 33 proteins (proteome) to discriminate mutation carriers from noncarriers across the disease course was assessed using the AUC (higher values equal better discrimination). Each point indicates classification performance (AUC) for carriers and noncarriers over a 10-year time window centered at that particular time point. b, AUC of the ROC curve for each measure with the 10-year time window centered at EYO −20. c, AUC of the ROC curve for each measure with the 10-year time window centered at EYO −10. Significant differences between the proteome and other measures were determined using a nonparametric permutation procedure as described in Methods. The resulting two-sided P values were not corrected for multiple comparisons. *P < 0.05, **P < 0.01, ***P < 0.001. NS, not significant.
Extended Data Fig. 1
Extended Data Fig. 1. Biomarker Changes by Estimated Year of Disease Onset in ADAD.
Data is presented as described in Fig. 2, but includes additional measurements of Aβ and tau species. Biomarker measurements available in DIAN used to benchmark the targeted proteomic measurements are shown in gray italics.

References

    1. GBD 2019 Dementia Forecasting Collaborators. Estimation of the global prevalence of dementia in 2019 and forecasted prevalence in 2050: an analysis for the Global Burden of Disease Study 2019. Lancet Public Health. 2022;7:e105–e125. doi: 10.1016/S2468-2667(21)00249-8. - DOI - PMC - PubMed
    1. Jack CR, Jr, et al. NIA-AA research framework: toward a biological definition of Alzheimer’s disease. Alzheimers Dement. 2018;14:535–562. doi: 10.1016/j.jalz.2018.02.018. - DOI - PMC - PubMed
    1. Boerwinkle AH, et al. Temporal correlation of CSF and neuroimaging in the amyloid-tau-neurodegeneration model of Alzheimer disease. Neurology. 2021;97:e76–e87. doi: 10.1212/WNL.0000000000012123. - DOI - PMC - PubMed
    1. Karikari TK, et al. Diagnostic performance and prediction of clinical progression of plasma phospho-tau181 in the Alzheimer’s Disease Neuroimaging Initiative. Mol. Psychiatry. 2021;26:429–442. doi: 10.1038/s41380-020-00923-z. - DOI - PubMed
    1. Leuzy A, et al. Blood-based biomarkers for Alzheimer’s disease. EMBO Mol. Med. 2022;14:e14408. doi: 10.15252/emmm.202114408. - DOI - PMC - PubMed

Publication types